Cities with the Highest Percentage of Population Employed in Health Technologists in Kentucky
RELATED REPORTS & OPTIONS
Health Technologists
Kentucky
Compare Cities
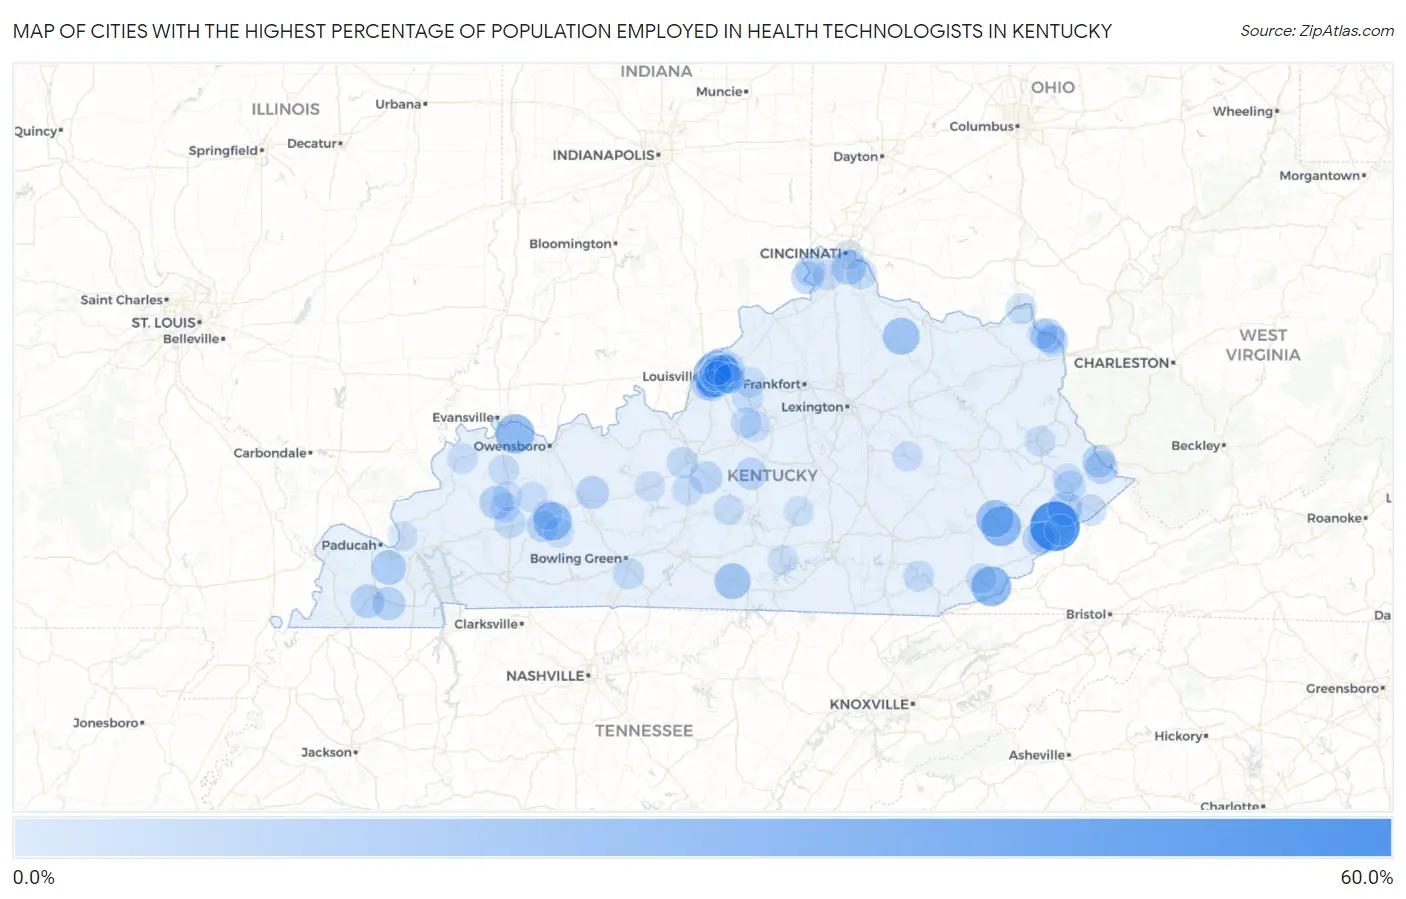
Map of Cities with the Highest Percentage of Population Employed in Health Technologists in Kentucky
0.0%
60.0%
Cities with the Highest Percentage of Population Employed in Health Technologists in Kentucky
| City | % Employed | vs State | vs National | |
| 1. | Mcroberts | 57.4% | 4.8%(+52.6)#1 | 4.3%(+53.1)#26 |
| 2. | Cawood | 32.4% | 4.8%(+27.6)#2 | 4.3%(+28.1)#127 |
| 3. | Jeff | 31.9% | 4.8%(+27.1)#3 | 4.3%(+27.6)#136 |
| 4. | Spottsville | 30.4% | 4.8%(+25.5)#4 | 4.3%(+26.1)#152 |
| 5. | Cleaton | 28.3% | 4.8%(+23.5)#5 | 4.3%(+24.0)#177 |
| 6. | Mockingbird Valley | 27.6% | 4.8%(+22.7)#6 | 4.3%(+23.3)#182 |
| 7. | Hazard | 25.7% | 4.8%(+20.8)#7 | 4.3%(+21.4)#210 |
| 8. | Mount Olivet | 24.5% | 4.8%(+19.6)#8 | 4.3%(+20.2)#229 |
| 9. | Glenview | 24.4% | 4.8%(+19.5)#9 | 4.3%(+20.1)#231 |
| 10. | Marrowbone | 22.0% | 4.8%(+17.2)#10 | 4.3%(+17.7)#296 |
| 11. | Maryhill Estates | 21.5% | 4.8%(+16.7)#11 | 4.3%(+17.2)#308 |
| 12. | Knottsville | 21.1% | 4.8%(+16.3)#12 | 4.3%(+16.8)#319 |
| 13. | Seneca Gardens | 19.2% | 4.8%(+14.3)#13 | 4.3%(+14.9)#406 |
| 14. | Symsonia | 18.7% | 4.8%(+13.9)#14 | 4.3%(+14.4)#431 |
| 15. | Fairview | 18.5% | 4.8%(+13.7)#15 | 4.3%(+14.2)#448 |
| 16. | Murray Hill | 18.0% | 4.8%(+13.2)#16 | 4.3%(+13.8)#468 |
| 17. | Virgie | 17.7% | 4.8%(+12.9)#17 | 4.3%(+13.4)#482 |
| 18. | Norbourne Estates | 17.5% | 4.8%(+12.7)#18 | 4.3%(+13.2)#489 |
| 19. | Strathmoor Manor | 16.9% | 4.8%(+12.1)#19 | 4.3%(+12.6)#525 |
| 20. | Northfield | 16.4% | 4.8%(+11.6)#20 | 4.3%(+12.1)#563 |
| 21. | Pryorsburg | 16.3% | 4.8%(+11.4)#21 | 4.3%(+12.0)#580 |
| 22. | Manitou | 16.2% | 4.8%(+11.4)#22 | 4.3%(+11.9)#587 |
| 23. | Raceland | 15.4% | 4.8%(+10.6)#23 | 4.3%(+11.1)#644 |
| 24. | Rosine | 15.1% | 4.8%(+10.3)#24 | 4.3%(+10.8)#678 |
| 25. | Whitesburg | 14.9% | 4.8%(+10.1)#25 | 4.3%(+10.6)#699 |
| 26. | Thornhill | 14.9% | 4.8%(+10.1)#26 | 4.3%(+10.6)#700 |
| 27. | Farmington | 14.9% | 4.8%(+10.1)#27 | 4.3%(+10.6)#701 |
| 28. | Belfry | 14.7% | 4.8%(+9.83)#28 | 4.3%(+10.4)#727 |
| 29. | South Williamson | 14.4% | 4.8%(+9.59)#29 | 4.3%(+10.1)#761 |
| 30. | Rabbit Hash | 14.1% | 4.8%(+9.28)#30 | 4.3%(+9.83)#801 |
| 31. | Hodgenville | 13.7% | 4.8%(+8.87)#31 | 4.3%(+9.43)#858 |
| 32. | Strathmoor Village | 13.3% | 4.8%(+8.49)#32 | 4.3%(+9.05)#924 |
| 33. | Audubon Park | 13.3% | 4.8%(+8.44)#33 | 4.3%(+9.00)#934 |
| 34. | St Mary | 13.2% | 4.8%(+8.32)#34 | 4.3%(+8.87)#947 |
| 35. | Anchorage | 12.8% | 4.8%(+7.95)#35 | 4.3%(+8.50)#1,020 |
| 36. | Greenville | 12.4% | 4.8%(+7.54)#36 | 4.3%(+8.10)#1,105 |
| 37. | Bellewood | 12.2% | 4.8%(+7.35)#37 | 4.3%(+7.91)#1,137 |
| 38. | Norwood | 12.2% | 4.8%(+7.34)#38 | 4.3%(+7.90)#1,144 |
| 39. | Prospect | 11.8% | 4.8%(+6.97)#39 | 4.3%(+7.53)#1,235 |
| 40. | Kingsley | 11.8% | 4.8%(+6.92)#40 | 4.3%(+7.48)#1,244 |
| 41. | Cambridge | 11.7% | 4.8%(+6.87)#41 | 4.3%(+7.43)#1,266 |
| 42. | Windy Hills | 11.6% | 4.8%(+6.75)#42 | 4.3%(+7.30)#1,291 |
| 43. | Druid Hills | 11.6% | 4.8%(+6.72)#43 | 4.3%(+7.27)#1,300 |
| 44. | Broeck Pointe | 11.5% | 4.8%(+6.61)#44 | 4.3%(+7.16)#1,336 |
| 45. | Brownsboro Farm | 11.4% | 4.8%(+6.58)#45 | 4.3%(+7.13)#1,347 |
| 46. | Mortons Gap | 11.3% | 4.8%(+6.47)#46 | 4.3%(+7.03)#1,373 |
| 47. | Bancroft | 11.3% | 4.8%(+6.43)#47 | 4.3%(+6.98)#1,385 |
| 48. | Bellefonte | 11.2% | 4.8%(+6.38)#48 | 4.3%(+6.93)#1,399 |
| 49. | Cecilia | 11.2% | 4.8%(+6.34)#49 | 4.3%(+6.90)#1,406 |
| 50. | Spring Valley | 11.1% | 4.8%(+6.30)#50 | 4.3%(+6.85)#1,414 |
| 51. | Pikeville | 11.1% | 4.8%(+6.22)#51 | 4.3%(+6.78)#1,443 |
| 52. | Mayking | 10.9% | 4.8%(+6.03)#52 | 4.3%(+6.58)#1,492 |
| 53. | Barbourville | 10.7% | 4.8%(+5.88)#53 | 4.3%(+6.44)#1,531 |
| 54. | Brownsboro Village | 10.7% | 4.8%(+5.87)#54 | 4.3%(+6.43)#1,534 |
| 55. | Plano | 10.6% | 4.8%(+5.75)#55 | 4.3%(+6.31)#1,574 |
| 56. | St Matthews | 10.4% | 4.8%(+5.59)#56 | 4.3%(+6.14)#1,630 |
| 57. | Alexandria | 10.4% | 4.8%(+5.51)#57 | 4.3%(+6.07)#1,658 |
| 58. | Hurstbourne | 10.2% | 4.8%(+5.40)#58 | 4.3%(+5.95)#1,706 |
| 59. | Bloomfield | 10.2% | 4.8%(+5.35)#59 | 4.3%(+5.91)#1,720 |
| 60. | Jenkins | 10.2% | 4.8%(+5.32)#60 | 4.3%(+5.87)#1,732 |
| 61. | Belleview | 10.0% | 4.8%(+5.16)#61 | 4.3%(+5.71)#1,788 |
| 62. | Elkhorn City | 9.9% | 4.8%(+5.10)#62 | 4.3%(+5.65)#1,815 |
| 63. | South Shore | 9.9% | 4.8%(+5.07)#63 | 4.3%(+5.63)#1,826 |
| 64. | Elk Creek | 9.9% | 4.8%(+5.04)#64 | 4.3%(+5.60)#1,842 |
| 65. | Ten Broeck | 9.7% | 4.8%(+4.84)#65 | 4.3%(+5.39)#1,926 |
| 66. | Upton | 9.6% | 4.8%(+4.73)#66 | 4.3%(+5.28)#1,978 |
| 67. | Hills And Dales | 9.5% | 4.8%(+4.68)#67 | 4.3%(+5.24)#2,001 |
| 68. | Harlan | 9.4% | 4.8%(+4.56)#68 | 4.3%(+5.12)#2,059 |
| 69. | Old Brownsboro Place | 9.2% | 4.8%(+4.41)#69 | 4.3%(+4.96)#2,136 |
| 70. | Paintsville | 9.2% | 4.8%(+4.37)#70 | 4.3%(+4.92)#2,159 |
| 71. | Sebree | 9.2% | 4.8%(+4.34)#71 | 4.3%(+4.89)#2,174 |
| 72. | Fairfield | 9.1% | 4.8%(+4.25)#72 | 4.3%(+4.80)#2,228 |
| 73. | Graymoor Devondale | 9.1% | 4.8%(+4.24)#73 | 4.3%(+4.79)#2,248 |
| 74. | Simpsonville | 9.1% | 4.8%(+4.22)#74 | 4.3%(+4.78)#2,253 |
| 75. | Sacramento | 9.0% | 4.8%(+4.18)#75 | 4.3%(+4.74)#2,274 |
| 76. | Manor Creek | 8.9% | 4.8%(+4.08)#76 | 4.3%(+4.63)#2,335 |
| 77. | Summersville | 8.9% | 4.8%(+4.06)#77 | 4.3%(+4.62)#2,347 |
| 78. | Indian Hills | 8.9% | 4.8%(+4.04)#78 | 4.3%(+4.60)#2,365 |
| 79. | Russell | 8.8% | 4.8%(+3.99)#79 | 4.3%(+4.54)#2,394 |
| 80. | Beechmont | 8.8% | 4.8%(+3.92)#80 | 4.3%(+4.47)#2,432 |
| 81. | Sycamore | 8.7% | 4.8%(+3.91)#81 | 4.3%(+4.46)#2,443 |
| 82. | Union | 8.7% | 4.8%(+3.91)#82 | 4.3%(+4.46)#2,444 |
| 83. | Watterson Park | 8.7% | 4.8%(+3.90)#83 | 4.3%(+4.46)#2,451 |
| 84. | Wurtland | 8.7% | 4.8%(+3.87)#84 | 4.3%(+4.42)#2,473 |
| 85. | Coal Run Village | 8.7% | 4.8%(+3.83)#85 | 4.3%(+4.38)#2,506 |
| 86. | Morganfield | 8.5% | 4.8%(+3.66)#86 | 4.3%(+4.21)#2,603 |
| 87. | Irvine | 8.5% | 4.8%(+3.64)#87 | 4.3%(+4.19)#2,618 |
| 88. | Coldstream | 8.5% | 4.8%(+3.61)#88 | 4.3%(+4.17)#2,637 |
| 89. | Woodland Hills | 8.4% | 4.8%(+3.59)#89 | 4.3%(+4.14)#2,655 |
| 90. | Douglass Hills | 8.4% | 4.8%(+3.53)#90 | 4.3%(+4.09)#2,688 |
| 91. | Glenview Hills | 8.2% | 4.8%(+3.40)#91 | 4.3%(+3.96)#2,773 |
| 92. | Clarkson | 8.1% | 4.8%(+3.30)#92 | 4.3%(+3.86)#2,862 |
| 93. | Madisonville | 8.1% | 4.8%(+3.21)#93 | 4.3%(+3.77)#2,932 |
| 94. | Central City | 7.9% | 4.8%(+3.09)#94 | 4.3%(+3.65)#3,036 |
| 95. | Smithland | 7.8% | 4.8%(+2.99)#95 | 4.3%(+3.54)#3,126 |
| 96. | Richlawn | 7.7% | 4.8%(+2.89)#96 | 4.3%(+3.44)#3,215 |
| 97. | Newport | 7.7% | 4.8%(+2.88)#97 | 4.3%(+3.44)#3,219 |
| 98. | Hanson | 7.7% | 4.8%(+2.87)#98 | 4.3%(+3.43)#3,225 |
| 99. | Liberty | 7.7% | 4.8%(+2.83)#99 | 4.3%(+3.38)#3,281 |
| 100. | Jamestown | 7.6% | 4.8%(+2.80)#100 | 4.3%(+3.35)#3,318 |
Common Questions
What are the Top 10 Cities with the Highest Percentage of Population Employed in Health Technologists in Kentucky?
Top 10 Cities with the Highest Percentage of Population Employed in Health Technologists in Kentucky are:
#1
57.4%
#2
32.4%
#3
31.9%
#4
30.4%
#5
28.3%
#6
27.6%
#7
25.7%
#8
24.5%
#9
24.4%
#10
22.0%
What city has the Highest Percentage of Population Employed in Health Technologists in Kentucky?
McRoberts has the Highest Percentage of Population Employed in Health Technologists in Kentucky with 57.4%.
What is the Percentage of Population Employed in Health Technologists in the State of Kentucky?
Percentage of Population Employed in Health Technologists in Kentucky is 4.8%.
What is the Percentage of Population Employed in Health Technologists in the United States?
Percentage of Population Employed in Health Technologists in the United States is 4.3%.