Cities with the Highest Percentage of Population Employed in Health Technologists in Tennessee
RELATED REPORTS & OPTIONS
Health Technologists
Tennessee
Compare Cities
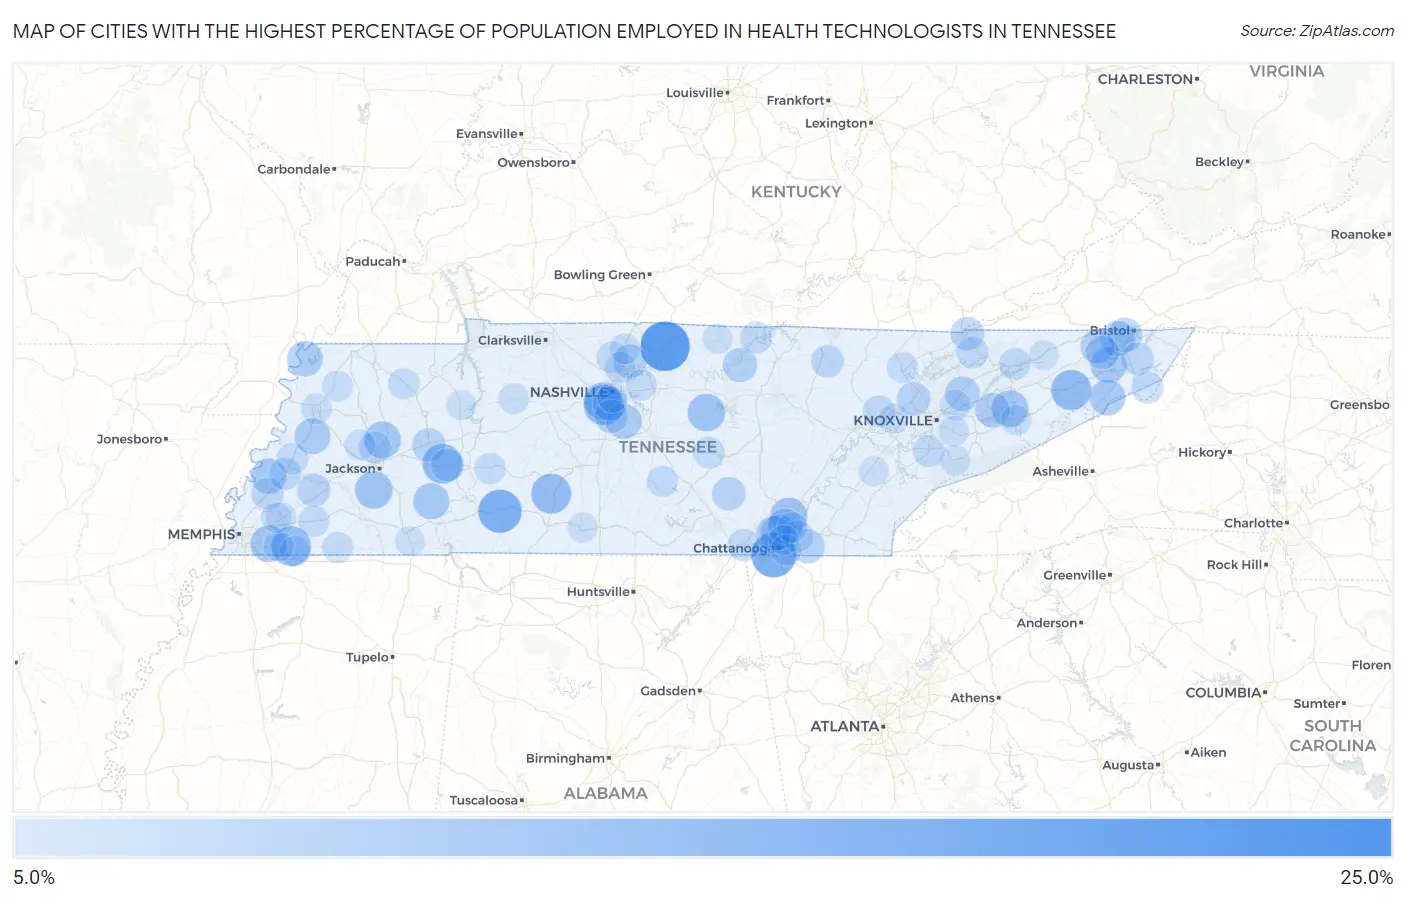
Map of Cities with the Highest Percentage of Population Employed in Health Technologists in Tennessee
0.0%
25.0%
Cities with the Highest Percentage of Population Employed in Health Technologists in Tennessee
| City | % Employed | vs State | vs National | |
| 1. | Ocoee | 24.6% | 4.5%(+20.1)#1 | 4.3%(+20.3)#225 |
| 2. | Bethpage | 22.4% | 4.5%(+17.9)#2 | 4.3%(+18.2)#285 |
| 3. | Prospect | 20.8% | 4.5%(+16.3)#3 | 4.3%(+16.5)#333 |
| 4. | Gladeville | 20.6% | 4.5%(+16.1)#4 | 4.3%(+16.3)#340 |
| 5. | Taft | 18.7% | 4.5%(+14.2)#5 | 4.3%(+14.4)#434 |
| 6. | Lookout Mountain | 18.3% | 4.5%(+13.8)#6 | 4.3%(+14.0)#458 |
| 7. | Waynesboro | 16.9% | 4.5%(+12.4)#7 | 4.3%(+12.6)#531 |
| 8. | Tusculum | 14.1% | 4.5%(+9.63)#8 | 4.3%(+9.84)#798 |
| 9. | Forest Hills | 14.1% | 4.5%(+9.56)#9 | 4.3%(+9.78)#810 |
| 10. | Chesterfield | 13.8% | 4.5%(+9.29)#10 | 4.3%(+9.51)#839 |
| 11. | Summertown | 13.7% | 4.5%(+9.24)#11 | 4.3%(+9.45)#850 |
| 12. | Piperton | 13.7% | 4.5%(+9.22)#12 | 4.3%(+9.43)#856 |
| 13. | Lenox | 12.3% | 4.5%(+7.76)#13 | 4.3%(+7.97)#1,125 |
| 14. | Dowelltown | 11.8% | 4.5%(+7.31)#14 | 4.3%(+7.52)#1,238 |
| 15. | Medon | 11.8% | 4.5%(+7.27)#15 | 4.3%(+7.48)#1,247 |
| 16. | Belle Meade | 11.7% | 4.5%(+7.15)#16 | 4.3%(+7.36)#1,272 |
| 17. | Mcdonald | 11.5% | 4.5%(+7.04)#17 | 4.3%(+7.25)#1,304 |
| 18. | Mowbray Mountain | 11.5% | 4.5%(+7.00)#18 | 4.3%(+7.21)#1,319 |
| 19. | Medina | 11.4% | 4.5%(+6.87)#19 | 4.3%(+7.08)#1,359 |
| 20. | Baneberry | 11.2% | 4.5%(+6.73)#20 | 4.3%(+6.95)#1,396 |
| 21. | Germantown | 11.0% | 4.5%(+6.51)#21 | 4.3%(+6.72)#1,453 |
| 22. | Finley | 10.6% | 4.5%(+6.09)#22 | 4.3%(+6.31)#1,577 |
| 23. | Johnson City | 10.6% | 4.5%(+6.09)#23 | 4.3%(+6.30)#1,584 |
| 24. | Milledgeville | 10.6% | 4.5%(+6.08)#24 | 4.3%(+6.29)#1,587 |
| 25. | Banner Hill | 10.5% | 4.5%(+5.98)#25 | 4.3%(+6.19)#1,614 |
| 26. | Gates | 10.3% | 4.5%(+5.81)#26 | 4.3%(+6.03)#1,674 |
| 27. | Tiptonville | 10.1% | 4.5%(+5.65)#27 | 4.3%(+5.86)#1,735 |
| 28. | Walden | 10.1% | 4.5%(+5.65)#28 | 4.3%(+5.86)#1,736 |
| 29. | Nolensville | 10.1% | 4.5%(+5.57)#29 | 4.3%(+5.78)#1,756 |
| 30. | Signal Mountain | 10.0% | 4.5%(+5.51)#30 | 4.3%(+5.72)#1,776 |
| 31. | Burlison | 10.0% | 4.5%(+5.50)#31 | 4.3%(+5.71)#1,786 |
| 32. | Hilham | 10.0% | 4.5%(+5.50)#32 | 4.3%(+5.71)#1,787 |
| 33. | Falling Water | 9.9% | 4.5%(+5.36)#33 | 4.3%(+5.57)#1,851 |
| 34. | Blountville | 9.6% | 4.5%(+5.06)#34 | 4.3%(+5.28)#1,983 |
| 35. | Dandridge | 9.4% | 4.5%(+4.93)#35 | 4.3%(+5.14)#2,049 |
| 36. | Blaine | 9.3% | 4.5%(+4.85)#36 | 4.3%(+5.06)#2,086 |
| 37. | Walnut Hill | 9.2% | 4.5%(+4.70)#37 | 4.3%(+4.92)#2,164 |
| 38. | Collegedale | 9.2% | 4.5%(+4.69)#38 | 4.3%(+4.91)#2,169 |
| 39. | Gainesboro | 9.1% | 4.5%(+4.64)#39 | 4.3%(+4.86)#2,185 |
| 40. | Colonial Heights | 9.0% | 4.5%(+4.53)#40 | 4.3%(+4.75)#2,267 |
| 41. | Oak Hill | 9.0% | 4.5%(+4.51)#41 | 4.3%(+4.72)#2,283 |
| 42. | Shackle Island | 8.6% | 4.5%(+4.10)#42 | 4.3%(+4.31)#2,536 |
| 43. | Parker S Crossroads | 8.6% | 4.5%(+4.06)#43 | 4.3%(+4.27)#2,561 |
| 44. | Harrogate | 8.5% | 4.5%(+4.05)#44 | 4.3%(+4.26)#2,566 |
| 45. | Spurgeon | 8.5% | 4.5%(+4.04)#45 | 4.3%(+4.25)#2,569 |
| 46. | Altamont | 8.5% | 4.5%(+3.99)#46 | 4.3%(+4.20)#2,611 |
| 47. | Brentwood | 8.5% | 4.5%(+3.95)#47 | 4.3%(+4.17)#2,638 |
| 48. | Clinton | 8.4% | 4.5%(+3.95)#48 | 4.3%(+4.16)#2,646 |
| 49. | Huron | 8.3% | 4.5%(+3.83)#49 | 4.3%(+4.05)#2,722 |
| 50. | Stanton | 8.2% | 4.5%(+3.65)#50 | 4.3%(+3.86)#2,858 |
| 51. | Darden | 8.0% | 4.5%(+3.50)#51 | 4.3%(+3.71)#2,976 |
| 52. | Hunter | 7.8% | 4.5%(+3.32)#52 | 4.3%(+3.54)#3,131 |
| 53. | Allardt | 7.5% | 4.5%(+2.97)#53 | 4.3%(+3.18)#3,469 |
| 54. | Atoka | 7.3% | 4.5%(+2.85)#54 | 4.3%(+3.06)#3,580 |
| 55. | Jasper | 7.3% | 4.5%(+2.78)#55 | 4.3%(+2.99)#3,641 |
| 56. | Roan Mountain | 7.2% | 4.5%(+2.75)#56 | 4.3%(+2.96)#3,671 |
| 57. | Celina | 7.2% | 4.5%(+2.70)#57 | 4.3%(+2.91)#3,728 |
| 58. | Three Way | 7.2% | 4.5%(+2.70)#58 | 4.3%(+2.91)#3,729 |
| 59. | Karns | 7.1% | 4.5%(+2.63)#59 | 4.3%(+2.84)#3,825 |
| 60. | Covington | 7.1% | 4.5%(+2.58)#60 | 4.3%(+2.79)#3,877 |
| 61. | Coalfield | 7.1% | 4.5%(+2.55)#61 | 4.3%(+2.76)#3,913 |
| 62. | Maryville | 7.0% | 4.5%(+2.52)#62 | 4.3%(+2.73)#3,947 |
| 63. | New Tazewell | 7.0% | 4.5%(+2.45)#63 | 4.3%(+2.67)#4,027 |
| 64. | Henning | 6.9% | 4.5%(+2.44)#64 | 4.3%(+2.66)#4,034 |
| 65. | Ridgetop | 6.9% | 4.5%(+2.40)#65 | 4.3%(+2.62)#4,077 |
| 66. | Harrison | 6.9% | 4.5%(+2.35)#66 | 4.3%(+2.56)#4,142 |
| 67. | Centertown | 6.7% | 4.5%(+2.22)#67 | 4.3%(+2.43)#4,317 |
| 68. | Mooresburg | 6.7% | 4.5%(+2.20)#68 | 4.3%(+2.42)#4,339 |
| 69. | Linden | 6.7% | 4.5%(+2.15)#69 | 4.3%(+2.37)#4,413 |
| 70. | Somerville | 6.7% | 4.5%(+2.15)#70 | 4.3%(+2.36)#4,416 |
| 71. | Grand Junction | 6.5% | 4.5%(+2.01)#71 | 4.3%(+2.23)#4,591 |
| 72. | Gleason | 6.5% | 4.5%(+2.00)#72 | 4.3%(+2.21)#4,613 |
| 73. | Caryville | 6.5% | 4.5%(+2.00)#73 | 4.3%(+2.21)#4,618 |
| 74. | Goodlettsville | 6.5% | 4.5%(+1.97)#74 | 4.3%(+2.18)#4,654 |
| 75. | Wartrace | 6.5% | 4.5%(+1.95)#75 | 4.3%(+2.17)#4,676 |
| 76. | Mount Juliet | 6.4% | 4.5%(+1.93)#76 | 4.3%(+2.14)#4,707 |
| 77. | Trimble | 6.2% | 4.5%(+1.75)#77 | 4.3%(+1.96)#4,951 |
| 78. | Gadsden | 6.2% | 4.5%(+1.71)#78 | 4.3%(+1.92)#5,029 |
| 79. | Dyersburg | 6.1% | 4.5%(+1.65)#79 | 4.3%(+1.86)#5,128 |
| 80. | Mascot | 6.1% | 4.5%(+1.65)#80 | 4.3%(+1.86)#5,129 |
| 81. | Ridgeside | 6.1% | 4.5%(+1.62)#81 | 4.3%(+1.83)#5,196 |
| 82. | White House | 6.1% | 4.5%(+1.59)#82 | 4.3%(+1.81)#5,229 |
| 83. | Mcewen | 6.1% | 4.5%(+1.58)#83 | 4.3%(+1.79)#5,247 |
| 84. | Rossville | 6.0% | 4.5%(+1.52)#84 | 4.3%(+1.73)#5,351 |
| 85. | Seymour | 6.0% | 4.5%(+1.46)#85 | 4.3%(+1.67)#5,453 |
| 86. | Arlington | 5.9% | 4.5%(+1.42)#86 | 4.3%(+1.64)#5,499 |
| 87. | Collierville | 5.9% | 4.5%(+1.39)#87 | 4.3%(+1.60)#5,554 |
| 88. | Middle Valley | 5.9% | 4.5%(+1.36)#88 | 4.3%(+1.57)#5,613 |
| 89. | Newport | 5.8% | 4.5%(+1.29)#89 | 4.3%(+1.50)#5,731 |
| 90. | Berry Hill | 5.8% | 4.5%(+1.25)#90 | 4.3%(+1.46)#5,788 |
| 91. | Red Boiling Springs | 5.7% | 4.5%(+1.22)#91 | 4.3%(+1.44)#5,836 |
| 92. | Lakeland | 5.7% | 4.5%(+1.22)#92 | 4.3%(+1.43)#5,842 |
| 93. | Townsend | 5.7% | 4.5%(+1.21)#93 | 4.3%(+1.43)#5,849 |
| 94. | Sweetwater | 5.7% | 4.5%(+1.21)#94 | 4.3%(+1.43)#5,864 |
| 95. | Oak Ridge | 5.7% | 4.5%(+1.20)#95 | 4.3%(+1.42)#5,883 |
| 96. | Camden | 5.7% | 4.5%(+1.19)#96 | 4.3%(+1.40)#5,907 |
| 97. | Pulaski | 5.7% | 4.5%(+1.16)#97 | 4.3%(+1.38)#5,947 |
| 98. | Chattanooga | 5.7% | 4.5%(+1.15)#98 | 4.3%(+1.37)#5,970 |
| 99. | Rogersville | 5.7% | 4.5%(+1.15)#99 | 4.3%(+1.36)#5,973 |
| 100. | Eastview | 5.6% | 4.5%(+1.06)#100 | 4.3%(+1.27)#6,156 |
Common Questions
What are the Top 10 Cities with the Highest Percentage of Population Employed in Health Technologists in Tennessee?
Top 10 Cities with the Highest Percentage of Population Employed in Health Technologists in Tennessee are:
#1
22.4%
#2
18.3%
#3
16.9%
#4
14.1%
#5
14.1%
#6
13.8%
#7
13.7%
#8
13.7%
#9
11.8%
#10
11.8%
What city has the Highest Percentage of Population Employed in Health Technologists in Tennessee?
Bethpage has the Highest Percentage of Population Employed in Health Technologists in Tennessee with 22.4%.
What is the Percentage of Population Employed in Health Technologists in the State of Tennessee?
Percentage of Population Employed in Health Technologists in Tennessee is 4.5%.
What is the Percentage of Population Employed in Health Technologists in the United States?
Percentage of Population Employed in Health Technologists in the United States is 4.3%.