Cities with the Highest Percentage of Population Employed in Health Technologists in Arizona
RELATED REPORTS & OPTIONS
Health Technologists
Arizona
Compare Cities
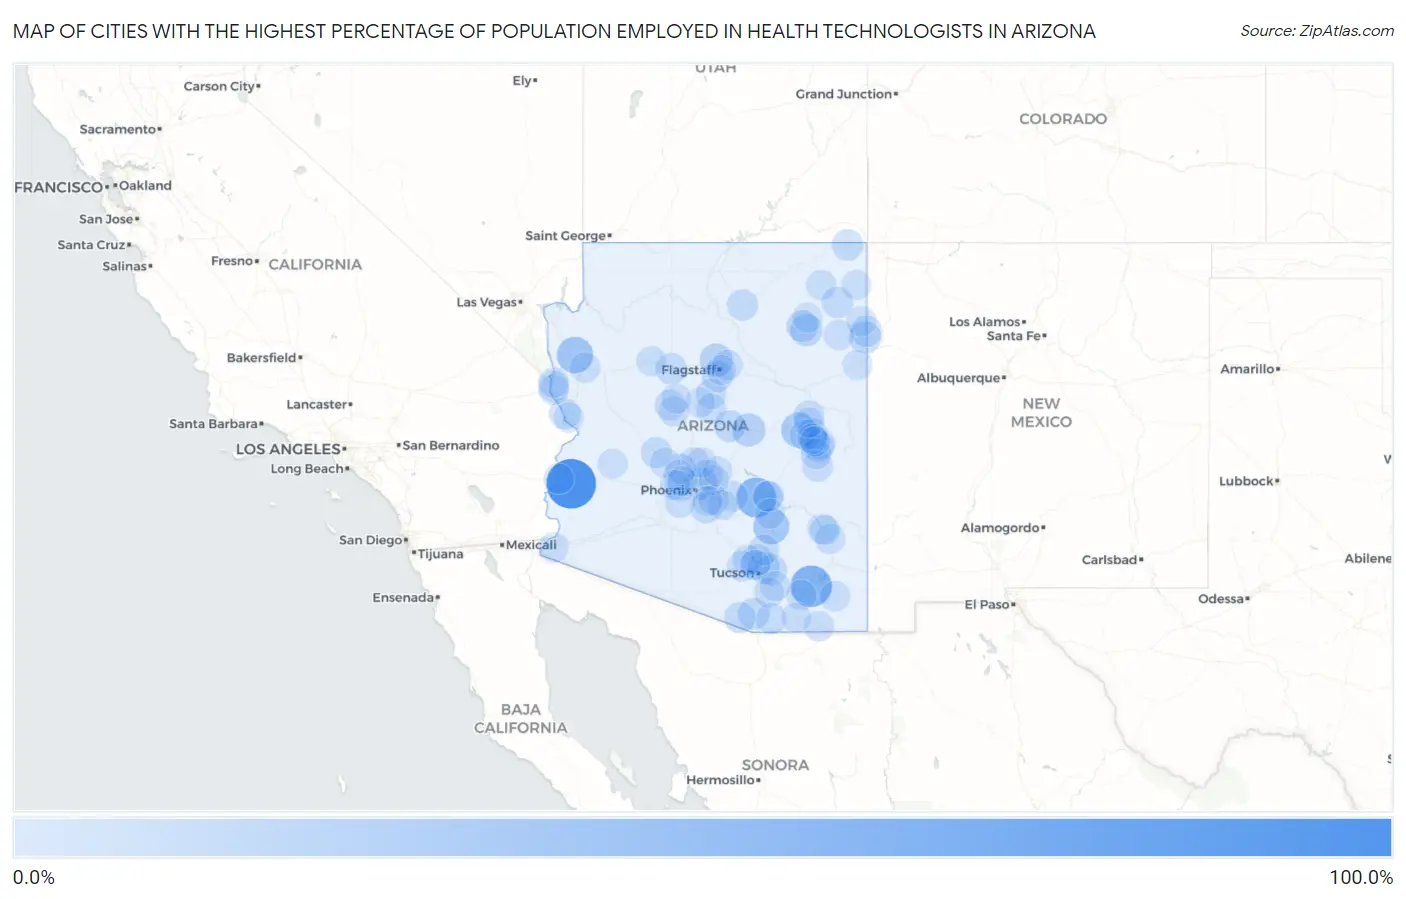
Map of Cities with the Highest Percentage of Population Employed in Health Technologists in Arizona
0.0%
100.0%
Cities with the Highest Percentage of Population Employed in Health Technologists in Arizona
| City | % Employed | vs State | vs National | |
| 1. | La Paz Valley | 100.0% | 4.0%(+96.0)#1 | 4.3%(+95.7)#1 |
| 2. | Dragoon | 59.0% | 4.0%(+55.1)#2 | 4.3%(+54.8)#23 |
| 3. | Top Of The World | 51.4% | 4.0%(+47.4)#3 | 4.3%(+47.1)#36 |
| 4. | Chloride | 33.9% | 4.0%(+29.9)#4 | 4.3%(+29.6)#110 |
| 5. | Dudleyville | 31.9% | 4.0%(+27.9)#5 | 4.3%(+27.6)#135 |
| 6. | Pinedale | 28.4% | 4.0%(+24.4)#6 | 4.3%(+24.1)#174 |
| 7. | Tonto Village | 19.0% | 4.0%(+15.1)#7 | 4.3%(+14.8)#412 |
| 8. | Fort Valley | 18.6% | 4.0%(+14.6)#8 | 4.3%(+14.3)#438 |
| 9. | Greenehaven | 16.2% | 4.0%(+12.2)#9 | 4.3%(+11.9)#584 |
| 10. | Jeddito | 15.0% | 4.0%(+11.0)#10 | 4.3%(+10.7)#689 |
| 11. | Paradise Valley | 13.7% | 4.0%(+9.74)#11 | 4.3%(+9.44)#851 |
| 12. | St Michaels | 13.3% | 4.0%(+9.35)#12 | 4.3%(+9.05)#923 |
| 13. | Kaibab Estates West | 12.7% | 4.0%(+8.76)#13 | 4.3%(+8.45)#1,031 |
| 14. | Sunsites | 12.6% | 4.0%(+8.62)#14 | 4.3%(+8.32)#1,051 |
| 15. | Catalina Foothills | 12.1% | 4.0%(+8.10)#15 | 4.3%(+7.79)#1,170 |
| 16. | Bellemont | 11.9% | 4.0%(+7.91)#16 | 4.3%(+7.60)#1,215 |
| 17. | Pine | 11.8% | 4.0%(+7.86)#17 | 4.3%(+7.56)#1,225 |
| 18. | Keams Canyon | 11.7% | 4.0%(+7.69)#18 | 4.3%(+7.38)#1,271 |
| 19. | Tubac | 11.4% | 4.0%(+7.38)#19 | 4.3%(+7.08)#1,360 |
| 20. | Goodyear Village | 11.3% | 4.0%(+7.30)#20 | 4.3%(+6.99)#1,381 |
| 21. | Ash Fork | 11.0% | 4.0%(+7.02)#21 | 4.3%(+6.71)#1,454 |
| 22. | Tanque Verde | 11.0% | 4.0%(+7.00)#22 | 4.3%(+6.70)#1,462 |
| 23. | Red Mesa | 10.9% | 4.0%(+6.95)#23 | 4.3%(+6.64)#1,476 |
| 24. | Kachina Village | 10.3% | 4.0%(+6.36)#24 | 4.3%(+6.05)#1,666 |
| 25. | Fort Defiance | 10.2% | 4.0%(+6.19)#25 | 4.3%(+5.88)#1,727 |
| 26. | Lake Of The Woods | 10.1% | 4.0%(+6.15)#26 | 4.3%(+5.84)#1,740 |
| 27. | Chinle | 9.8% | 4.0%(+5.87)#27 | 4.3%(+5.56)#1,854 |
| 28. | Arivaca | 9.8% | 4.0%(+5.80)#28 | 4.3%(+5.49)#1,887 |
| 29. | Wickenburg | 9.6% | 4.0%(+5.63)#29 | 4.3%(+5.32)#1,958 |
| 30. | Tuba City | 9.4% | 4.0%(+5.46)#30 | 4.3%(+5.15)#2,043 |
| 31. | Oro Valley | 9.0% | 4.0%(+5.03)#31 | 4.3%(+4.72)#2,281 |
| 32. | Desert Hills | 8.7% | 4.0%(+4.75)#32 | 4.3%(+4.44)#2,464 |
| 33. | Snowflake | 8.7% | 4.0%(+4.70)#33 | 4.3%(+4.40)#2,493 |
| 34. | Tucson Mountains | 8.4% | 4.0%(+4.43)#34 | 4.3%(+4.13)#2,667 |
| 35. | Patagonia | 8.2% | 4.0%(+4.25)#35 | 4.3%(+3.94)#2,783 |
| 36. | Hondah | 8.0% | 4.0%(+4.06)#36 | 4.3%(+3.76)#2,943 |
| 37. | Williamson | 8.0% | 4.0%(+4.01)#37 | 4.3%(+3.71)#2,984 |
| 38. | Pinetop Country Club | 8.0% | 4.0%(+4.00)#38 | 4.3%(+3.69)#2,997 |
| 39. | Gold Canyon | 7.9% | 4.0%(+3.93)#39 | 4.3%(+3.63)#3,052 |
| 40. | East Fork | 7.8% | 4.0%(+3.80)#40 | 4.3%(+3.50)#3,165 |
| 41. | Show Low | 7.8% | 4.0%(+3.80)#41 | 4.3%(+3.50)#3,166 |
| 42. | Saddlebrooke | 7.4% | 4.0%(+3.42)#42 | 4.3%(+3.11)#3,535 |
| 43. | Timberline-Fernwood | 7.4% | 4.0%(+3.40)#43 | 4.3%(+3.09)#3,552 |
| 44. | Linden | 7.2% | 4.0%(+3.26)#44 | 4.3%(+2.96)#3,680 |
| 45. | Picture Rocks | 7.0% | 4.0%(+3.03)#45 | 4.3%(+2.73)#3,950 |
| 46. | Six Shooter Canyon | 7.0% | 4.0%(+3.00)#46 | 4.3%(+2.69)#3,993 |
| 47. | Mesquite Creek | 7.0% | 4.0%(+3.00)#47 | 4.3%(+2.69)#3,997 |
| 48. | North Fork | 6.7% | 4.0%(+2.73)#48 | 4.3%(+2.43)#4,322 |
| 49. | Scottsdale | 6.7% | 4.0%(+2.73)#49 | 4.3%(+2.42)#4,329 |
| 50. | Ganado | 6.5% | 4.0%(+2.56)#50 | 4.3%(+2.26)#4,554 |
| 51. | Anthem | 6.4% | 4.0%(+2.45)#51 | 4.3%(+2.14)#4,709 |
| 52. | Kingman | 6.3% | 4.0%(+2.31)#52 | 4.3%(+2.00)#4,897 |
| 53. | Marana | 6.2% | 4.0%(+2.26)#53 | 4.3%(+1.95)#4,983 |
| 54. | Sedona | 6.2% | 4.0%(+2.25)#54 | 4.3%(+1.94)#4,994 |
| 55. | Icehouse Canyon | 5.9% | 4.0%(+1.90)#55 | 4.3%(+1.60)#5,564 |
| 56. | Doney Park | 5.8% | 4.0%(+1.84)#56 | 4.3%(+1.53)#5,678 |
| 57. | Gilbert | 5.7% | 4.0%(+1.71)#57 | 4.3%(+1.41)#5,897 |
| 58. | Casas Adobes | 5.7% | 4.0%(+1.71)#58 | 4.3%(+1.41)#5,901 |
| 59. | St David | 5.5% | 4.0%(+1.48)#59 | 4.3%(+1.18)#6,340 |
| 60. | Prescott | 5.3% | 4.0%(+1.36)#60 | 4.3%(+1.05)#6,602 |
| 61. | Lake Montezuma | 5.3% | 4.0%(+1.28)#61 | 4.3%(+0.977)#6,757 |
| 62. | Sunizona | 5.3% | 4.0%(+1.28)#62 | 4.3%(+0.977)#6,773 |
| 63. | Bisbee | 5.2% | 4.0%(+1.26)#63 | 4.3%(+0.952)#6,831 |
| 64. | Ehrenberg | 5.2% | 4.0%(+1.25)#64 | 4.3%(+0.950)#6,836 |
| 65. | Cave Creek | 5.2% | 4.0%(+1.25)#65 | 4.3%(+0.946)#6,842 |
| 66. | Wagon Wheel | 5.2% | 4.0%(+1.23)#66 | 4.3%(+0.929)#6,887 |
| 67. | Pima | 5.2% | 4.0%(+1.23)#67 | 4.3%(+0.921)#6,902 |
| 68. | Swift Trail Junction | 5.2% | 4.0%(+1.20)#68 | 4.3%(+0.897)#6,960 |
| 69. | Litchfield Park | 5.2% | 4.0%(+1.18)#69 | 4.3%(+0.878)#6,991 |
| 70. | Seligman | 5.1% | 4.0%(+1.16)#70 | 4.3%(+0.857)#7,029 |
| 71. | Goodyear | 5.1% | 4.0%(+1.16)#71 | 4.3%(+0.852)#7,043 |
| 72. | Peoria | 5.1% | 4.0%(+1.10)#72 | 4.3%(+0.799)#7,171 |
| 73. | Rough Rock | 5.1% | 4.0%(+1.09)#73 | 4.3%(+0.787)#7,208 |
| 74. | Lukachukai | 5.0% | 4.0%(+1.05)#74 | 4.3%(+0.742)#7,318 |
| 75. | Sun City West | 5.0% | 4.0%(+0.971)#75 | 4.3%(+0.666)#7,456 |
| 76. | Morristown | 4.9% | 4.0%(+0.957)#76 | 4.3%(+0.652)#7,483 |
| 77. | Taylor | 4.9% | 4.0%(+0.872)#77 | 4.3%(+0.566)#7,690 |
| 78. | Queen Creek | 4.8% | 4.0%(+0.864)#78 | 4.3%(+0.559)#7,708 |
| 79. | Corona De Tucson | 4.8% | 4.0%(+0.854)#79 | 4.3%(+0.549)#7,735 |
| 80. | Sierra Vista | 4.8% | 4.0%(+0.851)#80 | 4.3%(+0.546)#7,744 |
| 81. | Citrus Park | 4.8% | 4.0%(+0.805)#81 | 4.3%(+0.500)#7,870 |
| 82. | Mohave Valley | 4.8% | 4.0%(+0.803)#82 | 4.3%(+0.497)#7,873 |
| 83. | Yuma | 4.7% | 4.0%(+0.685)#83 | 4.3%(+0.380)#8,174 |
| 84. | Sawmill | 4.7% | 4.0%(+0.670)#84 | 4.3%(+0.365)#8,207 |
| 85. | Fountain Hills | 4.6% | 4.0%(+0.629)#85 | 4.3%(+0.324)#8,315 |
| 86. | Houck | 4.5% | 4.0%(+0.565)#86 | 4.3%(+0.260)#8,459 |
| 87. | Vail | 4.5% | 4.0%(+0.562)#87 | 4.3%(+0.257)#8,484 |
| 88. | Fort Mohave | 4.5% | 4.0%(+0.552)#88 | 4.3%(+0.247)#8,510 |
| 89. | Chandler | 4.5% | 4.0%(+0.544)#89 | 4.3%(+0.238)#8,535 |
| 90. | Central | 4.5% | 4.0%(+0.484)#90 | 4.3%(+0.178)#8,724 |
| 91. | Verde Village | 4.4% | 4.0%(+0.468)#91 | 4.3%(+0.163)#8,759 |
| 92. | Chino Valley | 4.4% | 4.0%(+0.459)#92 | 4.3%(+0.154)#8,794 |
| 93. | Wenden | 4.4% | 4.0%(+0.419)#93 | 4.3%(+0.114)#8,919 |
| 94. | Low Mountain | 4.4% | 4.0%(+0.405)#94 | 4.3%(+0.100)#8,957 |
| 95. | Youngtown | 4.4% | 4.0%(+0.393)#95 | 4.3%(+0.087)#8,986 |
| 96. | Dripping Springs | 4.3% | 4.0%(+0.367)#96 | 4.3%(+0.062)#9,066 |
| 97. | Pinetop Lakeside | 4.3% | 4.0%(+0.327)#97 | 4.3%(+0.022)#9,166 |
| 98. | Lake Havasu City | 4.3% | 4.0%(+0.306)#98 | 4.3%(+0.001)#9,223 |
| 99. | Flagstaff | 4.3% | 4.0%(+0.293)#99 | 4.3%(-0.012)#9,265 |
| 100. | Rio Verde | 4.2% | 4.0%(+0.259)#100 | 4.3%(-0.046)#9,362 |
Common Questions
What are the Top 10 Cities with the Highest Percentage of Population Employed in Health Technologists in Arizona?
Top 10 Cities with the Highest Percentage of Population Employed in Health Technologists in Arizona are:
#1
100.0%
#2
59.0%
#3
51.4%
#4
33.9%
#5
31.9%
#6
28.4%
#7
19.0%
#8
18.6%
#9
15.0%
#10
13.7%
What city has the Highest Percentage of Population Employed in Health Technologists in Arizona?
La Paz Valley has the Highest Percentage of Population Employed in Health Technologists in Arizona with 100.0%.
What is the Percentage of Population Employed in Health Technologists in the State of Arizona?
Percentage of Population Employed in Health Technologists in Arizona is 4.0%.
What is the Percentage of Population Employed in Health Technologists in the United States?
Percentage of Population Employed in Health Technologists in the United States is 4.3%.