Cities with the Highest Percentage of Population Employed in Health Technologists in Alabama
RELATED REPORTS & OPTIONS
Health Technologists
Alabama
Compare Cities
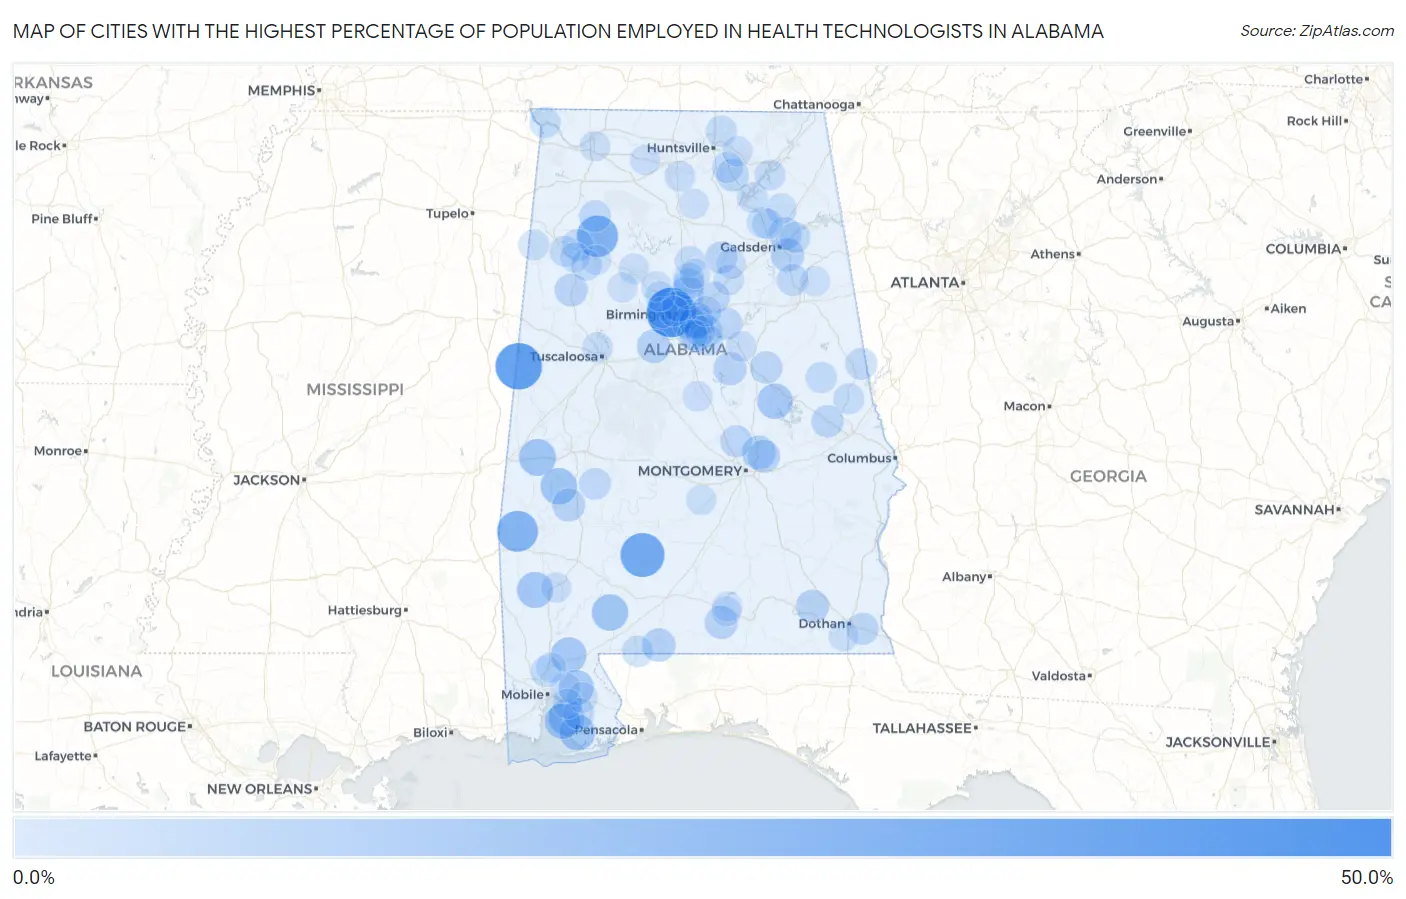
Map of Cities with the Highest Percentage of Population Employed in Health Technologists in Alabama
0.0%
50.0%
Cities with the Highest Percentage of Population Employed in Health Technologists in Alabama
| City | % Employed | vs State | vs National | |
| 1. | Edgewater | 42.1% | 4.7%(+37.4)#1 | 4.3%(+37.8)#68 |
| 2. | Memphis | 36.4% | 4.7%(+31.7)#2 | 4.3%(+32.1)#90 |
| 3. | Beatrice | 31.6% | 4.7%(+26.9)#3 | 4.3%(+27.3)#143 |
| 4. | Natural Bridge | 26.7% | 4.7%(+22.0)#4 | 4.3%(+22.4)#197 |
| 5. | Toxey | 25.8% | 4.7%(+21.1)#5 | 4.3%(+21.5)#209 |
| 6. | Bellamy | 18.5% | 4.7%(+13.9)#6 | 4.3%(+14.2)#449 |
| 7. | Myrtlewood | 17.7% | 4.7%(+13.1)#7 | 4.3%(+13.5)#478 |
| 8. | Uriah | 17.6% | 4.7%(+12.9)#8 | 4.3%(+13.3)#485 |
| 9. | Hobson | 16.8% | 4.7%(+12.2)#9 | 4.3%(+12.6)#534 |
| 10. | Fairhope | 16.6% | 4.7%(+11.9)#10 | 4.3%(+12.3)#555 |
| 11. | Magnolia Springs | 16.5% | 4.7%(+11.8)#11 | 4.3%(+12.2)#556 |
| 12. | Ray | 16.1% | 4.7%(+11.4)#12 | 4.3%(+11.8)#601 |
| 13. | Stockton | 16.0% | 4.7%(+11.3)#13 | 4.3%(+11.7)#606 |
| 14. | Point Clear | 15.9% | 4.7%(+11.2)#14 | 4.3%(+11.6)#613 |
| 15. | Stapleton | 15.2% | 4.7%(+10.5)#15 | 4.3%(+10.9)#671 |
| 16. | Mountain Brook | 14.4% | 4.7%(+9.78)#16 | 4.3%(+10.2)#759 |
| 17. | Blue Ridge | 13.1% | 4.7%(+8.41)#17 | 4.3%(+8.79)#960 |
| 18. | Homewood | 12.8% | 4.7%(+8.10)#18 | 4.3%(+8.47)#1,025 |
| 19. | Vestavia Hills | 12.5% | 4.7%(+7.85)#19 | 4.3%(+8.23)#1,066 |
| 20. | Lake View | 12.5% | 4.7%(+7.82)#20 | 4.3%(+8.19)#1,092 |
| 21. | Riverview | 12.2% | 4.7%(+7.58)#21 | 4.3%(+7.96)#1,130 |
| 22. | Glencoe | 12.1% | 4.7%(+7.48)#22 | 4.3%(+7.86)#1,154 |
| 23. | Talladega Springs | 12.0% | 4.7%(+7.34)#23 | 4.3%(+7.71)#1,182 |
| 24. | Fort Rucker | 11.9% | 4.7%(+7.25)#24 | 4.3%(+7.63)#1,207 |
| 25. | Gardendale | 11.9% | 4.7%(+7.22)#25 | 4.3%(+7.60)#1,218 |
| 26. | Sweet Water | 11.7% | 4.7%(+6.99)#26 | 4.3%(+7.36)#1,273 |
| 27. | Lookout Mountain | 11.6% | 4.7%(+6.95)#27 | 4.3%(+7.33)#1,280 |
| 28. | Carolina | 11.6% | 4.7%(+6.91)#28 | 4.3%(+7.28)#1,298 |
| 29. | Fayette | 11.4% | 4.7%(+6.76)#29 | 4.3%(+7.14)#1,345 |
| 30. | Redland | 11.4% | 4.7%(+6.72)#30 | 4.3%(+7.10)#1,354 |
| 31. | New Hope | 10.8% | 4.7%(+6.13)#31 | 4.3%(+6.51)#1,508 |
| 32. | Highland Lakes | 10.3% | 4.7%(+5.65)#32 | 4.3%(+6.03)#1,676 |
| 33. | Hollins | 10.3% | 4.7%(+5.63)#33 | 4.3%(+6.01)#1,680 |
| 34. | Waverly | 10.3% | 4.7%(+5.59)#34 | 4.3%(+5.97)#1,702 |
| 35. | Avon | 10.0% | 4.7%(+5.29)#35 | 4.3%(+5.66)#1,814 |
| 36. | Oneonta | 9.9% | 4.7%(+5.24)#36 | 4.3%(+5.62)#1,834 |
| 37. | Trussville | 9.8% | 4.7%(+5.18)#37 | 4.3%(+5.56)#1,855 |
| 38. | Deatsville | 9.8% | 4.7%(+5.18)#38 | 4.3%(+5.56)#1,858 |
| 39. | Sterrett | 9.8% | 4.7%(+5.12)#39 | 4.3%(+5.50)#1,880 |
| 40. | Alexandria | 9.6% | 4.7%(+4.91)#40 | 4.3%(+5.29)#1,975 |
| 41. | Rock Mills | 9.4% | 4.7%(+4.71)#41 | 4.3%(+5.09)#2,070 |
| 42. | Haleyville | 9.4% | 4.7%(+4.69)#42 | 4.3%(+5.07)#2,082 |
| 43. | Thomaston | 9.3% | 4.7%(+4.64)#43 | 4.3%(+5.02)#2,109 |
| 44. | Indian Springs Village | 8.9% | 4.7%(+4.27)#44 | 4.3%(+4.65)#2,323 |
| 45. | Brilliant | 8.9% | 4.7%(+4.20)#45 | 4.3%(+4.58)#2,373 |
| 46. | Kimberly | 8.7% | 4.7%(+4.07)#46 | 4.3%(+4.45)#2,459 |
| 47. | Silverhill | 8.6% | 4.7%(+3.95)#47 | 4.3%(+4.33)#2,529 |
| 48. | Flomaton | 8.6% | 4.7%(+3.94)#48 | 4.3%(+4.32)#2,533 |
| 49. | Daviston | 8.5% | 4.7%(+3.85)#49 | 4.3%(+4.22)#2,595 |
| 50. | Moores Mill | 8.4% | 4.7%(+3.70)#50 | 4.3%(+4.08)#2,695 |
| 51. | Boaz | 8.3% | 4.7%(+3.68)#51 | 4.3%(+4.06)#2,703 |
| 52. | Guin | 8.3% | 4.7%(+3.59)#52 | 4.3%(+3.97)#2,764 |
| 53. | Glen Allen | 8.2% | 4.7%(+3.53)#53 | 4.3%(+3.91)#2,807 |
| 54. | Coats Bend | 8.1% | 4.7%(+3.47)#54 | 4.3%(+3.85)#2,871 |
| 55. | Owens Cross Roads | 8.1% | 4.7%(+3.47)#55 | 4.3%(+3.85)#2,873 |
| 56. | Chelsea | 8.1% | 4.7%(+3.46)#56 | 4.3%(+3.84)#2,883 |
| 57. | Satsuma | 8.1% | 4.7%(+3.42)#57 | 4.3%(+3.80)#2,908 |
| 58. | La Fayette | 8.1% | 4.7%(+3.41)#58 | 4.3%(+3.79)#2,920 |
| 59. | Waterloo | 8.0% | 4.7%(+3.34)#59 | 4.3%(+3.71)#2,981 |
| 60. | Morris | 8.0% | 4.7%(+3.30)#60 | 4.3%(+3.68)#3,001 |
| 61. | Crossville | 7.8% | 4.7%(+3.17)#61 | 4.3%(+3.54)#3,123 |
| 62. | Sylvan Springs | 7.7% | 4.7%(+3.08)#62 | 4.3%(+3.46)#3,200 |
| 63. | Priceville | 7.7% | 4.7%(+3.03)#63 | 4.3%(+3.41)#3,238 |
| 64. | Sardis City | 7.7% | 4.7%(+3.02)#64 | 4.3%(+3.40)#3,267 |
| 65. | Guntersville | 7.7% | 4.7%(+3.00)#65 | 4.3%(+3.38)#3,286 |
| 66. | Loxley | 7.7% | 4.7%(+3.00)#66 | 4.3%(+3.38)#3,289 |
| 67. | Detroit | 7.6% | 4.7%(+2.95)#67 | 4.3%(+3.32)#3,335 |
| 68. | Langston | 7.5% | 4.7%(+2.86)#68 | 4.3%(+3.24)#3,411 |
| 69. | Northport | 7.5% | 4.7%(+2.83)#69 | 4.3%(+3.21)#3,440 |
| 70. | Hayden | 7.5% | 4.7%(+2.82)#70 | 4.3%(+3.20)#3,450 |
| 71. | Springville | 7.4% | 4.7%(+2.70)#71 | 4.3%(+3.07)#3,570 |
| 72. | Meadowbrook | 7.3% | 4.7%(+2.64)#72 | 4.3%(+3.02)#3,622 |
| 73. | Forestdale | 7.2% | 4.7%(+2.56)#73 | 4.3%(+2.93)#3,712 |
| 74. | Childersburg | 7.2% | 4.7%(+2.55)#74 | 4.3%(+2.93)#3,717 |
| 75. | Hoover | 7.1% | 4.7%(+2.48)#75 | 4.3%(+2.86)#3,812 |
| 76. | Jasper | 7.1% | 4.7%(+2.46)#76 | 4.3%(+2.84)#3,838 |
| 77. | Spanish Fort | 7.1% | 4.7%(+2.42)#77 | 4.3%(+2.79)#3,875 |
| 78. | Thorsby | 7.0% | 4.7%(+2.36)#78 | 4.3%(+2.74)#3,940 |
| 79. | Leroy | 7.0% | 4.7%(+2.33)#79 | 4.3%(+2.71)#3,969 |
| 80. | Mccalla | 7.0% | 4.7%(+2.32)#80 | 4.3%(+2.69)#3,990 |
| 81. | Minor | 7.0% | 4.7%(+2.30)#81 | 4.3%(+2.68)#4,014 |
| 82. | Hillsboro | 6.9% | 4.7%(+2.26)#82 | 4.3%(+2.64)#4,043 |
| 83. | Gurley | 6.9% | 4.7%(+2.26)#83 | 4.3%(+2.64)#4,049 |
| 84. | Muscle Shoals | 6.9% | 4.7%(+2.21)#84 | 4.3%(+2.59)#4,118 |
| 85. | Irondale | 6.9% | 4.7%(+2.19)#85 | 4.3%(+2.57)#4,137 |
| 86. | Dora | 6.8% | 4.7%(+2.18)#86 | 4.3%(+2.56)#4,152 |
| 87. | Creola | 6.8% | 4.7%(+2.14)#87 | 4.3%(+2.52)#4,206 |
| 88. | Trafford | 6.8% | 4.7%(+2.12)#88 | 4.3%(+2.49)#4,228 |
| 89. | Gordonville | 6.7% | 4.7%(+2.06)#89 | 4.3%(+2.44)#4,306 |
| 90. | Rehobeth | 6.7% | 4.7%(+2.05)#90 | 4.3%(+2.43)#4,321 |
| 91. | West Jefferson | 6.7% | 4.7%(+2.00)#91 | 4.3%(+2.38)#4,383 |
| 92. | White Plains | 6.6% | 4.7%(+1.98)#92 | 4.3%(+2.36)#4,428 |
| 93. | Highland Lake | 6.6% | 4.7%(+1.96)#93 | 4.3%(+2.34)#4,447 |
| 94. | Heath | 6.6% | 4.7%(+1.93)#94 | 4.3%(+2.31)#4,491 |
| 95. | Oakman | 6.6% | 4.7%(+1.89)#95 | 4.3%(+2.27)#4,537 |
| 96. | Daphne | 6.6% | 4.7%(+1.89)#96 | 4.3%(+2.26)#4,547 |
| 97. | Eva | 6.5% | 4.7%(+1.88)#97 | 4.3%(+2.25)#4,561 |
| 98. | Eldridge | 6.5% | 4.7%(+1.79)#98 | 4.3%(+2.17)#4,683 |
| 99. | Winfield | 6.4% | 4.7%(+1.76)#99 | 4.3%(+2.14)#4,713 |
| 100. | Andalusia | 6.4% | 4.7%(+1.76)#100 | 4.3%(+2.13)#4,714 |
Common Questions
What are the Top 10 Cities with the Highest Percentage of Population Employed in Health Technologists in Alabama?
Top 10 Cities with the Highest Percentage of Population Employed in Health Technologists in Alabama are:
#1
42.1%
#2
36.4%
#3
31.6%
#4
26.7%
#5
25.8%
#6
18.5%
#7
17.7%
#8
17.6%
#9
16.8%
#10
16.6%
What city has the Highest Percentage of Population Employed in Health Technologists in Alabama?
Edgewater has the Highest Percentage of Population Employed in Health Technologists in Alabama with 42.1%.
What is the Percentage of Population Employed in Health Technologists in the State of Alabama?
Percentage of Population Employed in Health Technologists in Alabama is 4.7%.
What is the Percentage of Population Employed in Health Technologists in the United States?
Percentage of Population Employed in Health Technologists in the United States is 4.3%.