Cities with the Highest Percentage of Population Employed in Health Technologists in Nebraska
RELATED REPORTS & OPTIONS
Health Technologists
Nebraska
Compare Cities
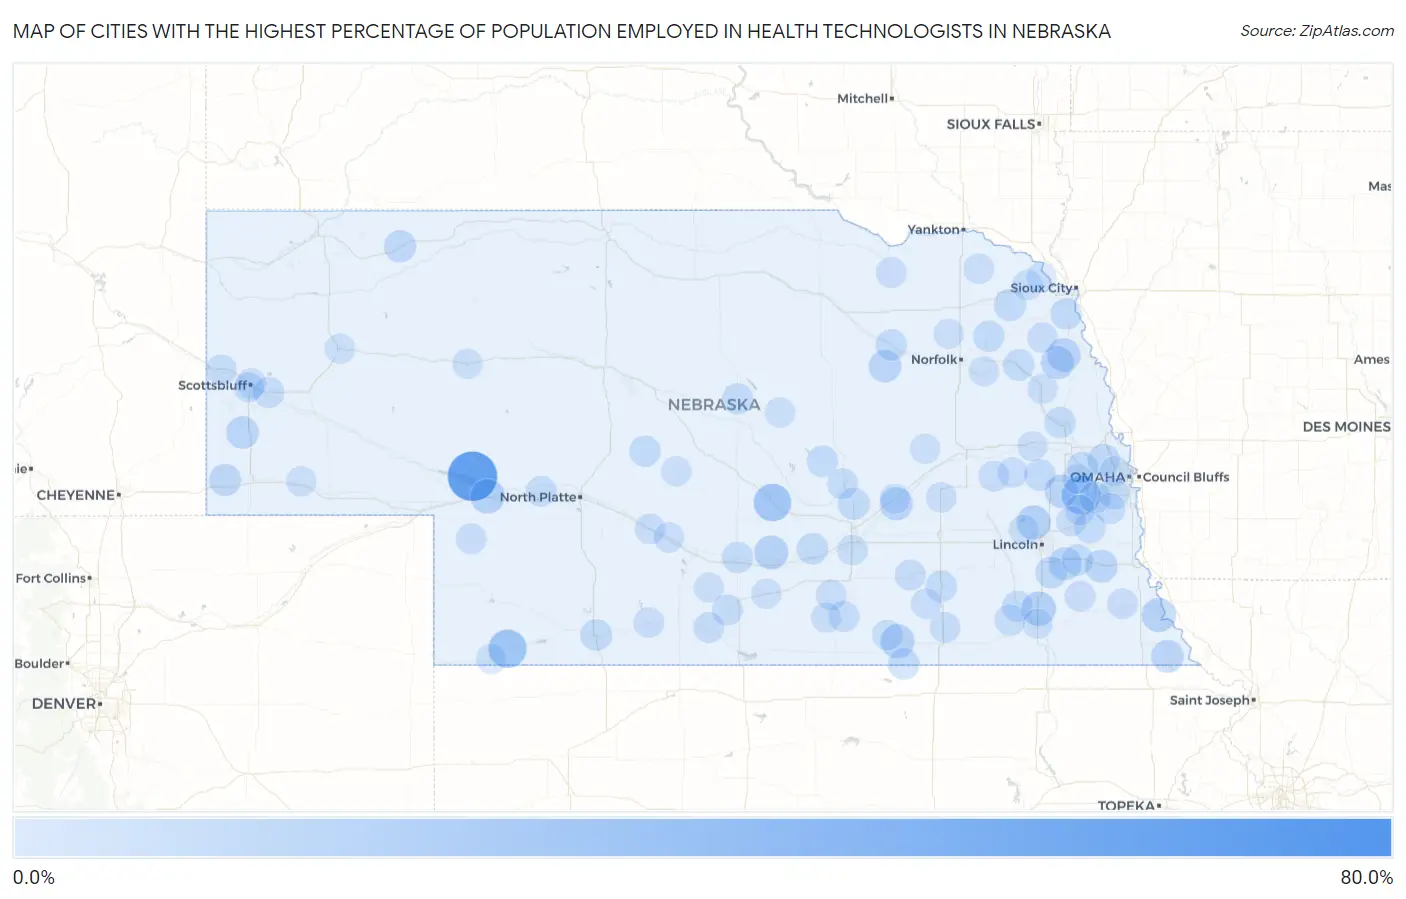
Map of Cities with the Highest Percentage of Population Employed in Health Technologists in Nebraska
0.0%
80.0%
Cities with the Highest Percentage of Population Employed in Health Technologists in Nebraska
| City | % Employed | vs State | vs National | |
| 1. | Linoma Beach | 61.5% | 4.5%(+57.0)#1 | 4.3%(+57.3)#20 |
| 2. | Martin | 50.0% | 4.5%(+45.5)#2 | 4.3%(+45.7)#43 |
| 3. | Wann | 24.5% | 4.5%(+20.0)#3 | 4.3%(+20.2)#228 |
| 4. | Max | 22.9% | 4.5%(+18.4)#4 | 4.3%(+18.6)#269 |
| 5. | Hazard | 21.4% | 4.5%(+16.9)#5 | 4.3%(+17.1)#312 |
| 6. | Roscoe | 14.3% | 4.5%(+9.75)#6 | 4.3%(+10.00)#774 |
| 7. | Pickrell | 14.1% | 4.5%(+9.60)#7 | 4.3%(+9.86)#796 |
| 8. | Raymond | 13.8% | 4.5%(+9.25)#8 | 4.3%(+9.51)#841 |
| 9. | Nemaha | 13.6% | 4.5%(+9.10)#9 | 4.3%(+9.35)#875 |
| 10. | Nora | 13.3% | 4.5%(+8.79)#10 | 4.3%(+9.05)#931 |
| 11. | Glenwood | 13.3% | 4.5%(+8.72)#11 | 4.3%(+8.98)#937 |
| 12. | Rosalie | 12.6% | 4.5%(+8.09)#12 | 4.3%(+8.35)#1,041 |
| 13. | Bancroft | 11.6% | 4.5%(+7.08)#13 | 4.3%(+7.33)#1,279 |
| 14. | Overland | 11.4% | 4.5%(+6.89)#14 | 4.3%(+7.14)#1,344 |
| 15. | Bennet | 11.3% | 4.5%(+6.80)#15 | 4.3%(+7.05)#1,364 |
| 16. | Ithaca | 11.3% | 4.5%(+6.73)#16 | 4.3%(+6.98)#1,386 |
| 17. | Syracuse | 10.5% | 4.5%(+5.96)#17 | 4.3%(+6.21)#1,609 |
| 18. | Elgin | 10.3% | 4.5%(+5.72)#18 | 4.3%(+5.97)#1,699 |
| 19. | Falls City | 10.1% | 4.5%(+5.53)#19 | 4.3%(+5.78)#1,758 |
| 20. | Harrisburg | 10.0% | 4.5%(+5.46)#20 | 4.3%(+5.71)#1,796 |
| 21. | Melia | 9.8% | 4.5%(+5.26)#21 | 4.3%(+5.52)#1,874 |
| 22. | Bushnell | 9.4% | 4.5%(+4.84)#22 | 4.3%(+5.09)#2,071 |
| 23. | Clinton | 9.4% | 4.5%(+4.84)#23 | 4.3%(+5.09)#2,072 |
| 24. | Bennington | 9.2% | 4.5%(+4.66)#24 | 4.3%(+4.91)#2,165 |
| 25. | Concord | 8.9% | 4.5%(+4.32)#25 | 4.3%(+4.57)#2,376 |
| 26. | St Libory | 8.7% | 4.5%(+4.16)#26 | 4.3%(+4.41)#2,485 |
| 27. | Hickman | 8.6% | 4.5%(+4.07)#27 | 4.3%(+4.32)#2,534 |
| 28. | Mccook | 8.0% | 4.5%(+3.51)#28 | 4.3%(+3.76)#2,935 |
| 29. | Shelton | 8.0% | 4.5%(+3.47)#29 | 4.3%(+3.73)#2,963 |
| 30. | Malmo | 7.9% | 4.5%(+3.36)#30 | 4.3%(+3.61)#3,076 |
| 31. | Valley | 7.8% | 4.5%(+3.24)#31 | 4.3%(+3.49)#3,170 |
| 32. | Cheney | 7.7% | 4.5%(+3.15)#32 | 4.3%(+3.41)#3,249 |
| 33. | Wisner | 7.6% | 4.5%(+3.07)#33 | 4.3%(+3.33)#3,332 |
| 34. | Hardy | 7.5% | 4.5%(+2.92)#34 | 4.3%(+3.18)#3,476 |
| 35. | Neligh | 7.5% | 4.5%(+2.92)#35 | 4.3%(+3.17)#3,479 |
| 36. | Geneva | 7.4% | 4.5%(+2.88)#36 | 4.3%(+3.13)#3,518 |
| 37. | Palmyra | 7.3% | 4.5%(+2.80)#37 | 4.3%(+3.06)#3,586 |
| 38. | Homer | 7.3% | 4.5%(+2.80)#38 | 4.3%(+3.05)#3,588 |
| 39. | Murdock | 7.3% | 4.5%(+2.78)#39 | 4.3%(+3.03)#3,616 |
| 40. | Hooper | 7.3% | 4.5%(+2.77)#40 | 4.3%(+3.03)#3,619 |
| 41. | Gretna | 7.3% | 4.5%(+2.75)#41 | 4.3%(+3.00)#3,631 |
| 42. | Elm Creek | 7.3% | 4.5%(+2.71)#42 | 4.3%(+2.97)#3,665 |
| 43. | Winside | 7.2% | 4.5%(+2.69)#43 | 4.3%(+2.95)#3,687 |
| 44. | Taylor | 7.1% | 4.5%(+2.60)#44 | 4.3%(+2.86)#3,801 |
| 45. | Cotesfield | 7.1% | 4.5%(+2.60)#45 | 4.3%(+2.86)#3,811 |
| 46. | Arnold | 7.1% | 4.5%(+2.57)#46 | 4.3%(+2.82)#3,847 |
| 47. | Papillion | 7.1% | 4.5%(+2.55)#47 | 4.3%(+2.80)#3,867 |
| 48. | Minatare | 6.9% | 4.5%(+2.39)#48 | 4.3%(+2.64)#4,053 |
| 49. | Blue Hill | 6.9% | 4.5%(+2.34)#49 | 4.3%(+2.60)#4,106 |
| 50. | Atlanta | 6.7% | 4.5%(+2.13)#50 | 4.3%(+2.38)#4,396 |
| 51. | De Witt | 6.6% | 4.5%(+2.08)#51 | 4.3%(+2.33)#4,456 |
| 52. | Plymouth | 6.5% | 4.5%(+1.91)#52 | 4.3%(+2.17)#4,678 |
| 53. | Sutton | 6.3% | 4.5%(+1.72)#53 | 4.3%(+1.97)#4,936 |
| 54. | Belvidere | 6.2% | 4.5%(+1.71)#54 | 4.3%(+1.96)#4,969 |
| 55. | Oxford | 6.2% | 4.5%(+1.63)#55 | 4.3%(+1.88)#5,088 |
| 56. | Morrill | 6.2% | 4.5%(+1.62)#56 | 4.3%(+1.87)#5,107 |
| 57. | St Paul | 6.1% | 4.5%(+1.60)#57 | 4.3%(+1.85)#5,158 |
| 58. | Sutherland | 6.1% | 4.5%(+1.59)#58 | 4.3%(+1.85)#5,166 |
| 59. | Cedar Creek | 6.1% | 4.5%(+1.54)#59 | 4.3%(+1.79)#5,252 |
| 60. | Sterling | 6.0% | 4.5%(+1.50)#60 | 4.3%(+1.75)#5,309 |
| 61. | Grant | 6.0% | 4.5%(+1.46)#61 | 4.3%(+1.72)#5,372 |
| 62. | Verdigre | 6.0% | 4.5%(+1.44)#62 | 4.3%(+1.69)#5,424 |
| 63. | Roseland | 5.9% | 4.5%(+1.34)#63 | 4.3%(+1.60)#5,568 |
| 64. | David City | 5.9% | 4.5%(+1.34)#64 | 4.3%(+1.59)#5,585 |
| 65. | Nelson | 5.8% | 4.5%(+1.23)#65 | 4.3%(+1.48)#5,761 |
| 66. | Gothenburg | 5.7% | 4.5%(+1.13)#66 | 4.3%(+1.38)#5,944 |
| 67. | Shickley | 5.6% | 4.5%(+1.10)#67 | 4.3%(+1.36)#6,001 |
| 68. | Stromsburg | 5.6% | 4.5%(+1.05)#68 | 4.3%(+1.31)#6,081 |
| 69. | Doniphan | 5.5% | 4.5%(+0.979)#69 | 4.3%(+1.23)#6,240 |
| 70. | Johnson | 5.5% | 4.5%(+0.915)#70 | 4.3%(+1.17)#6,353 |
| 71. | Thurston | 5.4% | 4.5%(+0.866)#71 | 4.3%(+1.12)#6,455 |
| 72. | Bruno | 5.4% | 4.5%(+0.866)#72 | 4.3%(+1.12)#6,456 |
| 73. | Martinsburg | 5.4% | 4.5%(+0.866)#73 | 4.3%(+1.12)#6,459 |
| 74. | Hartington | 5.4% | 4.5%(+0.851)#74 | 4.3%(+1.10)#6,492 |
| 75. | Scottsbluff | 5.4% | 4.5%(+0.844)#75 | 4.3%(+1.10)#6,506 |
| 76. | Cozad | 5.4% | 4.5%(+0.827)#76 | 4.3%(+1.08)#6,546 |
| 77. | Cambridge | 5.3% | 4.5%(+0.776)#77 | 4.3%(+1.03)#6,650 |
| 78. | Ashland | 5.2% | 4.5%(+0.672)#78 | 4.3%(+0.926)#6,892 |
| 79. | West Point | 5.2% | 4.5%(+0.615)#79 | 4.3%(+0.869)#7,010 |
| 80. | Malcolm | 5.1% | 4.5%(+0.563)#80 | 4.3%(+0.816)#7,130 |
| 81. | Benkelman | 5.1% | 4.5%(+0.560)#81 | 4.3%(+0.814)#7,140 |
| 82. | Ponca | 5.1% | 4.5%(+0.554)#82 | 4.3%(+0.808)#7,152 |
| 83. | Central City | 5.1% | 4.5%(+0.536)#83 | 4.3%(+0.789)#7,202 |
| 84. | Terrytown | 5.1% | 4.5%(+0.520)#84 | 4.3%(+0.774)#7,240 |
| 85. | Bertrand | 5.0% | 4.5%(+0.505)#85 | 4.3%(+0.759)#7,284 |
| 86. | Callaway | 5.0% | 4.5%(+0.497)#86 | 4.3%(+0.750)#7,303 |
| 87. | Omaha | 5.0% | 4.5%(+0.481)#87 | 4.3%(+0.734)#7,338 |
| 88. | Bladen | 5.0% | 4.5%(+0.461)#88 | 4.3%(+0.714)#7,362 |
| 89. | Elyria | 5.0% | 4.5%(+0.461)#89 | 4.3%(+0.714)#7,365 |
| 90. | Alliance | 5.0% | 4.5%(+0.442)#90 | 4.3%(+0.696)#7,402 |
| 91. | Pierce | 5.0% | 4.5%(+0.426)#91 | 4.3%(+0.680)#7,432 |
| 92. | Yutan | 4.9% | 4.5%(+0.372)#92 | 4.3%(+0.625)#7,545 |
| 93. | Axtell | 4.9% | 4.5%(+0.357)#93 | 4.3%(+0.611)#7,579 |
| 94. | Potter | 4.9% | 4.5%(+0.339)#94 | 4.3%(+0.592)#7,622 |
| 95. | Greenwood | 4.8% | 4.5%(+0.288)#95 | 4.3%(+0.542)#7,758 |
| 96. | Hyannis | 4.8% | 4.5%(+0.280)#96 | 4.3%(+0.533)#7,786 |
| 97. | Stanton | 4.8% | 4.5%(+0.278)#97 | 4.3%(+0.532)#7,788 |
| 98. | Genoa | 4.7% | 4.5%(+0.207)#98 | 4.3%(+0.461)#7,961 |
| 99. | Beatrice | 4.7% | 4.5%(+0.171)#99 | 4.3%(+0.424)#8,063 |
| 100. | North Bend | 4.7% | 4.5%(+0.170)#100 | 4.3%(+0.424)#8,065 |
Common Questions
What are the Top 10 Cities with the Highest Percentage of Population Employed in Health Technologists in Nebraska?
Top 10 Cities with the Highest Percentage of Population Employed in Health Technologists in Nebraska are:
What city has the Highest Percentage of Population Employed in Health Technologists in Nebraska?
Martin has the Highest Percentage of Population Employed in Health Technologists in Nebraska with 50.0%.
What is the Percentage of Population Employed in Health Technologists in the State of Nebraska?
Percentage of Population Employed in Health Technologists in Nebraska is 4.5%.
What is the Percentage of Population Employed in Health Technologists in the United States?
Percentage of Population Employed in Health Technologists in the United States is 4.3%.