Cities with the Highest Percentage of Population Employed in Health Technologists in Georgia
RELATED REPORTS & OPTIONS
Health Technologists
Georgia
Compare Cities
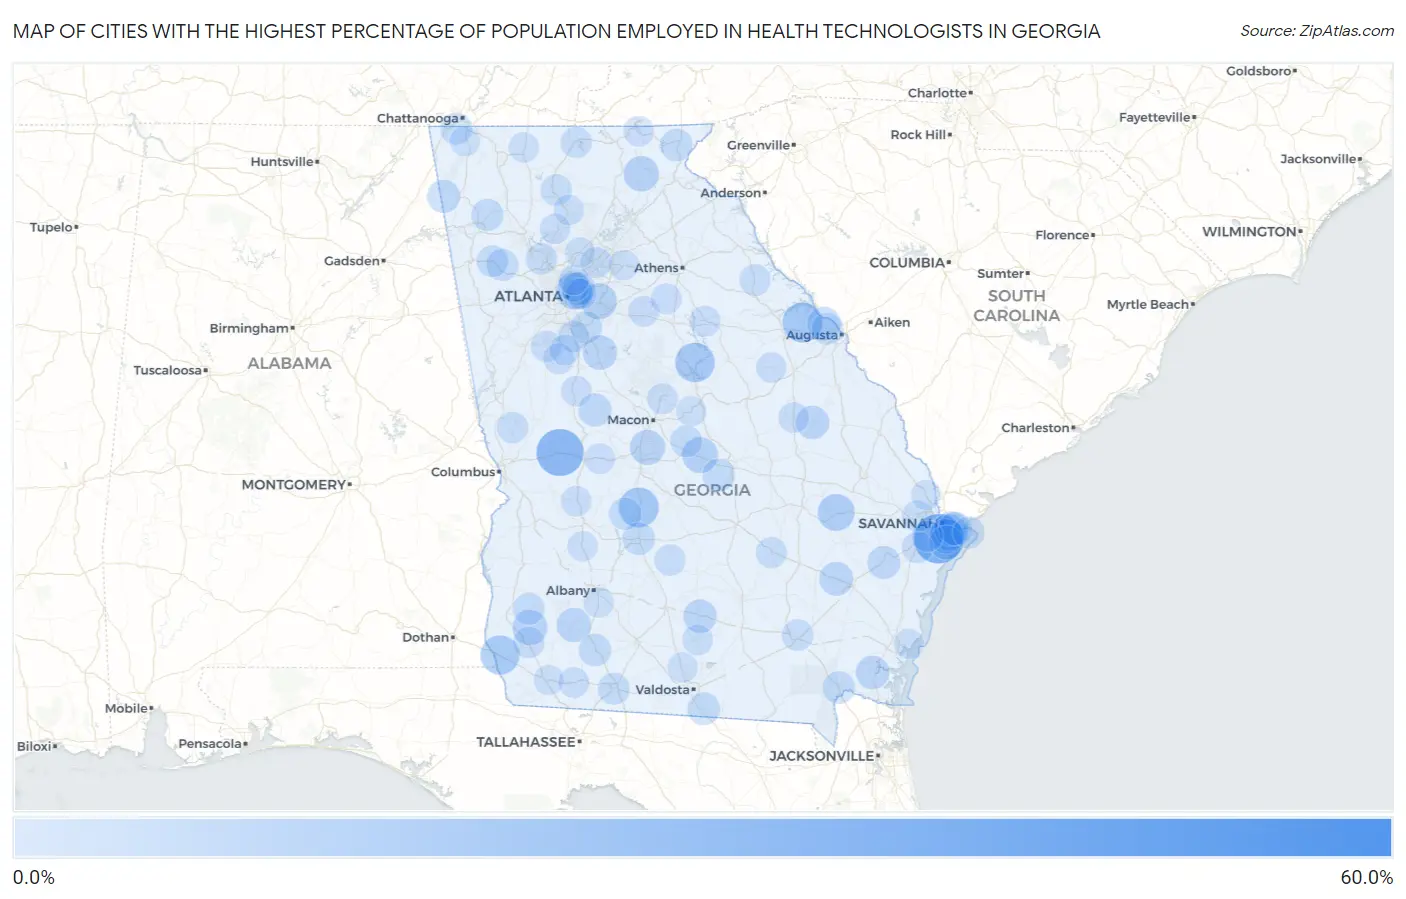
Map of Cities with the Highest Percentage of Population Employed in Health Technologists in Georgia
0.0%
60.0%
Cities with the Highest Percentage of Population Employed in Health Technologists in Georgia
| City | % Employed | vs State | vs National | |
| 1. | Hickox | 52.8% | 3.8%(+49.0)#1 | 4.3%(+48.5)#35 |
| 2. | Vernonburg | 31.9% | 3.8%(+28.1)#2 | 4.3%(+27.6)#134 |
| 3. | Junction City | 28.6% | 3.8%(+24.8)#3 | 4.3%(+24.3)#169 |
| 4. | Appling | 18.7% | 3.8%(+14.9)#4 | 4.3%(+14.4)#432 |
| 5. | Pinehurst | 18.6% | 3.8%(+14.8)#5 | 4.3%(+14.3)#445 |
| 6. | Crooked Creek | 18.0% | 3.8%(+14.2)#6 | 4.3%(+13.7)#470 |
| 7. | Jakin | 17.5% | 3.8%(+13.7)#7 | 4.3%(+13.2)#491 |
| 8. | Manassas | 14.6% | 3.8%(+10.8)#8 | 4.3%(+10.3)#744 |
| 9. | Dutch Island | 13.8% | 3.8%(+10.0)#9 | 4.3%(+9.52)#838 |
| 10. | Druid Hills | 13.5% | 3.8%(+9.67)#10 | 4.3%(+9.18)#901 |
| 11. | Lithonia | 13.4% | 3.8%(+9.61)#11 | 4.3%(+9.12)#913 |
| 12. | Allentown | 12.9% | 3.8%(+9.10)#12 | 4.3%(+8.62)#993 |
| 13. | Yonah | 12.2% | 3.8%(+8.44)#13 | 4.3%(+7.96)#1,128 |
| 14. | Centerville | 11.9% | 3.8%(+8.14)#14 | 4.3%(+7.66)#1,200 |
| 15. | Damascus | 11.9% | 3.8%(+8.08)#15 | 4.3%(+7.60)#1,216 |
| 16. | Antioch | 11.4% | 3.8%(+7.62)#16 | 4.3%(+7.13)#1,346 |
| 17. | Fairfield Plantation | 11.4% | 3.8%(+7.60)#17 | 4.3%(+7.11)#1,352 |
| 18. | Isle Of Hope | 11.3% | 3.8%(+7.46)#18 | 4.3%(+6.98)#1,384 |
| 19. | Whitemarsh Island | 11.2% | 3.8%(+7.43)#19 | 4.3%(+6.95)#1,393 |
| 20. | Locust Grove | 11.2% | 3.8%(+7.36)#20 | 4.3%(+6.88)#1,411 |
| 21. | Newton | 11.0% | 3.8%(+7.19)#21 | 4.3%(+6.70)#1,459 |
| 22. | Waverly | 10.7% | 3.8%(+6.94)#22 | 4.3%(+6.46)#1,528 |
| 23. | Skidaway Island | 10.6% | 3.8%(+6.81)#23 | 4.3%(+6.33)#1,567 |
| 24. | Odum | 10.4% | 3.8%(+6.57)#24 | 4.3%(+6.08)#1,648 |
| 25. | Evans | 10.0% | 3.8%(+6.24)#25 | 4.3%(+5.76)#1,763 |
| 26. | Woodbine | 10.0% | 3.8%(+6.20)#26 | 4.3%(+5.71)#1,779 |
| 27. | Midville | 9.9% | 3.8%(+6.09)#27 | 4.3%(+5.60)#1,840 |
| 28. | Alapaha | 9.8% | 3.8%(+6.03)#28 | 4.3%(+5.54)#1,861 |
| 29. | Talahi Island | 9.6% | 3.8%(+5.82)#29 | 4.3%(+5.34)#1,948 |
| 30. | North Decatur | 9.5% | 3.8%(+5.66)#30 | 4.3%(+5.18)#2,030 |
| 31. | Cataula | 9.4% | 3.8%(+5.64)#31 | 4.3%(+5.16)#2,040 |
| 32. | Menlo | 9.3% | 3.8%(+5.47)#32 | 4.3%(+4.99)#2,129 |
| 33. | Allenhurst | 9.1% | 3.8%(+5.33)#33 | 4.3%(+4.84)#2,197 |
| 34. | Yatesville | 9.0% | 3.8%(+5.24)#34 | 4.3%(+4.76)#2,263 |
| 35. | Dexter | 8.8% | 3.8%(+5.00)#35 | 4.3%(+4.52)#2,411 |
| 36. | Lake Park | 8.7% | 3.8%(+4.93)#36 | 4.3%(+4.45)#2,458 |
| 37. | Rock Spring | 8.6% | 3.8%(+4.81)#37 | 4.3%(+4.33)#2,530 |
| 38. | Folkston | 8.6% | 3.8%(+4.79)#38 | 4.3%(+4.31)#2,541 |
| 39. | Cordele | 8.5% | 3.8%(+4.71)#39 | 4.3%(+4.23)#2,590 |
| 40. | Tiger | 8.4% | 3.8%(+4.62)#40 | 4.3%(+4.14)#2,656 |
| 41. | Pelham | 8.4% | 3.8%(+4.60)#41 | 4.3%(+4.11)#2,675 |
| 42. | Shannon | 8.2% | 3.8%(+4.38)#42 | 4.3%(+3.90)#2,818 |
| 43. | Lilly | 8.1% | 3.8%(+4.30)#43 | 4.3%(+3.82)#2,899 |
| 44. | Braswell | 7.9% | 3.8%(+4.12)#44 | 4.3%(+3.64)#3,043 |
| 45. | Stockbridge | 7.8% | 3.8%(+4.02)#45 | 4.3%(+3.54)#3,129 |
| 46. | Martinez | 7.8% | 3.8%(+3.99)#46 | 4.3%(+3.50)#3,158 |
| 47. | Tybee Island | 7.8% | 3.8%(+3.96)#47 | 4.3%(+3.48)#3,184 |
| 48. | Jeffersonville | 7.7% | 3.8%(+3.95)#48 | 4.3%(+3.46)#3,190 |
| 49. | Thomasville | 7.7% | 3.8%(+3.95)#49 | 4.3%(+3.46)#3,192 |
| 50. | Arlington | 7.6% | 3.8%(+3.84)#50 | 4.3%(+3.35)#3,315 |
| 51. | Rockmart | 7.5% | 3.8%(+3.70)#51 | 4.3%(+3.22)#3,426 |
| 52. | Lookout Mountain | 7.5% | 3.8%(+3.65)#52 | 4.3%(+3.17)#3,484 |
| 53. | Hamilton | 7.2% | 3.8%(+3.37)#53 | 4.3%(+2.89)#3,756 |
| 54. | Bonanza | 7.2% | 3.8%(+3.35)#54 | 4.3%(+2.87)#3,774 |
| 55. | Talking Rock | 7.1% | 3.8%(+3.34)#55 | 4.3%(+2.86)#3,804 |
| 56. | Kennesaw | 7.1% | 3.8%(+3.32)#56 | 4.3%(+2.84)#3,827 |
| 57. | Bloomingdale | 7.1% | 3.8%(+3.28)#57 | 4.3%(+2.80)#3,863 |
| 58. | Tignall | 7.1% | 3.8%(+3.27)#58 | 4.3%(+2.79)#3,884 |
| 59. | Richmond Hill | 7.0% | 3.8%(+3.22)#59 | 4.3%(+2.73)#3,946 |
| 60. | Deenwood | 7.0% | 3.8%(+3.20)#60 | 4.3%(+2.72)#3,956 |
| 61. | Colquitt | 7.0% | 3.8%(+3.17)#61 | 4.3%(+2.69)#3,992 |
| 62. | Blue Ridge | 6.8% | 3.8%(+3.05)#62 | 4.3%(+2.56)#4,146 |
| 63. | Georgetown | 6.8% | 3.8%(+2.97)#63 | 4.3%(+2.49)#4,245 |
| 64. | Decatur | 6.8% | 3.8%(+2.96)#64 | 4.3%(+2.48)#4,261 |
| 65. | Rebecca | 6.8% | 3.8%(+2.95)#65 | 4.3%(+2.47)#4,266 |
| 66. | Hazlehurst | 6.7% | 3.8%(+2.94)#66 | 4.3%(+2.46)#4,278 |
| 67. | Duluth | 6.6% | 3.8%(+2.80)#67 | 4.3%(+2.32)#4,478 |
| 68. | North Druid Hills | 6.6% | 3.8%(+2.76)#68 | 4.3%(+2.28)#4,528 |
| 69. | Greensboro | 6.5% | 3.8%(+2.69)#69 | 4.3%(+2.21)#4,625 |
| 70. | Peachtree City | 6.5% | 3.8%(+2.65)#70 | 4.3%(+2.17)#4,669 |
| 71. | Bemiss | 6.4% | 3.8%(+2.58)#71 | 4.3%(+2.09)#4,766 |
| 72. | Brooks | 6.4% | 3.8%(+2.57)#72 | 4.3%(+2.09)#4,769 |
| 73. | Social Circle | 6.3% | 3.8%(+2.54)#73 | 4.3%(+2.06)#4,816 |
| 74. | Bostwick | 6.3% | 3.8%(+2.53)#74 | 4.3%(+2.04)#4,836 |
| 75. | Reynolds | 6.2% | 3.8%(+2.45)#75 | 4.3%(+1.96)#4,948 |
| 76. | Sterling | 6.2% | 3.8%(+2.42)#76 | 4.3%(+1.93)#5,014 |
| 77. | Nashville | 6.2% | 3.8%(+2.37)#77 | 4.3%(+1.89)#5,082 |
| 78. | Gray | 6.1% | 3.8%(+2.31)#78 | 4.3%(+1.82)#5,211 |
| 79. | Woolsey | 6.1% | 3.8%(+2.26)#79 | 4.3%(+1.77)#5,274 |
| 80. | Avondale Estates | 6.0% | 3.8%(+2.24)#80 | 4.3%(+1.75)#5,312 |
| 81. | Gibson | 6.0% | 3.8%(+2.22)#81 | 4.3%(+1.74)#5,336 |
| 82. | Wadley | 6.0% | 3.8%(+2.20)#82 | 4.3%(+1.72)#5,371 |
| 83. | Whigham | 6.0% | 3.8%(+2.19)#83 | 4.3%(+1.71)#5,390 |
| 84. | Ellaville | 6.0% | 3.8%(+2.16)#84 | 4.3%(+1.68)#5,441 |
| 85. | Meansville | 5.9% | 3.8%(+2.08)#85 | 4.3%(+1.60)#5,570 |
| 86. | Hiawassee | 5.8% | 3.8%(+2.02)#86 | 4.3%(+1.53)#5,670 |
| 87. | Canton | 5.8% | 3.8%(+2.01)#87 | 4.3%(+1.53)#5,693 |
| 88. | Eton | 5.8% | 3.8%(+1.99)#88 | 4.3%(+1.50)#5,727 |
| 89. | Nelson | 5.8% | 3.8%(+1.97)#89 | 4.3%(+1.49)#5,754 |
| 90. | Hahira | 5.7% | 3.8%(+1.92)#90 | 4.3%(+1.44)#5,835 |
| 91. | Smithville | 5.7% | 3.8%(+1.91)#91 | 4.3%(+1.43)#5,852 |
| 92. | Dacula | 5.7% | 3.8%(+1.90)#92 | 4.3%(+1.42)#5,891 |
| 93. | Putney | 5.7% | 3.8%(+1.86)#93 | 4.3%(+1.38)#5,946 |
| 94. | Brookhaven | 5.6% | 3.8%(+1.81)#94 | 4.3%(+1.33)#6,057 |
| 95. | Rincon | 5.5% | 3.8%(+1.74)#95 | 4.3%(+1.26)#6,192 |
| 96. | Alpharetta | 5.5% | 3.8%(+1.73)#96 | 4.3%(+1.24)#6,212 |
| 97. | Ivey | 5.5% | 3.8%(+1.72)#97 | 4.3%(+1.24)#6,221 |
| 98. | St Simons | 5.5% | 3.8%(+1.72)#98 | 4.3%(+1.24)#6,222 |
| 99. | Bainbridge | 5.5% | 3.8%(+1.66)#99 | 4.3%(+1.18)#6,337 |
| 100. | Chickamauga | 5.4% | 3.8%(+1.59)#100 | 4.3%(+1.11)#6,474 |
Common Questions
What are the Top 10 Cities with the Highest Percentage of Population Employed in Health Technologists in Georgia?
Top 10 Cities with the Highest Percentage of Population Employed in Health Technologists in Georgia are:
#1
31.9%
#2
28.6%
#3
18.7%
#4
18.6%
#5
18.0%
#6
17.5%
#7
14.6%
#8
13.8%
#9
13.5%
#10
13.4%
What city has the Highest Percentage of Population Employed in Health Technologists in Georgia?
Vernonburg has the Highest Percentage of Population Employed in Health Technologists in Georgia with 31.9%.
What is the Percentage of Population Employed in Health Technologists in the State of Georgia?
Percentage of Population Employed in Health Technologists in Georgia is 3.8%.
What is the Percentage of Population Employed in Health Technologists in the United States?
Percentage of Population Employed in Health Technologists in the United States is 4.3%.