Cities with the Highest Percentage of Population Employed in Health Technologists in Utah
RELATED REPORTS & OPTIONS
Health Technologists
Utah
Compare Cities
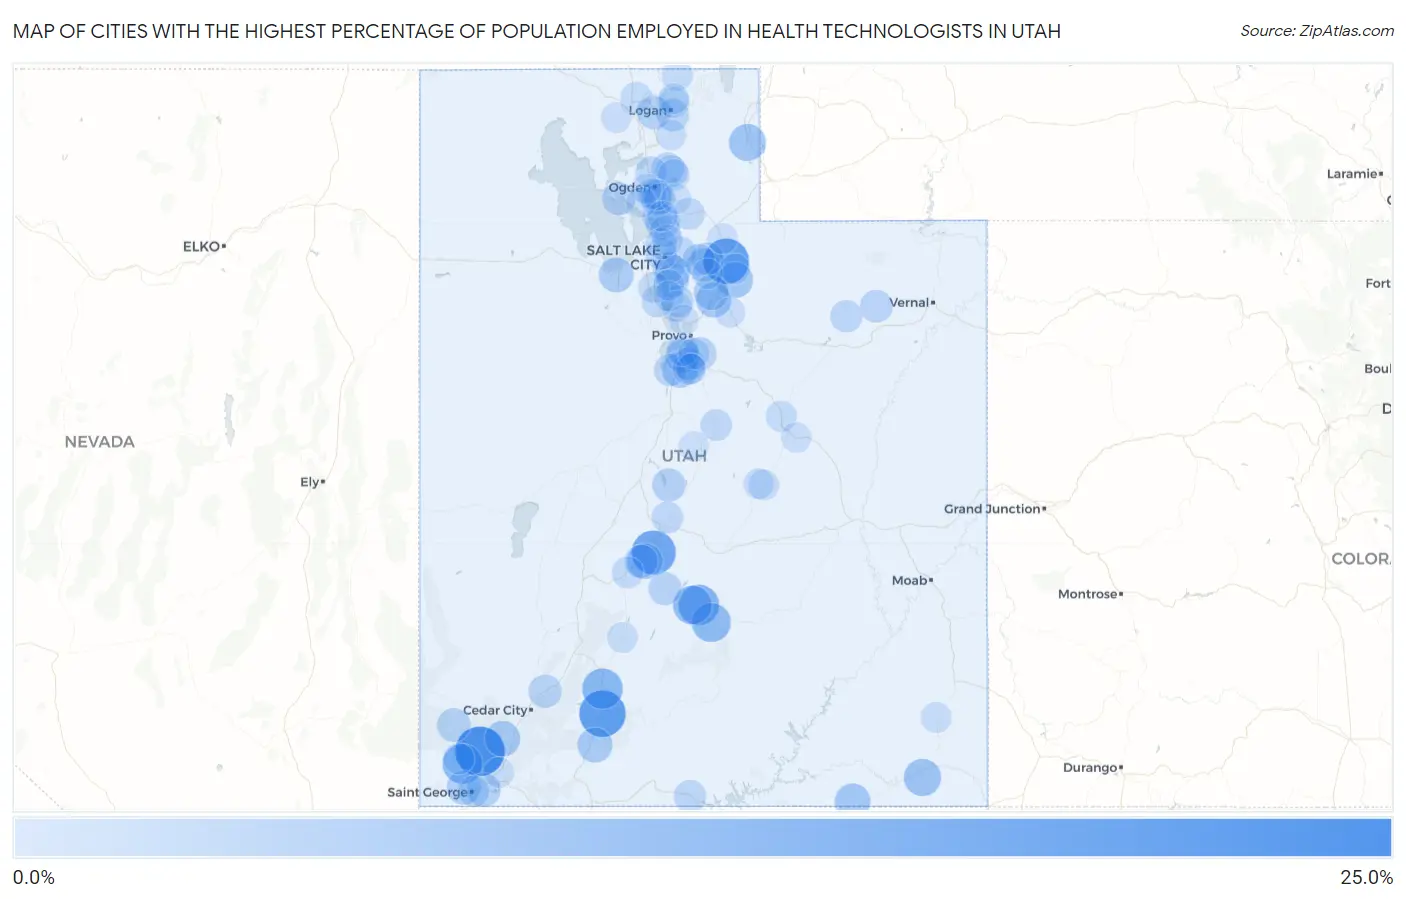
Map of Cities with the Highest Percentage of Population Employed in Health Technologists in Utah
0.0%
25.0%
Cities with the Highest Percentage of Population Employed in Health Technologists in Utah
| City | % Employed | vs State | vs National | |
| 1. | Pine Valley | 22.6% | 3.5%(+19.1)#1 | 4.3%(+18.3)#282 |
| 2. | Sundance | 21.4% | 3.5%(+17.9)#2 | 4.3%(+17.1)#313 |
| 3. | Hatch | 19.4% | 3.5%(+15.9)#3 | 4.3%(+15.2)#384 |
| 4. | Peoa | 18.6% | 3.5%(+15.1)#4 | 4.3%(+14.3)#444 |
| 5. | Glenwood | 17.2% | 3.5%(+13.7)#5 | 4.3%(+13.0)#504 |
| 6. | Lyman | 13.9% | 3.5%(+10.4)#6 | 4.3%(+9.58)#832 |
| 7. | Panguitch | 13.6% | 3.5%(+10.1)#7 | 4.3%(+9.33)#879 |
| 8. | Dammeron Valley | 13.1% | 3.5%(+9.58)#8 | 4.3%(+8.79)#961 |
| 9. | Teasdale | 12.2% | 3.5%(+8.74)#9 | 4.3%(+7.96)#1,129 |
| 10. | Loa | 12.1% | 3.5%(+8.58)#10 | 4.3%(+7.80)#1,168 |
| 11. | Tselakai Dezza | 10.5% | 3.5%(+7.03)#11 | 4.3%(+6.24)#1,600 |
| 12. | Woodruff | 10.2% | 3.5%(+6.73)#12 | 4.3%(+5.94)#1,708 |
| 13. | East Basin | 10.1% | 3.5%(+6.61)#13 | 4.3%(+5.82)#1,746 |
| 14. | Francis | 9.4% | 3.5%(+5.92)#14 | 4.3%(+5.14)#2,051 |
| 15. | Oljato Monument Valley | 9.1% | 3.5%(+5.55)#15 | 4.3%(+4.77)#2,255 |
| 16. | Annabella | 8.9% | 3.5%(+5.42)#16 | 4.3%(+4.64)#2,332 |
| 17. | Spring Lake | 8.9% | 3.5%(+5.41)#17 | 4.3%(+4.62)#2,342 |
| 18. | New Harmony | 8.9% | 3.5%(+5.40)#18 | 4.3%(+4.62)#2,348 |
| 19. | Charleston | 8.5% | 3.5%(+4.97)#19 | 4.3%(+4.18)#2,631 |
| 20. | Alton | 8.5% | 3.5%(+4.95)#20 | 4.3%(+4.16)#2,643 |
| 21. | Midway | 8.3% | 3.5%(+4.76)#21 | 4.3%(+3.98)#2,756 |
| 22. | Holladay | 8.3% | 3.5%(+4.75)#22 | 4.3%(+3.97)#2,762 |
| 23. | Stansbury Park | 8.2% | 3.5%(+4.69)#23 | 4.3%(+3.91)#2,812 |
| 24. | Farmington | 8.0% | 3.5%(+4.45)#24 | 4.3%(+3.66)#3,017 |
| 25. | Santa Clara | 7.7% | 3.5%(+4.24)#25 | 4.3%(+3.46)#3,199 |
| 26. | Benjamin | 7.5% | 3.5%(+4.02)#26 | 4.3%(+3.23)#3,415 |
| 27. | Washington | 7.3% | 3.5%(+3.82)#27 | 4.3%(+3.03)#3,607 |
| 28. | Enterprise | 7.2% | 3.5%(+3.67)#28 | 4.3%(+2.88)#3,759 |
| 29. | Mendon | 7.0% | 3.5%(+3.50)#29 | 4.3%(+2.72)#3,960 |
| 30. | Snyderville | 7.0% | 3.5%(+3.47)#30 | 4.3%(+2.68)#4,005 |
| 31. | Fayette | 6.9% | 3.5%(+3.37)#31 | 4.3%(+2.59)#4,117 |
| 32. | Cottonwood Heights | 6.8% | 3.5%(+3.27)#32 | 4.3%(+2.48)#4,252 |
| 33. | Koosharem | 6.8% | 3.5%(+3.26)#33 | 4.3%(+2.47)#4,267 |
| 34. | Hooper | 6.8% | 3.5%(+3.25)#34 | 4.3%(+2.46)#4,277 |
| 35. | Central Valley | 6.7% | 3.5%(+3.18)#35 | 4.3%(+2.40)#4,362 |
| 36. | Summit | 6.7% | 3.5%(+3.17)#36 | 4.3%(+2.38)#4,388 |
| 37. | Mapleton | 6.6% | 3.5%(+3.15)#37 | 4.3%(+2.36)#4,421 |
| 38. | Salem | 6.4% | 3.5%(+2.94)#38 | 4.3%(+2.16)#4,690 |
| 39. | Neola | 6.3% | 3.5%(+2.82)#39 | 4.3%(+2.04)#4,851 |
| 40. | Silver Summit | 6.2% | 3.5%(+2.67)#40 | 4.3%(+1.89)#5,083 |
| 41. | Providence | 6.1% | 3.5%(+2.64)#41 | 4.3%(+1.86)#5,137 |
| 42. | Liberty | 6.1% | 3.5%(+2.61)#42 | 4.3%(+1.83)#5,202 |
| 43. | Big Water | 6.0% | 3.5%(+2.52)#43 | 4.3%(+1.74)#5,337 |
| 44. | Emigration Canyon | 6.0% | 3.5%(+2.46)#44 | 4.3%(+1.67)#5,450 |
| 45. | Genola | 5.9% | 3.5%(+2.42)#45 | 4.3%(+1.64)#5,502 |
| 46. | Summit Park | 5.9% | 3.5%(+2.41)#46 | 4.3%(+1.63)#5,514 |
| 47. | Wolf Creek | 5.8% | 3.5%(+2.35)#47 | 4.3%(+1.56)#5,624 |
| 48. | Elk Ridge | 5.8% | 3.5%(+2.31)#48 | 4.3%(+1.52)#5,696 |
| 49. | Altamont | 5.7% | 3.5%(+2.23)#49 | 4.3%(+1.45)#5,826 |
| 50. | Alpine | 5.7% | 3.5%(+2.23)#50 | 4.3%(+1.44)#5,832 |
| 51. | Pleasant View | 5.6% | 3.5%(+2.10)#51 | 4.3%(+1.31)#6,072 |
| 52. | Morgan | 5.6% | 3.5%(+2.09)#52 | 4.3%(+1.30)#6,098 |
| 53. | Lake Shore | 5.6% | 3.5%(+2.08)#53 | 4.3%(+1.29)#6,107 |
| 54. | Bluffdale | 5.5% | 3.5%(+1.98)#54 | 4.3%(+1.20)#6,291 |
| 55. | Millcreek | 5.4% | 3.5%(+1.93)#55 | 4.3%(+1.14)#6,406 |
| 56. | Redmond | 5.4% | 3.5%(+1.86)#56 | 4.3%(+1.07)#6,566 |
| 57. | Salt Lake City | 5.4% | 3.5%(+1.85)#57 | 4.3%(+1.07)#6,575 |
| 58. | Fairview | 5.3% | 3.5%(+1.83)#58 | 4.3%(+1.04)#6,620 |
| 59. | Eden | 5.3% | 3.5%(+1.80)#59 | 4.3%(+1.01)#6,687 |
| 60. | Joseph | 5.2% | 3.5%(+1.74)#60 | 4.3%(+0.957)#6,824 |
| 61. | South Weber | 5.2% | 3.5%(+1.70)#61 | 4.3%(+0.919)#6,907 |
| 62. | Centerville | 5.1% | 3.5%(+1.60)#62 | 4.3%(+0.817)#7,125 |
| 63. | Washington Terrace | 5.0% | 3.5%(+1.55)#63 | 4.3%(+0.760)#7,279 |
| 64. | St George | 5.0% | 3.5%(+1.50)#64 | 4.3%(+0.719)#7,354 |
| 65. | Spanish Fork | 5.0% | 3.5%(+1.50)#65 | 4.3%(+0.712)#7,367 |
| 66. | Riverside | 5.0% | 3.5%(+1.49)#66 | 4.3%(+0.705)#7,382 |
| 67. | Veyo | 5.0% | 3.5%(+1.46)#67 | 4.3%(+0.679)#7,434 |
| 68. | Uintah | 4.9% | 3.5%(+1.44)#68 | 4.3%(+0.659)#7,470 |
| 69. | Cove | 4.8% | 3.5%(+1.32)#69 | 4.3%(+0.533)#7,781 |
| 70. | North Logan | 4.8% | 3.5%(+1.32)#70 | 4.3%(+0.530)#7,792 |
| 71. | North Salt Lake | 4.8% | 3.5%(+1.31)#71 | 4.3%(+0.525)#7,807 |
| 72. | Highland | 4.8% | 3.5%(+1.30)#72 | 4.3%(+0.519)#7,821 |
| 73. | Helper | 4.8% | 3.5%(+1.29)#73 | 4.3%(+0.509)#7,844 |
| 74. | South Jordan | 4.8% | 3.5%(+1.28)#74 | 4.3%(+0.492)#7,882 |
| 75. | Sandy | 4.7% | 3.5%(+1.23)#75 | 4.3%(+0.442)#8,015 |
| 76. | Castle Dale | 4.5% | 3.5%(+1.05)#76 | 4.3%(+0.260)#8,456 |
| 77. | Hyde Park | 4.5% | 3.5%(+0.998)#77 | 4.3%(+0.212)#8,617 |
| 78. | Kaysville | 4.5% | 3.5%(+0.966)#78 | 4.3%(+0.181)#8,716 |
| 79. | Leeds | 4.4% | 3.5%(+0.944)#79 | 4.3%(+0.158)#8,773 |
| 80. | Orangeville | 4.4% | 3.5%(+0.904)#80 | 4.3%(+0.119)#8,907 |
| 81. | Circleville | 4.4% | 3.5%(+0.902)#81 | 4.3%(+0.117)#8,913 |
| 82. | Blanding | 4.4% | 3.5%(+0.894)#82 | 4.3%(+0.109)#8,940 |
| 83. | South Ogden | 4.3% | 3.5%(+0.828)#83 | 4.3%(+0.043)#9,118 |
| 84. | Riverdale | 4.3% | 3.5%(+0.797)#84 | 4.3%(+0.011)#9,189 |
| 85. | Thatcher | 4.2% | 3.5%(+0.735)#85 | 4.3%(-0.051)#9,375 |
| 86. | Bountiful | 4.2% | 3.5%(+0.732)#86 | 4.3%(-0.054)#9,384 |
| 87. | Hoytsville | 4.2% | 3.5%(+0.719)#87 | 4.3%(-0.067)#9,418 |
| 88. | Fruit Heights | 4.2% | 3.5%(+0.715)#88 | 4.3%(-0.070)#9,431 |
| 89. | Paradise | 4.2% | 3.5%(+0.688)#89 | 4.3%(-0.097)#9,504 |
| 90. | Marion | 4.2% | 3.5%(+0.666)#90 | 4.3%(-0.119)#9,575 |
| 91. | Independence | 4.2% | 3.5%(+0.666)#91 | 4.3%(-0.119)#9,589 |
| 92. | Park City | 4.1% | 3.5%(+0.641)#92 | 4.3%(-0.145)#9,663 |
| 93. | Wellington | 4.1% | 3.5%(+0.585)#93 | 4.3%(-0.201)#9,827 |
| 94. | Draper | 4.1% | 3.5%(+0.585)#94 | 4.3%(-0.201)#9,828 |
| 95. | West Haven | 4.1% | 3.5%(+0.582)#95 | 4.3%(-0.204)#9,837 |
| 96. | Woodland Hills | 4.0% | 3.5%(+0.526)#96 | 4.3%(-0.259)#10,027 |
| 97. | West Point | 4.0% | 3.5%(+0.472)#97 | 4.3%(-0.314)#10,198 |
| 98. | Lindon | 3.9% | 3.5%(+0.441)#98 | 4.3%(-0.345)#10,286 |
| 99. | Mountain Green | 3.9% | 3.5%(+0.417)#99 | 4.3%(-0.368)#10,366 |
| 100. | Wales | 3.9% | 3.5%(+0.406)#100 | 4.3%(-0.380)#10,403 |
Common Questions
What are the Top 10 Cities with the Highest Percentage of Population Employed in Health Technologists in Utah?
Top 10 Cities with the Highest Percentage of Population Employed in Health Technologists in Utah are:
#1
22.6%
#2
19.4%
#3
18.6%
#4
17.2%
#5
13.9%
#6
13.6%
#7
13.1%
#8
12.2%
#9
12.1%
#10
10.5%
What city has the Highest Percentage of Population Employed in Health Technologists in Utah?
Pine Valley has the Highest Percentage of Population Employed in Health Technologists in Utah with 22.6%.
What is the Percentage of Population Employed in Health Technologists in the State of Utah?
Percentage of Population Employed in Health Technologists in Utah is 3.5%.
What is the Percentage of Population Employed in Health Technologists in the United States?
Percentage of Population Employed in Health Technologists in the United States is 4.3%.