Hidden Meadows, CA Map & Demographics
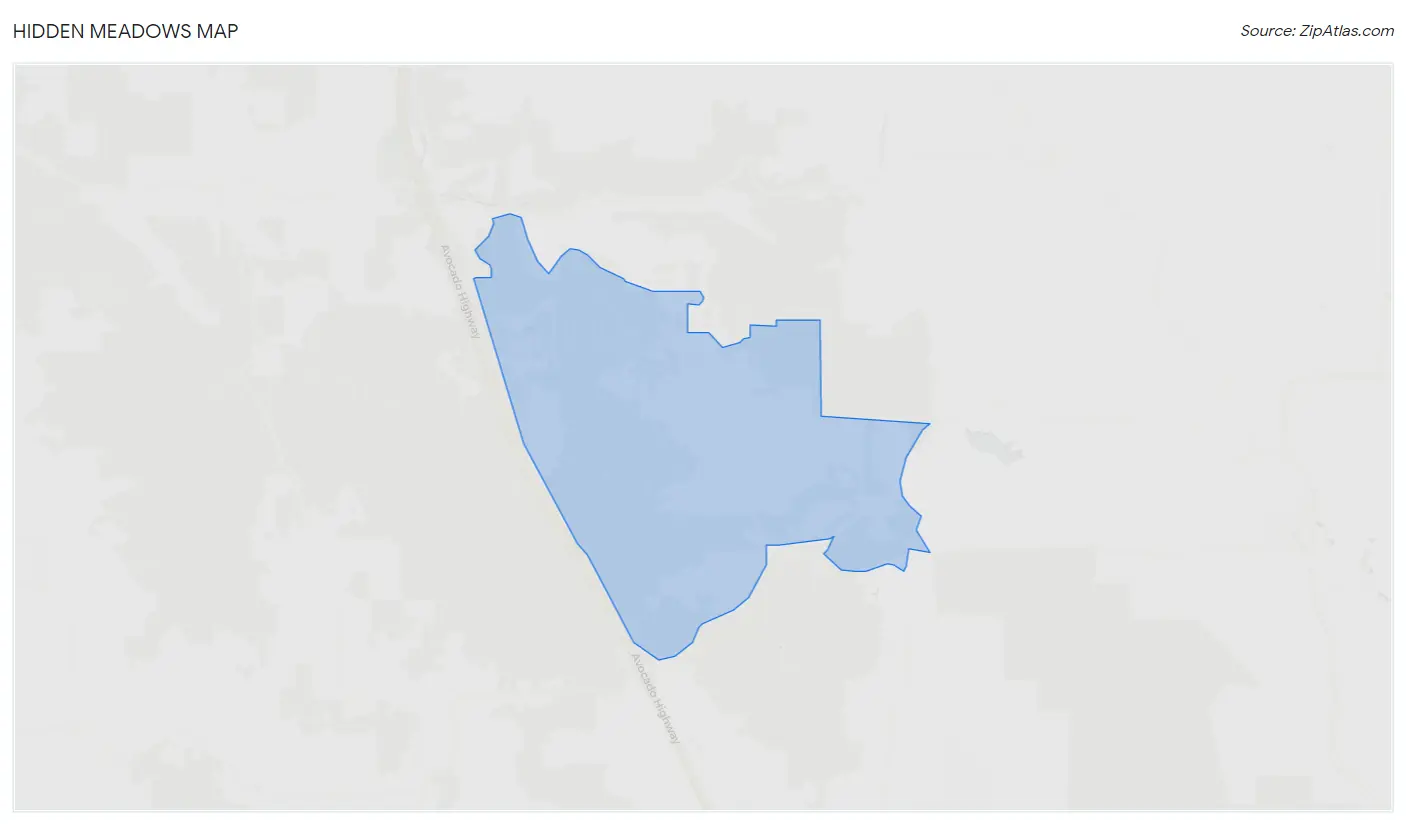
Hidden Meadows Map
Hidden Meadows Overview
$64,708
PER CAPITA INCOME
$159,023
AVG FAMILY INCOME
$134,519
AVG HOUSEHOLD INCOME
36.1%
WAGE / INCOME GAP [ % ]
63.9¢/ $1
WAGE / INCOME GAP [ $ ]
0.46
INEQUALITY / GINI INDEX
3,698
TOTAL POPULATION
1,736
MALE POPULATION
1,962
FEMALE POPULATION
88.48
MALES / 100 FEMALES
113.02
FEMALES / 100 MALES
58.5
MEDIAN AGE
2.5
AVG FAMILY SIZE
2.2
AVG HOUSEHOLD SIZE
1,775
LABOR FORCE [ PEOPLE ]
53.8%
PERCENT IN LABOR FORCE
17.2%
UNEMPLOYMENT RATE
Income in Hidden Meadows
Income Overview in Hidden Meadows
Per Capita Income in Hidden Meadows is $64,708, while median incomes of families and households are $159,023 and $134,519 respectively.
| Characteristic | Number | Measure |
| Per Capita Income | 3,698 | $64,708 |
| Median Family Income | 1,217 | $159,023 |
| Mean Family Income | 1,217 | $186,400 |
| Median Household Income | 1,679 | $134,519 |
| Mean Household Income | 1,679 | $151,835 |
| Income Deficit | 1,217 | $0 |
| Wage / Income Gap (%) | 3,698 | 36.14% |
| Wage / Income Gap ($) | 3,698 | 63.86¢ per $1 |
| Gini / Inequality Index | 3,698 | 0.46 |
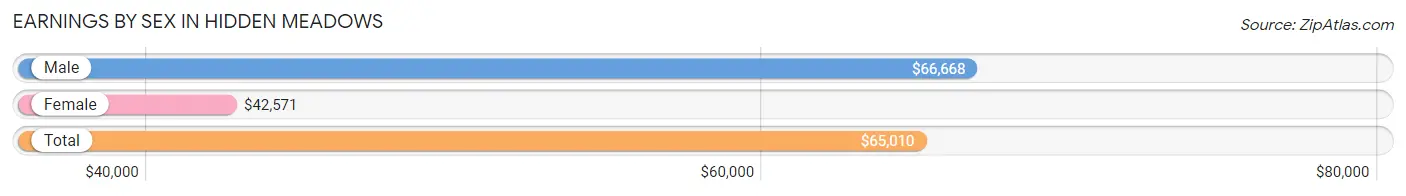
Earnings by Sex in Hidden Meadows
Average Earnings in Hidden Meadows are $65,010, $66,668 for men and $42,571 for women, a difference of 36.1%.
| Sex | Number | Average Earnings |
| Male | 1,151 (60.3%) | $66,668 |
| Female | 757 (39.7%) | $42,571 |
| Total | 1,908 (100.0%) | $65,010 |
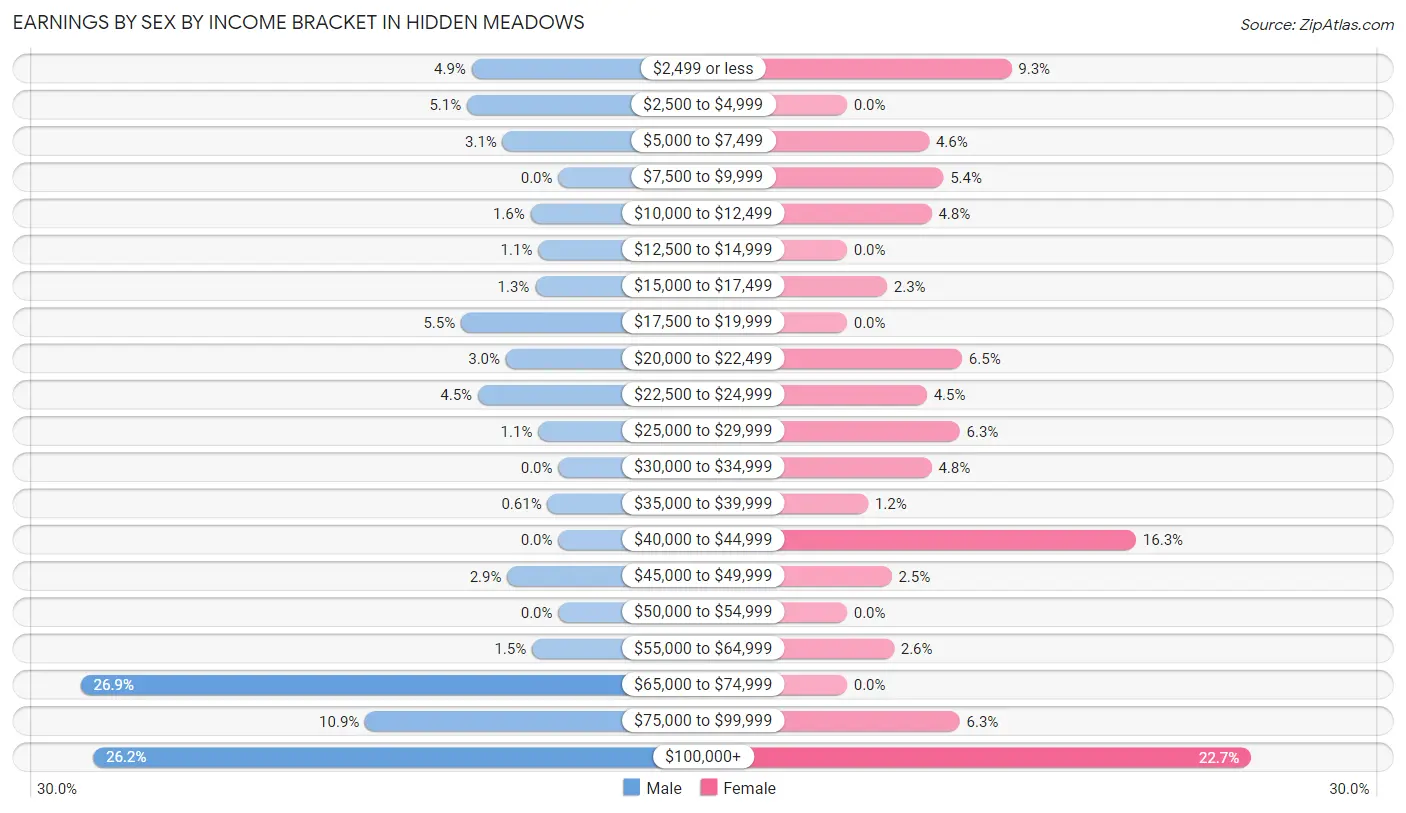
Earnings by Sex by Income Bracket in Hidden Meadows
The most common earnings brackets in Hidden Meadows are $65,000 to $74,999 for men (309 | 26.9%) and $100,000+ for women (172 | 22.7%).
| Income | Male | Female |
| $2,499 or less | 56 (4.9%) | 70 (9.2%) |
| $2,500 to $4,999 | 59 (5.1%) | 0 (0.0%) |
| $5,000 to $7,499 | 36 (3.1%) | 35 (4.6%) |
| $7,500 to $9,999 | 0 (0.0%) | 41 (5.4%) |
| $10,000 to $12,499 | 18 (1.6%) | 36 (4.8%) |
| $12,500 to $14,999 | 13 (1.1%) | 0 (0.0%) |
| $15,000 to $17,499 | 15 (1.3%) | 17 (2.2%) |
| $17,500 to $19,999 | 63 (5.5%) | 0 (0.0%) |
| $20,000 to $22,499 | 34 (2.9%) | 49 (6.5%) |
| $22,500 to $24,999 | 52 (4.5%) | 34 (4.5%) |
| $25,000 to $29,999 | 13 (1.1%) | 48 (6.3%) |
| $30,000 to $34,999 | 0 (0.0%) | 36 (4.8%) |
| $35,000 to $39,999 | 7 (0.6%) | 9 (1.2%) |
| $40,000 to $44,999 | 0 (0.0%) | 123 (16.3%) |
| $45,000 to $49,999 | 33 (2.9%) | 19 (2.5%) |
| $50,000 to $54,999 | 0 (0.0%) | 0 (0.0%) |
| $55,000 to $64,999 | 17 (1.5%) | 20 (2.6%) |
| $65,000 to $74,999 | 309 (26.9%) | 0 (0.0%) |
| $75,000 to $99,999 | 125 (10.9%) | 48 (6.3%) |
| $100,000+ | 301 (26.2%) | 172 (22.7%) |
| Total | 1,151 (100.0%) | 757 (100.0%) |
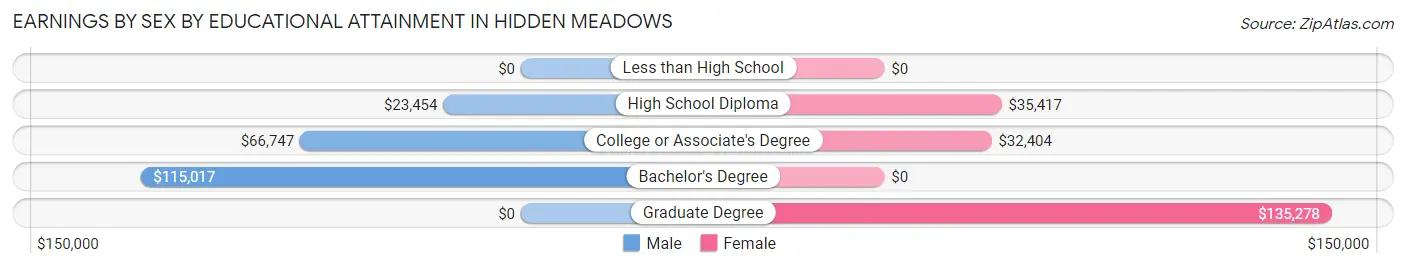
Earnings by Sex by Educational Attainment in Hidden Meadows
Average earnings in Hidden Meadows are $66,899 for men and $43,587 for women, a difference of 34.8%. Men with an educational attainment of bachelor's degree enjoy the highest average annual earnings of $115,017, while those with high school diploma education earn the least with $23,454. Women with an educational attainment of graduate degree earn the most with the average annual earnings of $135,278, while those with college or associate's degree education have the smallest earnings of $32,404.
| Educational Attainment | Male Income | Female Income |
| Less than High School | - | - |
| High School Diploma | $23,454 | $35,417 |
| College or Associate's Degree | $66,747 | $32,404 |
| Bachelor's Degree | $115,017 | $0 |
| Graduate Degree | - | - |
| Total | $66,899 | $43,587 |
Family Income in Hidden Meadows
Family Income Brackets in Hidden Meadows
According to the Hidden Meadows family income data, there are 453 families falling into the $200,000+ income range, which is the most common income bracket and makes up 37.2% of all families.
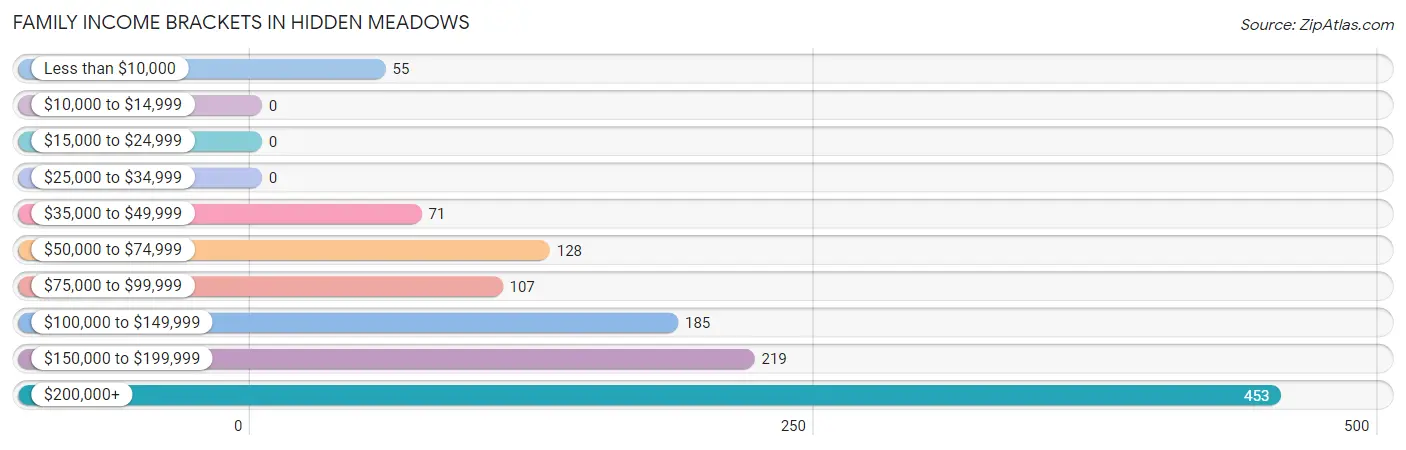
| Income Bracket | # Families | % Families |
| Less than $10,000 | 55 | 4.5% |
| $10,000 to $14,999 | 0 | 0.0% |
| $15,000 to $24,999 | 0 | 0.0% |
| $25,000 to $34,999 | 0 | 0.0% |
| $35,000 to $49,999 | 71 | 5.8% |
| $50,000 to $74,999 | 128 | 10.5% |
| $75,000 to $99,999 | 107 | 8.8% |
| $100,000 to $149,999 | 185 | 15.2% |
| $150,000 to $199,999 | 219 | 18.0% |
| $200,000+ | 453 | 37.2% |
Family Income by Famaliy Size in Hidden Meadows
2-person families (842 | 69.2%) account for the highest median family income in Hidden Meadows with $173,824 per family, while 2-person families (842 | 69.2%) have the highest median income of $86,912 per family member.
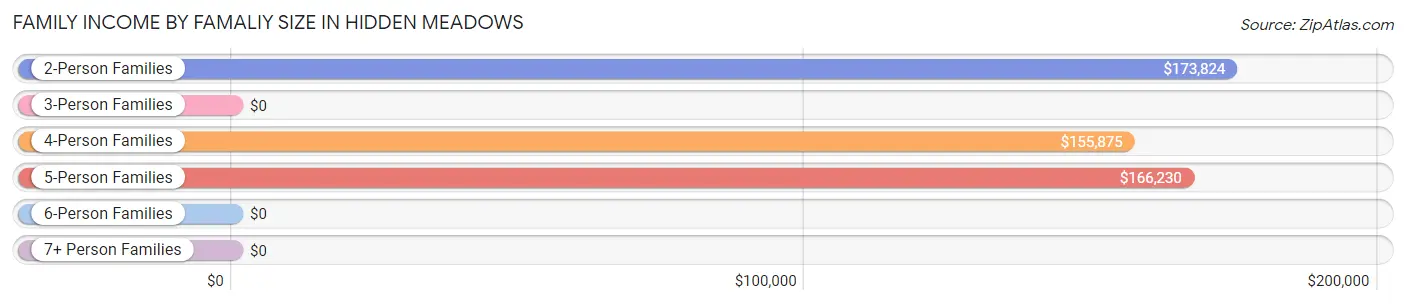
| Income Bracket | # Families | Median Income |
| 2-Person Families | 842 (69.2%) | $173,824 |
| 3-Person Families | 151 (12.4%) | $0 |
| 4-Person Families | 116 (9.5%) | $155,875 |
| 5-Person Families | 108 (8.9%) | $166,230 |
| 6-Person Families | 0 (0.0%) | $0 |
| 7+ Person Families | 0 (0.0%) | $0 |
| Total | 1,217 (100.0%) | $159,023 |
Family Income by Number of Earners in Hidden Meadows
The median family income in Hidden Meadows is $159,023, with families comprising 2 earners (547) having the highest median family income of $213,028, while families with no earners (280) have the lowest median family income of $84,861, accounting for 45.0% and 23.0% of families, respectively.
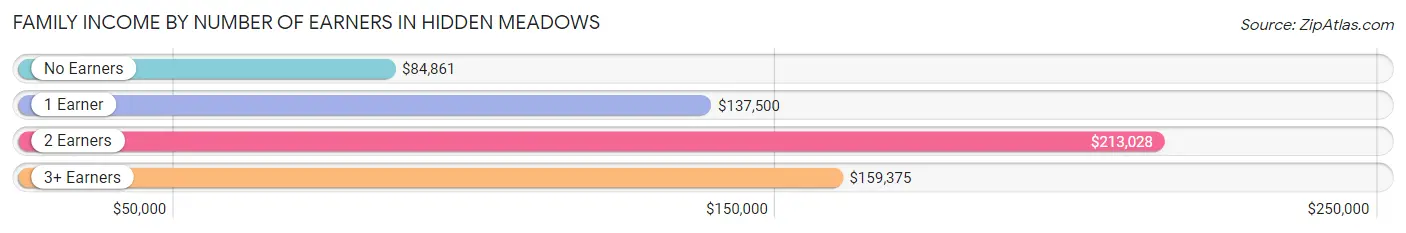
| Number of Earners | # Families | Median Income |
| No Earners | 280 (23.0%) | $84,861 |
| 1 Earner | 254 (20.9%) | $137,500 |
| 2 Earners | 547 (45.0%) | $213,028 |
| 3+ Earners | 136 (11.2%) | $159,375 |
| Total | 1,217 (100.0%) | $159,023 |
Household Income in Hidden Meadows
Household Income Brackets in Hidden Meadows
With 467 households falling in the category, the $200,000+ income range is the most frequent in Hidden Meadows, accounting for 27.8% of all households. In contrast, only 13 households (0.8%) fall into the $25,000 to $34,999 income bracket, making it the least populous group.
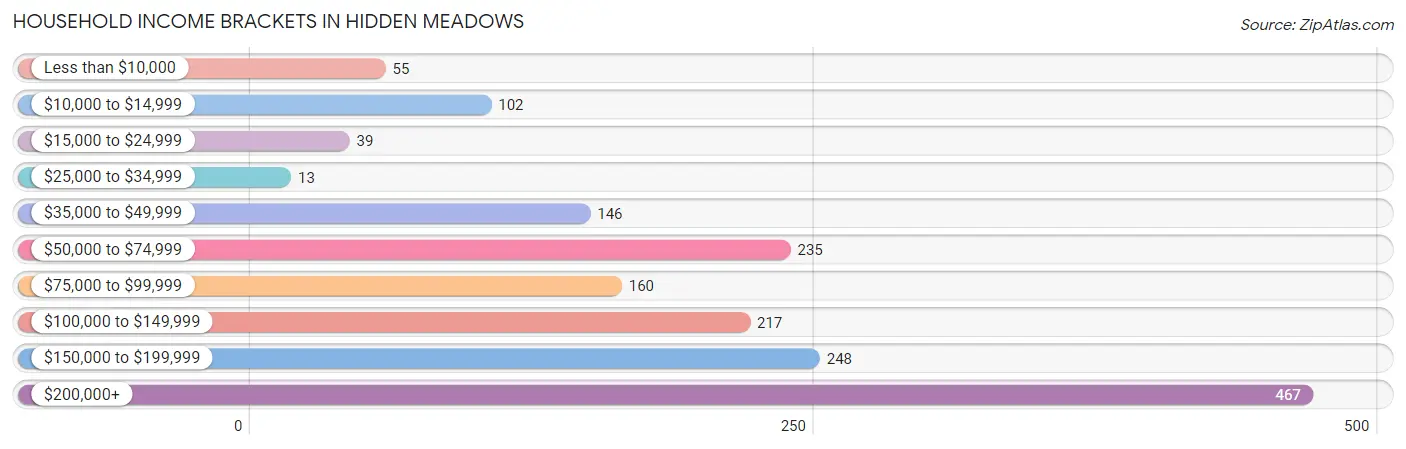
| Income Bracket | # Households | % Households |
| Less than $10,000 | 55 | 3.3% |
| $10,000 to $14,999 | 102 | 6.1% |
| $15,000 to $24,999 | 39 | 2.3% |
| $25,000 to $34,999 | 13 | 0.8% |
| $35,000 to $49,999 | 146 | 8.7% |
| $50,000 to $74,999 | 235 | 14.0% |
| $75,000 to $99,999 | 160 | 9.5% |
| $100,000 to $149,999 | 217 | 12.9% |
| $150,000 to $199,999 | 248 | 14.8% |
| $200,000+ | 467 | 27.8% |
Household Income by Householder Age in Hidden Meadows
The median household income in Hidden Meadows is $134,519, with the highest median household income of $213,081 found in the 25 to 44 years age bracket for the primary householder. A total of 403 households (24.0%) fall into this category.
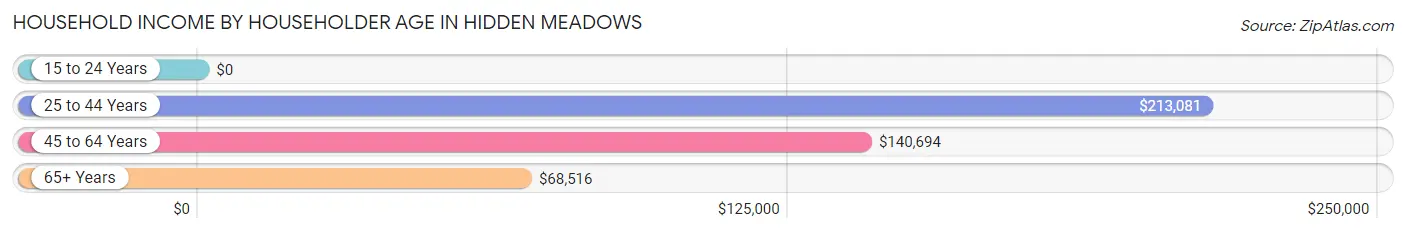
| Income Bracket | # Households | Median Income |
| 15 to 24 Years | 0 (0.0%) | $0 |
| 25 to 44 Years | 403 (24.0%) | $213,081 |
| 45 to 64 Years | 485 (28.9%) | $140,694 |
| 65+ Years | 791 (47.1%) | $68,516 |
| Total | 1,679 (100.0%) | $134,519 |
Poverty in Hidden Meadows
Income Below Poverty by Sex and Age in Hidden Meadows
With 4.2% poverty level for males and 12.4% for females among the residents of Hidden Meadows, 55 to 64 year old males and 75 year old and over females are the most vulnerable to poverty, with 55 males (14.9%) and 117 females (28.5%) in their respective age groups living below the poverty level.
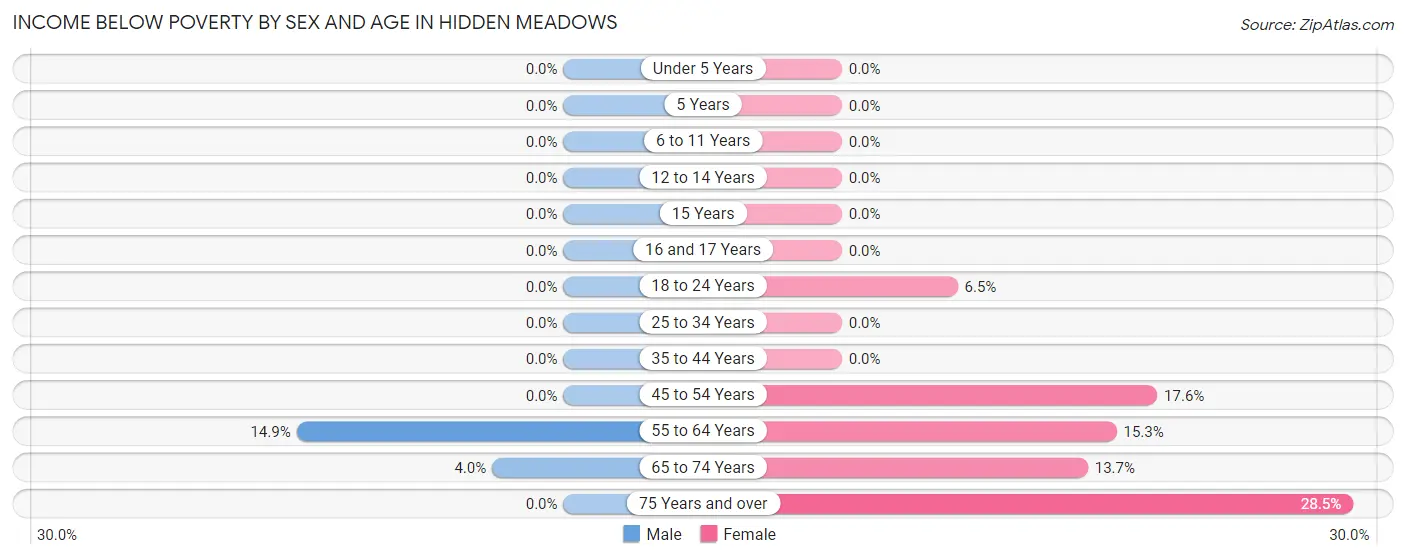
| Age Bracket | Male | Female |
| Under 5 Years | 0 (0.0%) | 0 (0.0%) |
| 5 Years | 0 (0.0%) | 0 (0.0%) |
| 6 to 11 Years | 0 (0.0%) | 0 (0.0%) |
| 12 to 14 Years | 0 (0.0%) | 0 (0.0%) |
| 15 Years | 0 (0.0%) | 0 (0.0%) |
| 16 and 17 Years | 0 (0.0%) | 0 (0.0%) |
| 18 to 24 Years | 0 (0.0%) | 8 (6.5%) |
| 25 to 34 Years | 0 (0.0%) | 0 (0.0%) |
| 35 to 44 Years | 0 (0.0%) | 0 (0.0%) |
| 45 to 54 Years | 0 (0.0%) | 23 (17.6%) |
| 55 to 64 Years | 55 (14.9%) | 56 (15.3%) |
| 65 to 74 Years | 17 (4.0%) | 40 (13.7%) |
| 75 Years and over | 0 (0.0%) | 117 (28.5%) |
| Total | 72 (4.2%) | 244 (12.4%) |
Income Above Poverty by Sex and Age in Hidden Meadows
According to the poverty statistics in Hidden Meadows, males aged under 5 years and females aged under 5 years are the age groups that are most secure financially, with 100.0% of males and 100.0% of females in these age groups living above the poverty line.
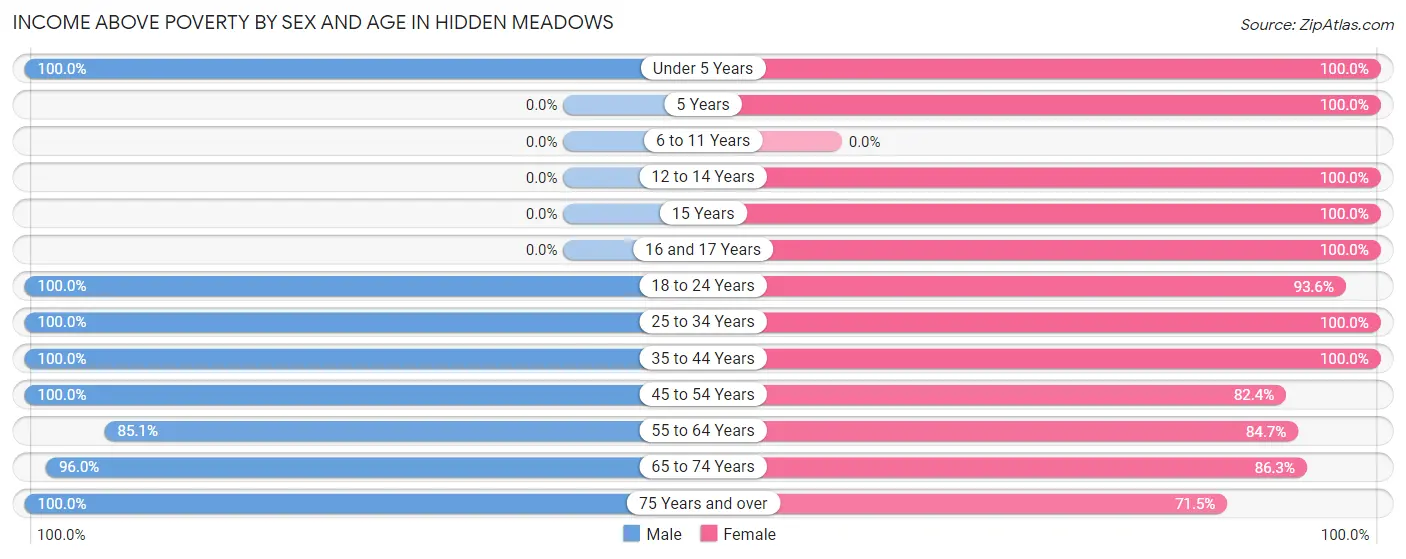
| Age Bracket | Male | Female |
| Under 5 Years | 128 (100.0%) | 152 (100.0%) |
| 5 Years | 0 (0.0%) | 23 (100.0%) |
| 6 to 11 Years | 0 (0.0%) | 0 (0.0%) |
| 12 to 14 Years | 0 (0.0%) | 78 (100.0%) |
| 15 Years | 0 (0.0%) | 18 (100.0%) |
| 16 and 17 Years | 0 (0.0%) | 27 (100.0%) |
| 18 to 24 Years | 68 (100.0%) | 116 (93.5%) |
| 25 to 34 Years | 334 (100.0%) | 104 (100.0%) |
| 35 to 44 Years | 121 (100.0%) | 236 (100.0%) |
| 45 to 54 Years | 91 (100.0%) | 108 (82.4%) |
| 55 to 64 Years | 315 (85.1%) | 310 (84.7%) |
| 65 to 74 Years | 411 (96.0%) | 252 (86.3%) |
| 75 Years and over | 196 (100.0%) | 294 (71.5%) |
| Total | 1,664 (95.9%) | 1,718 (87.6%) |
Income Below Poverty Among Married-Couple Families in Hidden Meadows
The poverty statistics for married-couple families in Hidden Meadows show that 5.0% or 55 of the total 1,100 families live below the poverty line. Families with no children have the highest poverty rate of 5.9%, comprising of 55 families. On the other hand, families with 1 or 2 children have the lowest poverty rate of 0.0%, which includes 0 families.
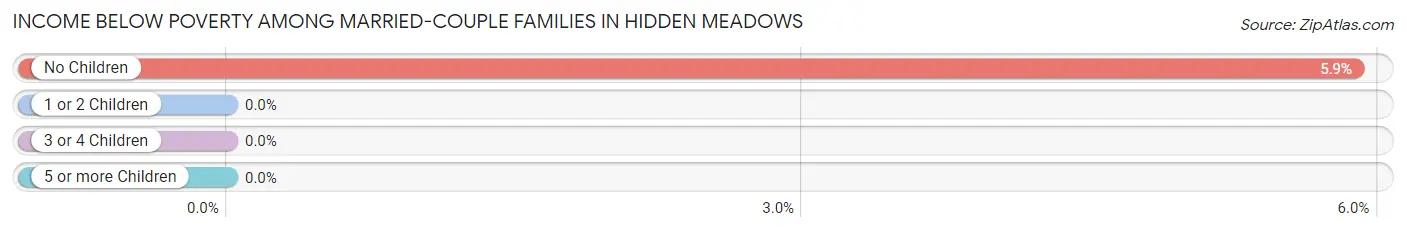
| Children | Above Poverty | Below Poverty |
| No Children | 880 (94.1%) | 55 (5.9%) |
| 1 or 2 Children | 80 (100.0%) | 0 (0.0%) |
| 3 or 4 Children | 85 (100.0%) | 0 (0.0%) |
| 5 or more Children | 0 (0.0%) | 0 (0.0%) |
| Total | 1,045 (95.0%) | 55 (5.0%) |
Income Below Poverty Among Single-Parent Households in Hidden Meadows
| Children | Single Father | Single Mother |
| No Children | 0 (0.0%) | 0 (0.0%) |
| 1 or 2 Children | 0 (0.0%) | 0 (0.0%) |
| 3 or 4 Children | 0 (0.0%) | 0 (0.0%) |
| 5 or more Children | 0 (0.0%) | 0 (0.0%) |
| Total | 0 (0.0%) | 0 (0.0%) |
Income Below Poverty Among Married-Couple vs Single-Parent Households in Hidden Meadows
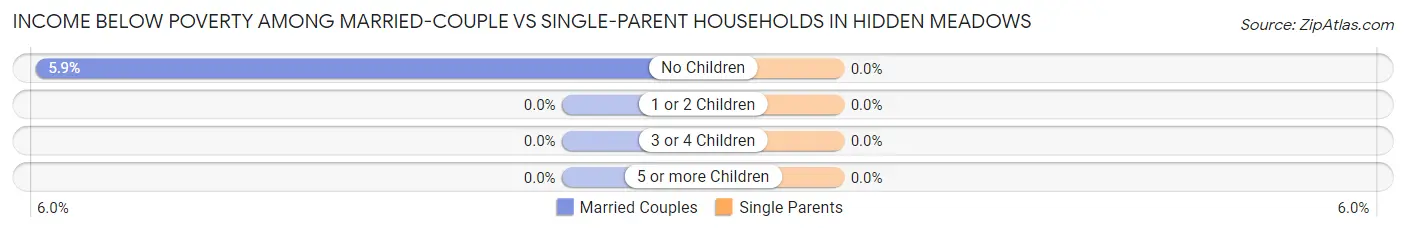
| Children | Married-Couple Families | Single-Parent Households |
| No Children | 55 (5.9%) | 0 (0.0%) |
| 1 or 2 Children | 0 (0.0%) | 0 (0.0%) |
| 3 or 4 Children | 0 (0.0%) | 0 (0.0%) |
| 5 or more Children | 0 (0.0%) | 0 (0.0%) |
| Total | 55 (5.0%) | 0 (0.0%) |
Race in Hidden Meadows
The most populous races in Hidden Meadows are White / Caucasian (2,830 | 76.5%), Hispanic or Latino (585 | 15.8%), and Asian (366 | 9.9%).
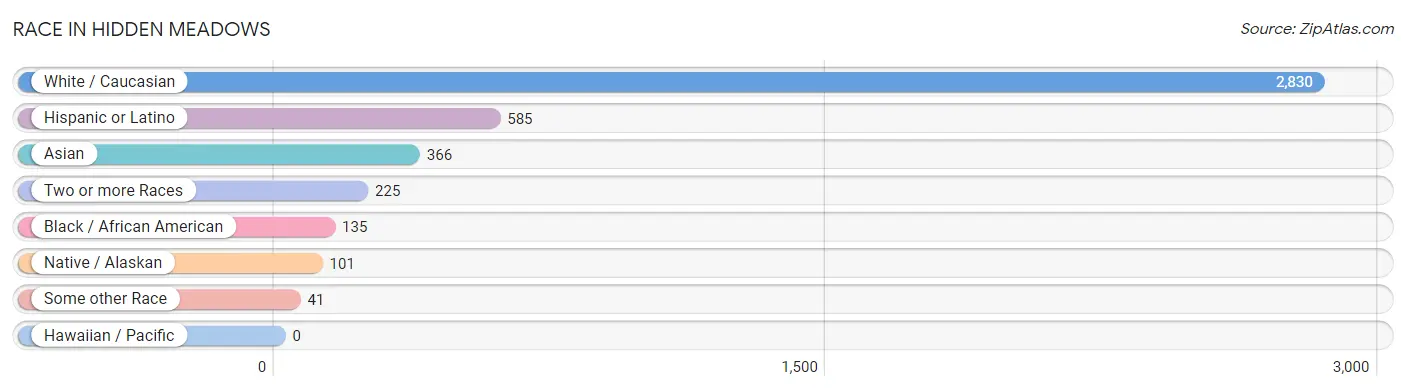
| Race | # Population | % Population |
| Asian | 366 | 9.9% |
| Black / African American | 135 | 3.6% |
| Hawaiian / Pacific | 0 | 0.0% |
| Hispanic or Latino | 585 | 15.8% |
| Native / Alaskan | 101 | 2.7% |
| White / Caucasian | 2,830 | 76.5% |
| Two or more Races | 225 | 6.1% |
| Some other Race | 41 | 1.1% |
| Total | 3,698 | 100.0% |
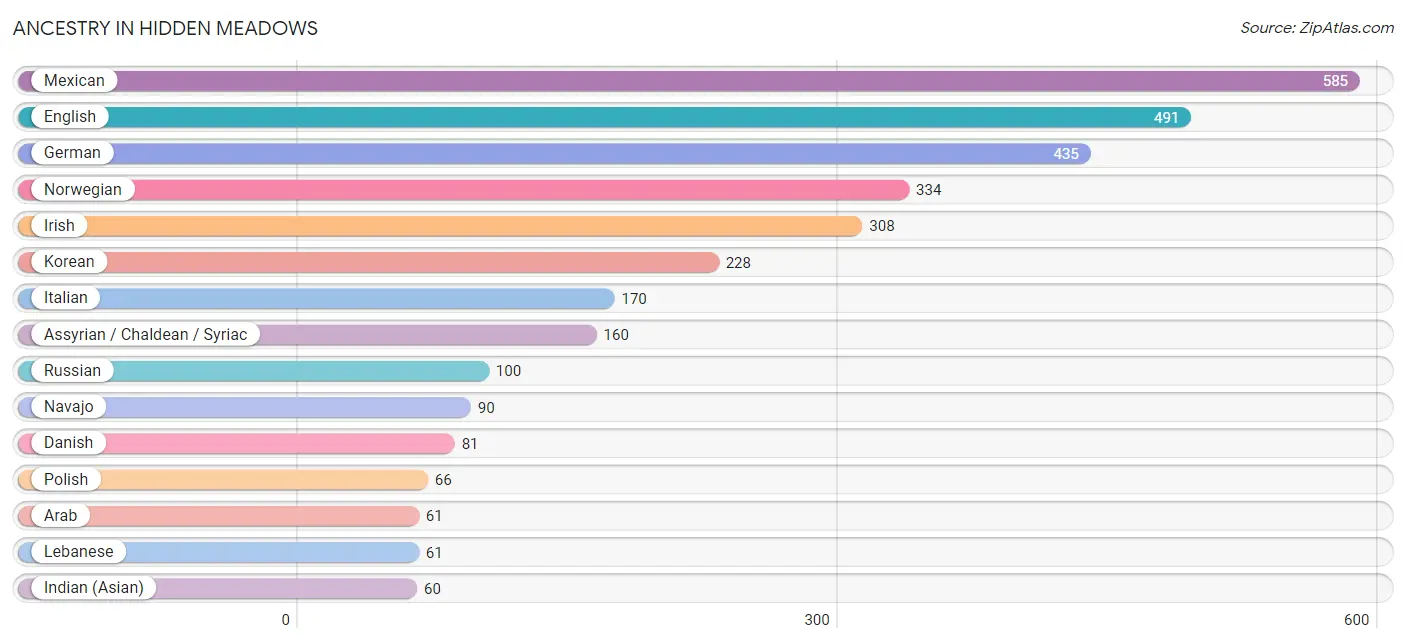
Ancestry in Hidden Meadows
The most populous ancestries reported in Hidden Meadows are Mexican (585 | 15.8%), English (491 | 13.3%), German (435 | 11.8%), Norwegian (334 | 9.0%), and Irish (308 | 8.3%), together accounting for 58.2% of all Hidden Meadows residents.
| Ancestry | # Population | % Population |
| American | 31 | 0.8% |
| Apache | 19 | 0.5% |
| Arab | 61 | 1.7% |
| Assyrian / Chaldean / Syriac | 160 | 4.3% |
| Austrian | 13 | 0.4% |
| Burmese | 43 | 1.2% |
| Canadian | 12 | 0.3% |
| Cherokee | 13 | 0.4% |
| Czechoslovakian | 12 | 0.3% |
| Danish | 81 | 2.2% |
| Dutch | 57 | 1.5% |
| English | 491 | 13.3% |
| European | 46 | 1.2% |
| Finnish | 23 | 0.6% |
| French | 47 | 1.3% |
| German | 435 | 11.8% |
| Greek | 42 | 1.1% |
| Hungarian | 36 | 1.0% |
| Indian (Asian) | 60 | 1.6% |
| Irish | 308 | 8.3% |
| Italian | 170 | 4.6% |
| Korean | 228 | 6.2% |
| Lebanese | 61 | 1.7% |
| Mexican | 585 | 15.8% |
| Navajo | 90 | 2.4% |
| Norwegian | 334 | 9.0% |
| Polish | 66 | 1.8% |
| Russian | 100 | 2.7% |
| Scandinavian | 29 | 0.8% |
| Scottish | 50 | 1.3% |
| Sioux | 11 | 0.3% |
| Slovak | 20 | 0.5% |
| Sri Lankan | 58 | 1.6% |
| Swedish | 30 | 0.8% |
| Ukrainian | 15 | 0.4% |
| Welsh | 24 | 0.6% | View All 36 Rows |
Immigrants in Hidden Meadows
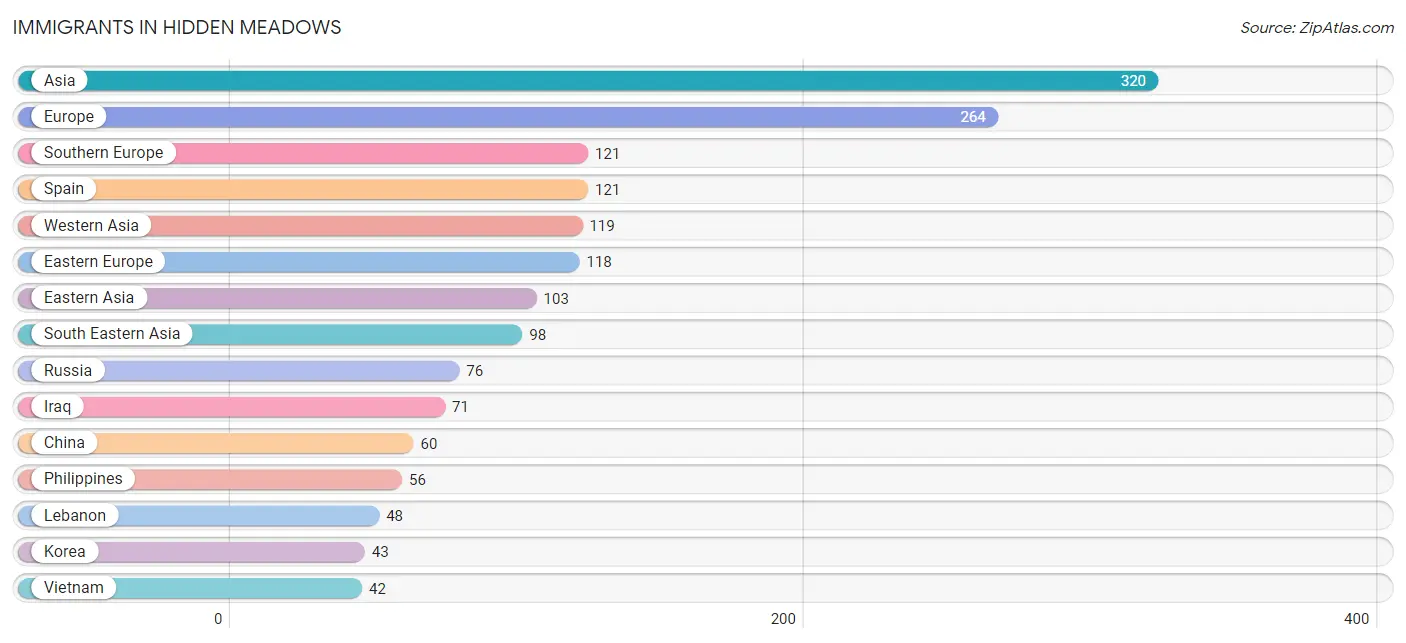
The most numerous immigrant groups reported in Hidden Meadows came from Asia (320 | 8.6%), Europe (264 | 7.1%), Southern Europe (121 | 3.3%), Spain (121 | 3.3%), and Western Asia (119 | 3.2%), together accounting for 25.6% of all Hidden Meadows residents.
| Immigration Origin | # Population | % Population |
| Asia | 320 | 8.6% |
| Canada | 12 | 0.3% |
| Central America | 7 | 0.2% |
| China | 60 | 1.6% |
| Eastern Asia | 103 | 2.8% |
| Eastern Europe | 118 | 3.2% |
| England | 7 | 0.2% |
| Europe | 264 | 7.1% |
| Germany | 18 | 0.5% |
| Hungary | 13 | 0.4% |
| Iraq | 71 | 1.9% |
| Korea | 43 | 1.2% |
| Latin America | 7 | 0.2% |
| Lebanon | 48 | 1.3% |
| Mexico | 7 | 0.2% |
| Northern Europe | 7 | 0.2% |
| Philippines | 56 | 1.5% |
| Russia | 76 | 2.1% |
| South Eastern Asia | 98 | 2.6% |
| Southern Europe | 121 | 3.3% |
| Spain | 121 | 3.3% |
| Ukraine | 29 | 0.8% |
| Vietnam | 42 | 1.1% |
| Western Asia | 119 | 3.2% |
| Western Europe | 18 | 0.5% | View All 25 Rows |
Sex and Age in Hidden Meadows
Sex and Age in Hidden Meadows
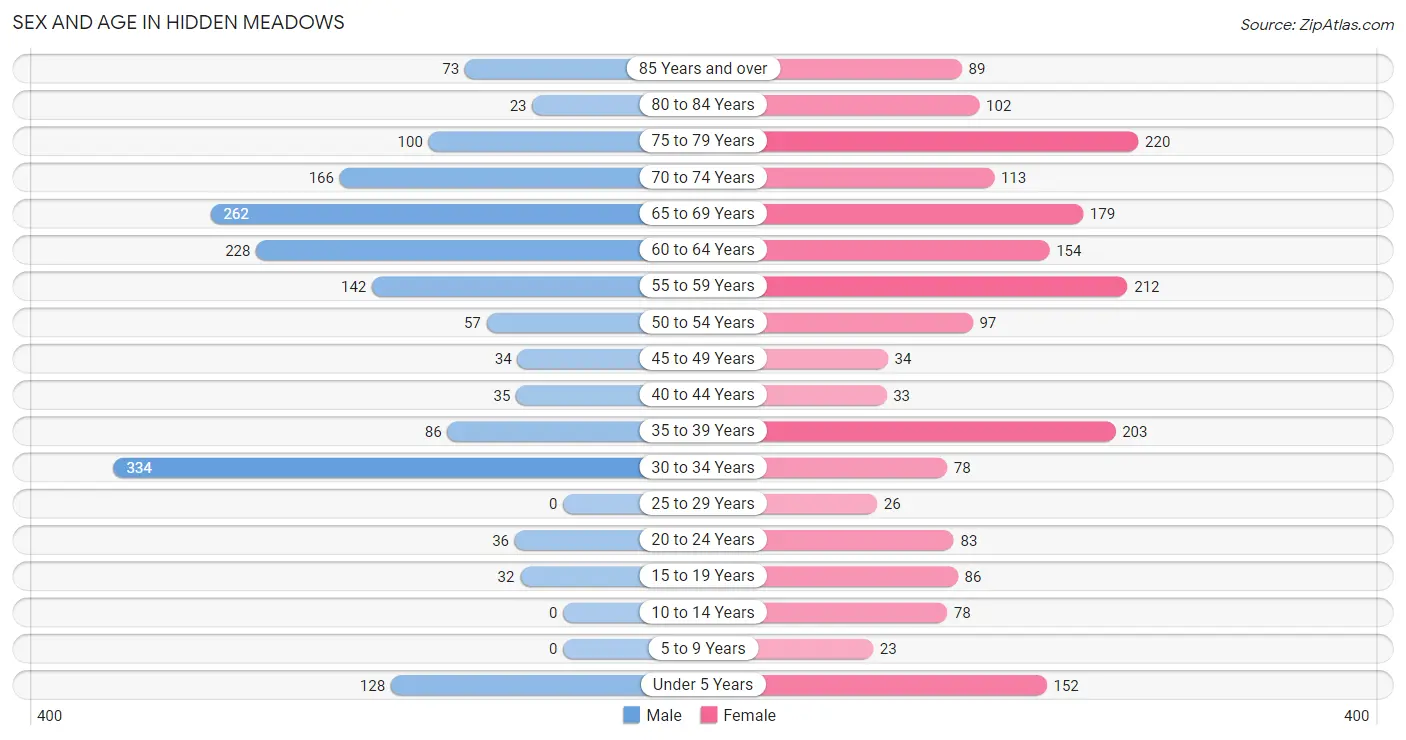
The most populous age groups in Hidden Meadows are 30 to 34 Years (334 | 19.2%) for men and 75 to 79 Years (220 | 11.2%) for women.
| Age Bracket | Male | Female |
| Under 5 Years | 128 (7.4%) | 152 (7.7%) |
| 5 to 9 Years | 0 (0.0%) | 23 (1.2%) |
| 10 to 14 Years | 0 (0.0%) | 78 (4.0%) |
| 15 to 19 Years | 32 (1.8%) | 86 (4.4%) |
| 20 to 24 Years | 36 (2.1%) | 83 (4.2%) |
| 25 to 29 Years | 0 (0.0%) | 26 (1.3%) |
| 30 to 34 Years | 334 (19.2%) | 78 (4.0%) |
| 35 to 39 Years | 86 (5.0%) | 203 (10.3%) |
| 40 to 44 Years | 35 (2.0%) | 33 (1.7%) |
| 45 to 49 Years | 34 (2.0%) | 34 (1.7%) |
| 50 to 54 Years | 57 (3.3%) | 97 (4.9%) |
| 55 to 59 Years | 142 (8.2%) | 212 (10.8%) |
| 60 to 64 Years | 228 (13.1%) | 154 (7.9%) |
| 65 to 69 Years | 262 (15.1%) | 179 (9.1%) |
| 70 to 74 Years | 166 (9.6%) | 113 (5.8%) |
| 75 to 79 Years | 100 (5.8%) | 220 (11.2%) |
| 80 to 84 Years | 23 (1.3%) | 102 (5.2%) |
| 85 Years and over | 73 (4.2%) | 89 (4.5%) |
| Total | 1,736 (100.0%) | 1,962 (100.0%) |
Families and Households in Hidden Meadows
Median Family Size in Hidden Meadows
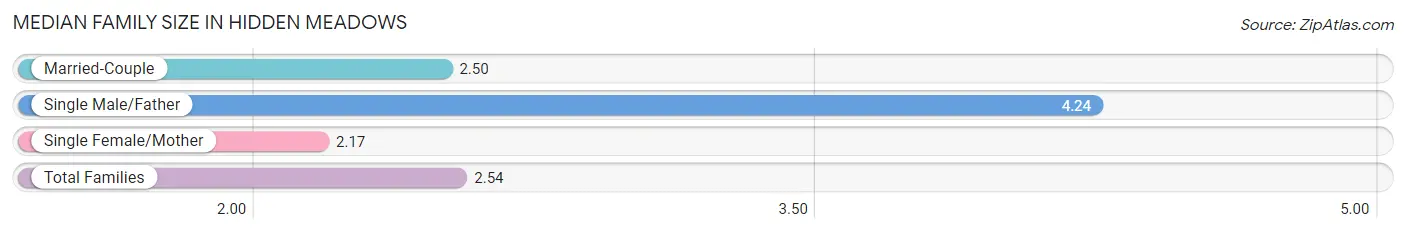
The median family size in Hidden Meadows is 2.54 persons per family, with single male/father families (41 | 3.4%) accounting for the largest median family size of 4.24 persons per family. On the other hand, single female/mother families (76 | 6.2%) represent the smallest median family size with 2.17 persons per family.
| Family Type | # Families | Family Size |
| Married-Couple | 1,100 (90.4%) | 2.50 |
| Single Male/Father | 41 (3.4%) | 4.24 |
| Single Female/Mother | 76 (6.2%) | 2.17 |
| Total Families | 1,217 (100.0%) | 2.54 |
Median Household Size in Hidden Meadows
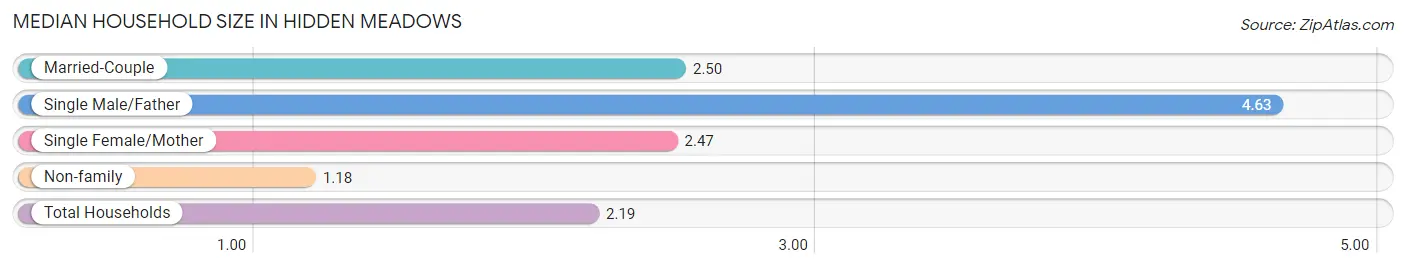
The median household size in Hidden Meadows is 2.19 persons per household, with single male/father households (41 | 2.4%) accounting for the largest median household size of 4.63 persons per household. non-family households (462 | 27.5%) represent the smallest median household size with 1.18 persons per household.
| Household Type | # Households | Household Size |
| Married-Couple | 1,100 (65.5%) | 2.50 |
| Single Male/Father | 41 (2.4%) | 4.63 |
| Single Female/Mother | 76 (4.5%) | 2.47 |
| Non-family | 462 (27.5%) | 1.18 |
| Total Households | 1,679 (100.0%) | 2.19 |
Household Size by Marriage Status in Hidden Meadows
Out of a total of 1,679 households in Hidden Meadows, 1,217 (72.5%) are family households, while 462 (27.5%) are nonfamily households. The most numerous type of family households are 2-person households, comprising 823, and the most common type of nonfamily households are 1-person households, comprising 388.
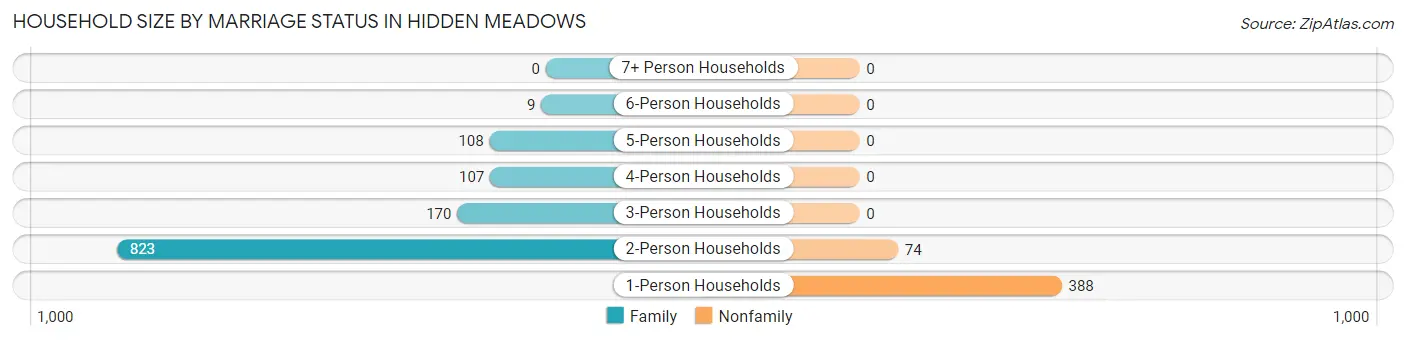
| Household Size | Family Households | Nonfamily Households |
| 1-Person Households | - | 388 (23.1%) |
| 2-Person Households | 823 (49.0%) | 74 (4.4%) |
| 3-Person Households | 170 (10.1%) | 0 (0.0%) |
| 4-Person Households | 107 (6.4%) | 0 (0.0%) |
| 5-Person Households | 108 (6.4%) | 0 (0.0%) |
| 6-Person Households | 9 (0.5%) | 0 (0.0%) |
| 7+ Person Households | 0 (0.0%) | 0 (0.0%) |
| Total | 1,217 (72.5%) | 462 (27.5%) |
Female Fertility in Hidden Meadows
Fertility by Age in Hidden Meadows
| Age Bracket | Women with Births | Births / 1,000 Women |
| 15 to 19 years | 0 (0.0%) | 0.0 |
| 20 to 34 years | 0 (0.0%) | 0.0 |
| 35 to 50 years | 0 (0.0%) | 0.0 |
| Total | 0 (0.0%) | 0.0 |
Fertility by Age by Marriage Status in Hidden Meadows
| Age Bracket | Married | Unmarried |
| 15 to 19 years | 0 (0.0%) | 0 (0.0%) |
| 20 to 34 years | 0 (0.0%) | 0 (0.0%) |
| 35 to 50 years | 0 (0.0%) | 0 (0.0%) |
| Total | 0 (0.0%) | 0 (0.0%) |
Fertility by Education in Hidden Meadows
| Educational Attainment | Women with Births | Births / 1,000 Women |
| Less than High School | 0 (0.0%) | 0.0 |
| High School Diploma | 0 (0.0%) | 0.0 |
| College or Associate's Degree | 0 (0.0%) | 0.0 |
| Bachelor's Degree | 0 (0.0%) | 0.0 |
| Graduate Degree | 0 (0.0%) | 0.0 |
| Total | 0 (0.0%) | 0.0 |
Fertility by Education by Marriage Status in Hidden Meadows
| Educational Attainment | Married | Unmarried |
| Less than High School | 0 (0.0%) | 0 (0.0%) |
| High School Diploma | 0 (0.0%) | 0 (0.0%) |
| College or Associate's Degree | 0 (0.0%) | 0 (0.0%) |
| Bachelor's Degree | 0 (0.0%) | 0 (0.0%) |
| Graduate Degree | 0 (0.0%) | 0 (0.0%) |
| Total | 0 (0.0%) | 0 (0.0%) |
Employment Characteristics in Hidden Meadows
Employment by Class of Employer in Hidden Meadows
Among the 1,449 employed individuals in Hidden Meadows, private company employees (872 | 60.2%), self-employed (not incorporated) (191 | 13.2%), and state government employees (125 | 8.6%) make up the most common classes of employment.
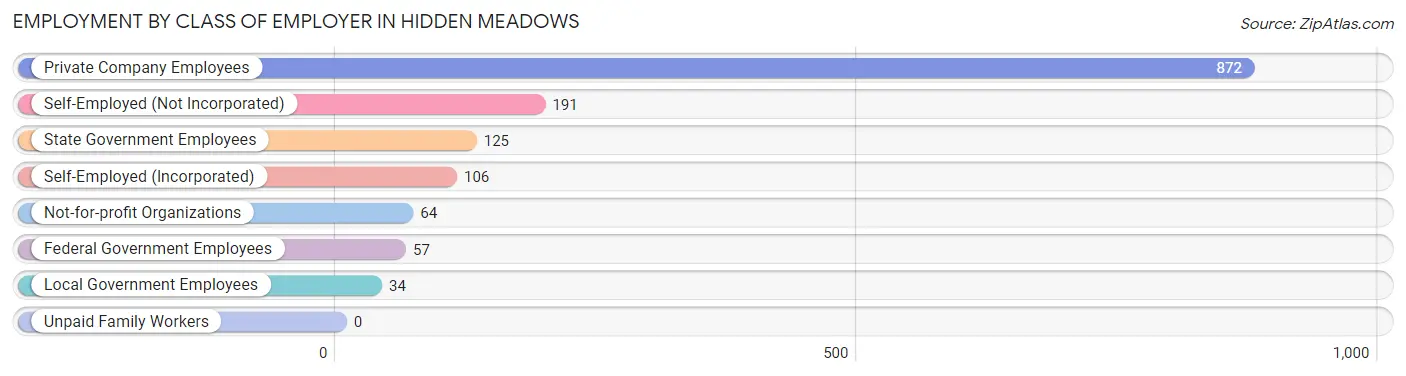
| Employer Class | # Employees | % Employees |
| Private Company Employees | 872 | 60.2% |
| Self-Employed (Incorporated) | 106 | 7.3% |
| Self-Employed (Not Incorporated) | 191 | 13.2% |
| Not-for-profit Organizations | 64 | 4.4% |
| Local Government Employees | 34 | 2.4% |
| State Government Employees | 125 | 8.6% |
| Federal Government Employees | 57 | 3.9% |
| Unpaid Family Workers | 0 | 0.0% |
| Total | 1,449 | 100.0% |
Employment Status by Age in Hidden Meadows
According to the labor force statistics for Hidden Meadows, out of the total population over 16 years of age (3,299), 53.8% or 1,775 individuals are in the labor force, with 17.2% or 305 of them unemployed. The age group with the highest labor force participation rate is 25 to 29 years, with 100.0% or 26 individuals in the labor force. Within the labor force, the 30 to 34 years age range has the highest percentage of unemployed individuals, with 58.0% or 239 of them being unemployed.
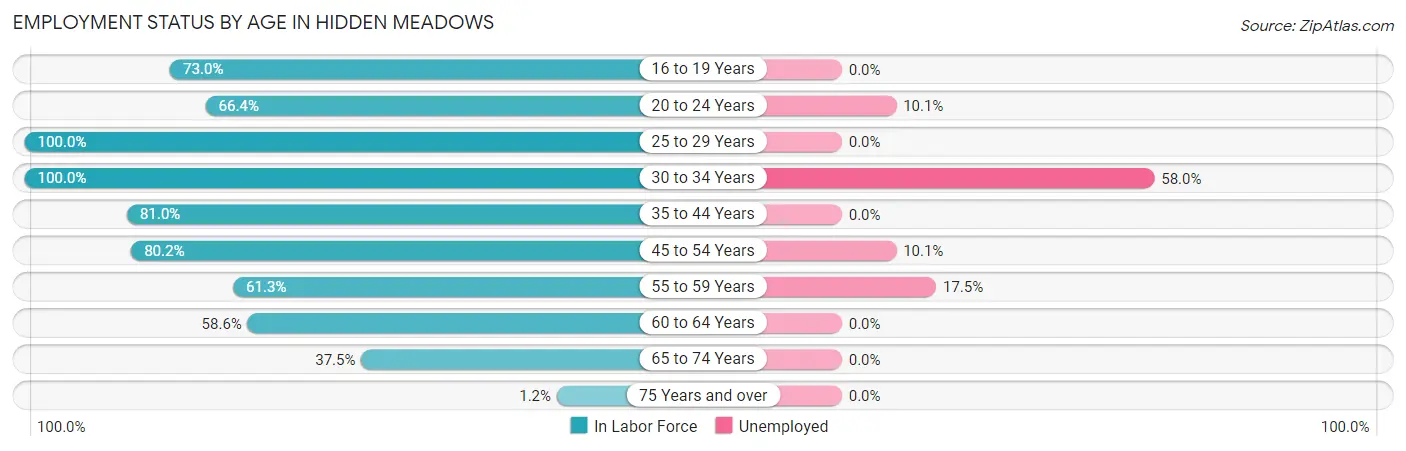
| Age Bracket | In Labor Force | Unemployed |
| 16 to 19 Years | 73 (73.0%) | 0 (0.0%) |
| 20 to 24 Years | 79 (66.4%) | 8 (10.1%) |
| 25 to 29 Years | 26 (100.0%) | 0 (0.0%) |
| 30 to 34 Years | 412 (100.0%) | 239 (58.0%) |
| 35 to 44 Years | 289 (81.0%) | 0 (0.0%) |
| 45 to 54 Years | 178 (80.2%) | 18 (10.1%) |
| 55 to 59 Years | 217 (61.3%) | 38 (17.5%) |
| 60 to 64 Years | 224 (58.6%) | 0 (0.0%) |
| 65 to 74 Years | 270 (37.5%) | 0 (0.0%) |
| 75 Years and over | 7 (1.2%) | 0 (0.0%) |
| Total | 1,775 (53.8%) | 305 (17.2%) |
Employment Status by Educational Attainment in Hidden Meadows
According to labor force statistics for Hidden Meadows, 76.8% of individuals (1,346) out of the total population between 25 and 64 years of age (1,753) are in the labor force, with 22.2% or 299 of them being unemployed. The group with the highest labor force participation rate are those with the educational attainment of less than high school, with 95.8% or 68 individuals in the labor force. Within the labor force, individuals with college / associate degree education have the highest percentage of unemployment, with 52.8% or 239 of them being unemployed.
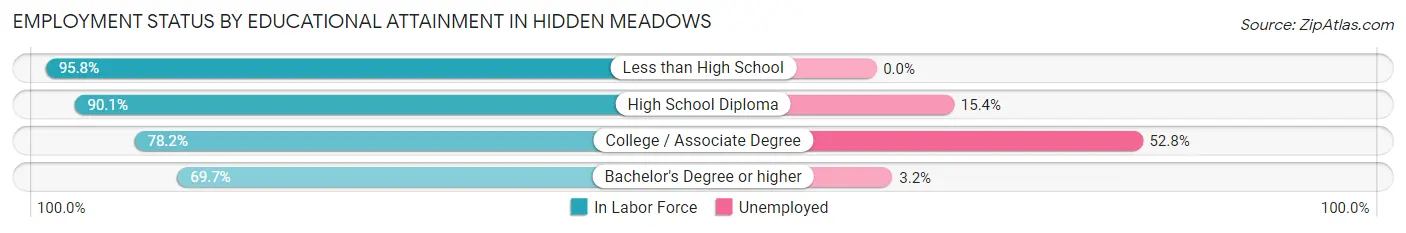
| Educational Attainment | In Labor Force | Unemployed |
| Less than High School | 68 (95.8%) | 0 (0.0%) |
| High School Diploma | 247 (90.1%) | 42 (15.4%) |
| College / Associate Degree | 453 (78.2%) | 306 (52.8%) |
| Bachelor's Degree or higher | 578 (69.7%) | 27 (3.2%) |
| Total | 1,346 (76.8%) | 389 (22.2%) |
Employment Occupations by Sex in Hidden Meadows
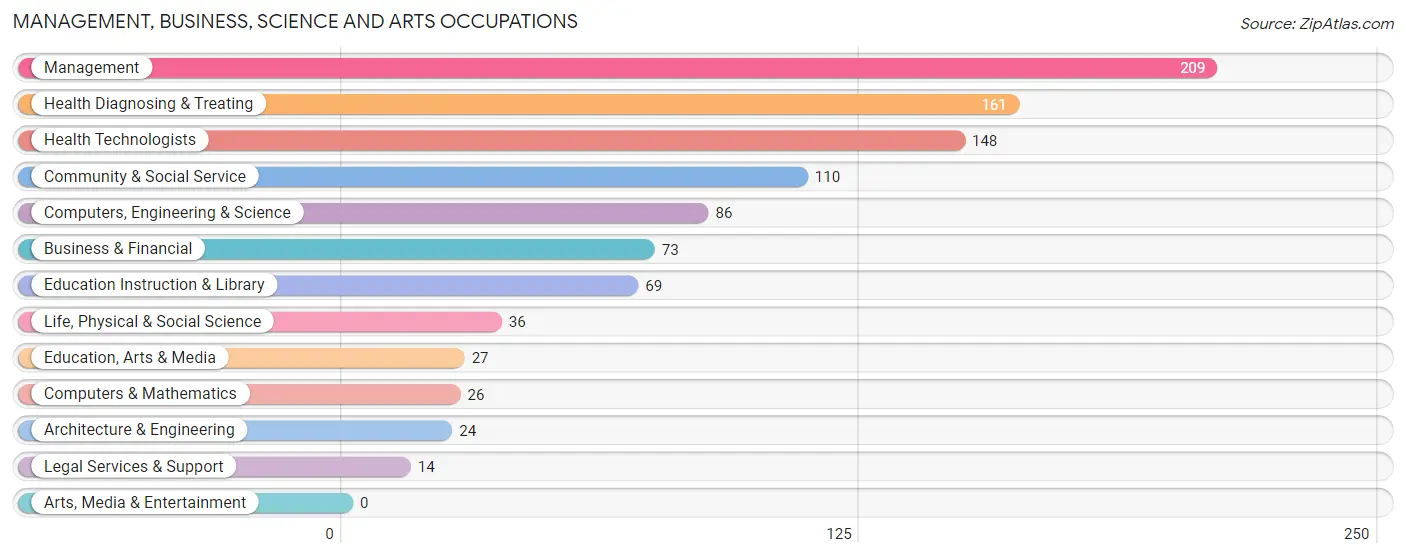
Management, Business, Science and Arts Occupations
The most common Management, Business, Science and Arts occupations in Hidden Meadows are Management (209 | 14.3%), Health Diagnosing & Treating (161 | 11.1%), Health Technologists (148 | 10.2%), Community & Social Service (110 | 7.5%), and Computers, Engineering & Science (86 | 5.9%).
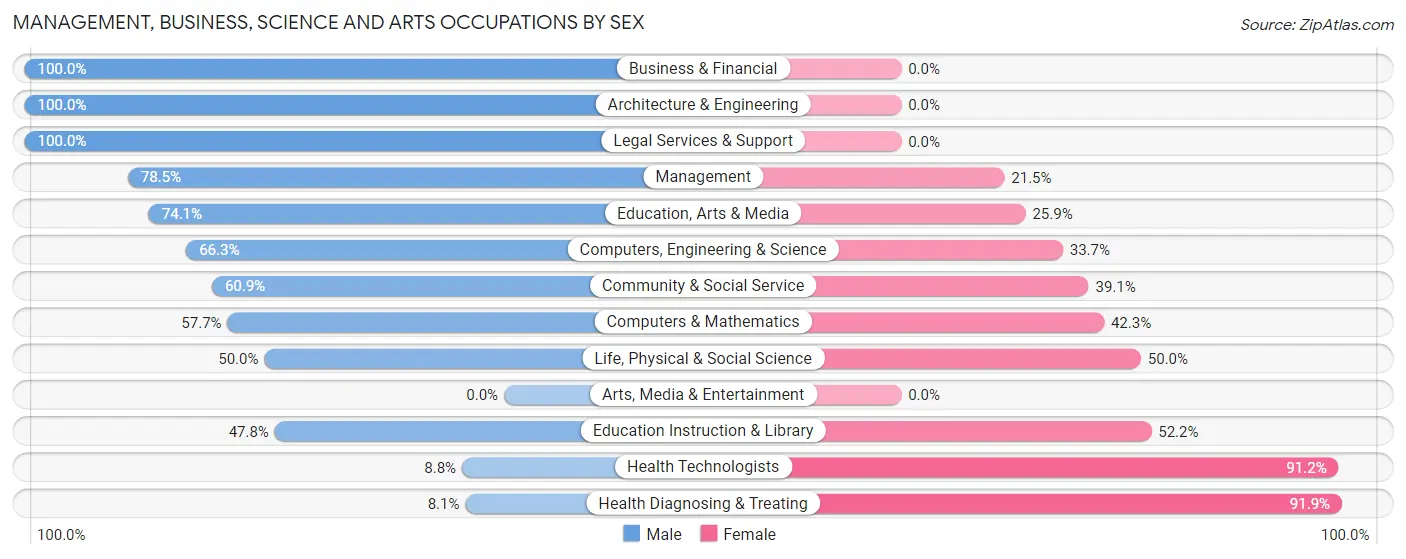
Management, Business, Science and Arts Occupations by Sex
Within the Management, Business, Science and Arts occupations in Hidden Meadows, the most male-oriented occupations are Business & Financial (100.0%), Architecture & Engineering (100.0%), and Legal Services & Support (100.0%), while the most female-oriented occupations are Health Diagnosing & Treating (91.9%), Health Technologists (91.2%), and Education Instruction & Library (52.2%).
| Occupation | Male | Female |
| Management | 164 (78.5%) | 45 (21.5%) |
| Business & Financial | 73 (100.0%) | 0 (0.0%) |
| Computers, Engineering & Science | 57 (66.3%) | 29 (33.7%) |
| Computers & Mathematics | 15 (57.7%) | 11 (42.3%) |
| Architecture & Engineering | 24 (100.0%) | 0 (0.0%) |
| Life, Physical & Social Science | 18 (50.0%) | 18 (50.0%) |
| Community & Social Service | 67 (60.9%) | 43 (39.1%) |
| Education, Arts & Media | 20 (74.1%) | 7 (25.9%) |
| Legal Services & Support | 14 (100.0%) | 0 (0.0%) |
| Education Instruction & Library | 33 (47.8%) | 36 (52.2%) |
| Arts, Media & Entertainment | 0 (0.0%) | 0 (0.0%) |
| Health Diagnosing & Treating | 13 (8.1%) | 148 (91.9%) |
| Health Technologists | 13 (8.8%) | 135 (91.2%) |
| Total (Category) | 374 (58.5%) | 265 (41.5%) |
| Total (Overall) | 785 (53.9%) | 672 (46.1%) |
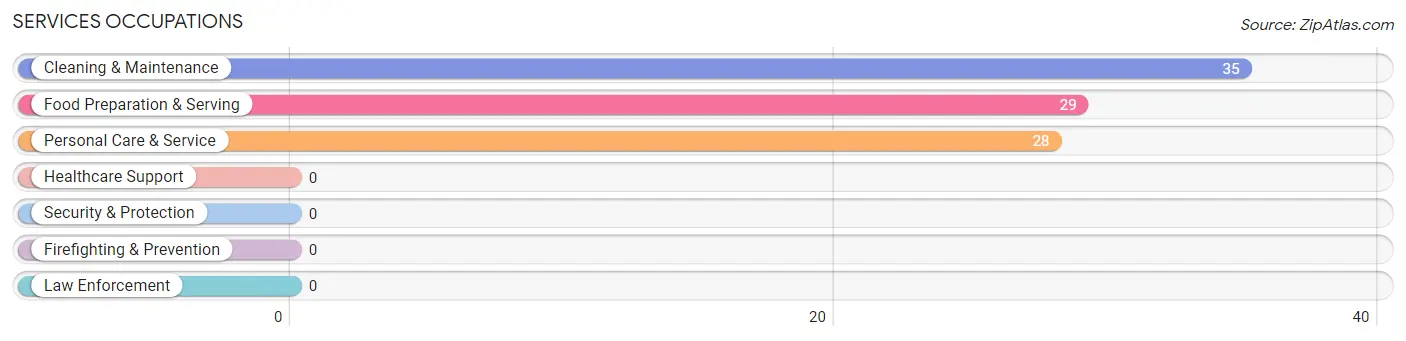
Services Occupations
The most common Services occupations in Hidden Meadows are Cleaning & Maintenance (35 | 2.4%), Food Preparation & Serving (29 | 2.0%), and Personal Care & Service (28 | 1.9%).
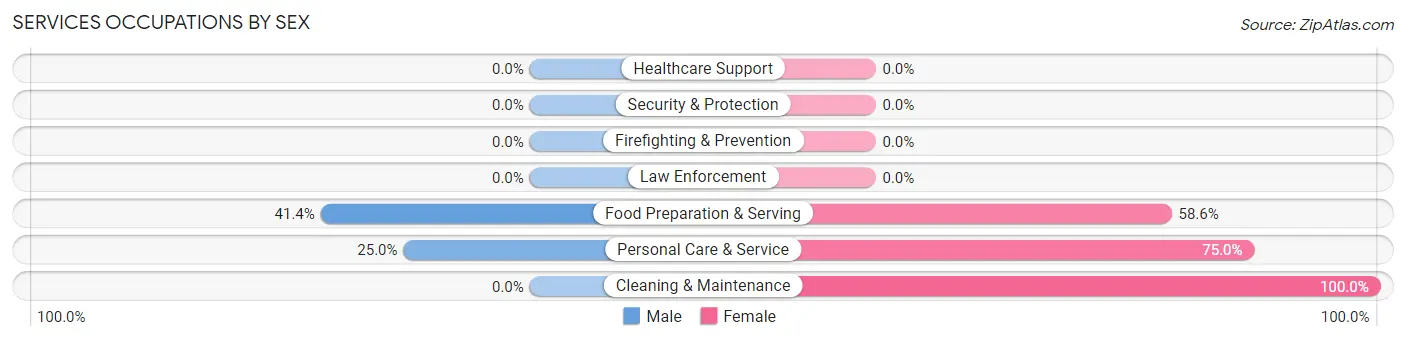
Services Occupations by Sex
Within the Services occupations in Hidden Meadows, the most male-oriented occupations are Food Preparation & Serving (41.4%), and Personal Care & Service (25.0%), while the most female-oriented occupations are Cleaning & Maintenance (100.0%), Personal Care & Service (75.0%), and Food Preparation & Serving (58.6%).
| Occupation | Male | Female |
| Healthcare Support | 0 (0.0%) | 0 (0.0%) |
| Security & Protection | 0 (0.0%) | 0 (0.0%) |
| Firefighting & Prevention | 0 (0.0%) | 0 (0.0%) |
| Law Enforcement | 0 (0.0%) | 0 (0.0%) |
| Food Preparation & Serving | 12 (41.4%) | 17 (58.6%) |
| Cleaning & Maintenance | 0 (0.0%) | 35 (100.0%) |
| Personal Care & Service | 7 (25.0%) | 21 (75.0%) |
| Total (Category) | 19 (20.6%) | 73 (79.3%) |
| Total (Overall) | 785 (53.9%) | 672 (46.1%) |
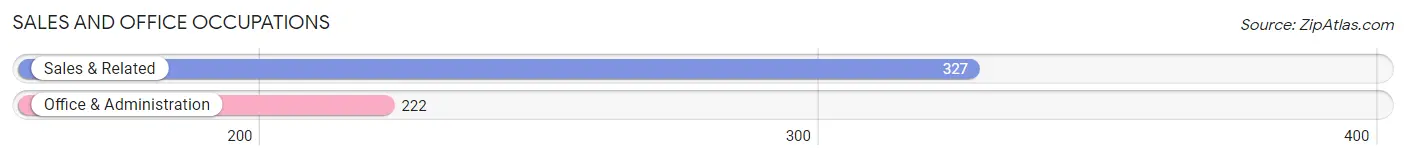
Sales and Office Occupations
The most common Sales and Office occupations in Hidden Meadows are Sales & Related (327 | 22.4%), and Office & Administration (222 | 15.2%).
Sales and Office Occupations by Sex
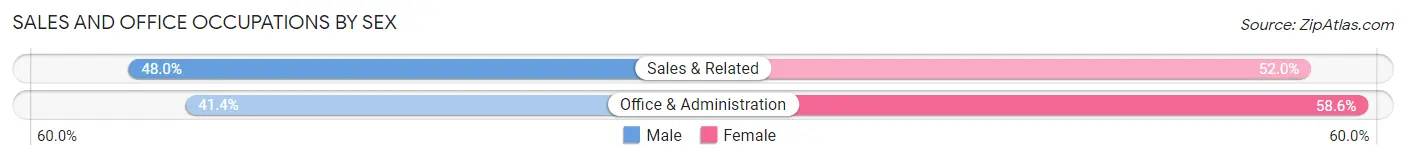
| Occupation | Male | Female |
| Sales & Related | 157 (48.0%) | 170 (52.0%) |
| Office & Administration | 92 (41.4%) | 130 (58.6%) |
| Total (Category) | 249 (45.4%) | 300 (54.6%) |
| Total (Overall) | 785 (53.9%) | 672 (46.1%) |
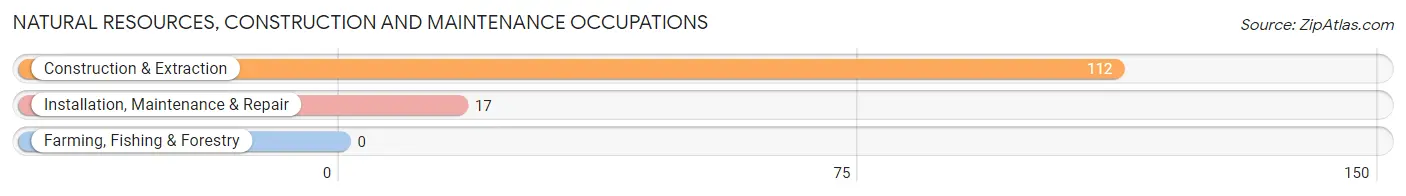
Natural Resources, Construction and Maintenance Occupations
The most common Natural Resources, Construction and Maintenance occupations in Hidden Meadows are Construction & Extraction (112 | 7.7%), and Installation, Maintenance & Repair (17 | 1.2%).
Natural Resources, Construction and Maintenance Occupations by Sex
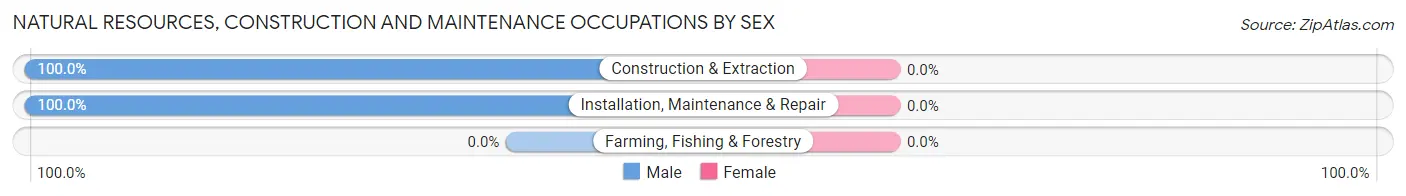
| Occupation | Male | Female |
| Farming, Fishing & Forestry | 0 (0.0%) | 0 (0.0%) |
| Construction & Extraction | 112 (100.0%) | 0 (0.0%) |
| Installation, Maintenance & Repair | 17 (100.0%) | 0 (0.0%) |
| Total (Category) | 129 (100.0%) | 0 (0.0%) |
| Total (Overall) | 785 (53.9%) | 672 (46.1%) |
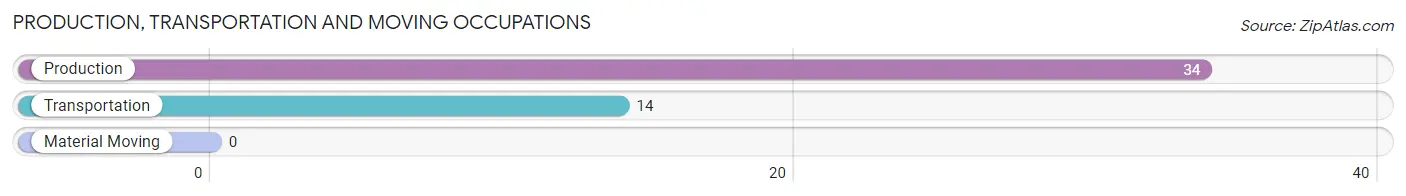
Production, Transportation and Moving Occupations
The most common Production, Transportation and Moving occupations in Hidden Meadows are Production (34 | 2.3%), and Transportation (14 | 1.0%).
Production, Transportation and Moving Occupations by Sex
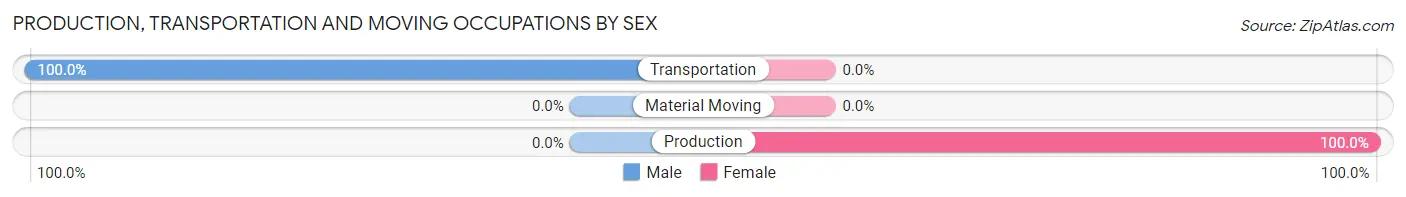
| Occupation | Male | Female |
| Production | 0 (0.0%) | 34 (100.0%) |
| Transportation | 14 (100.0%) | 0 (0.0%) |
| Material Moving | 0 (0.0%) | 0 (0.0%) |
| Total (Category) | 14 (29.2%) | 34 (70.8%) |
| Total (Overall) | 785 (53.9%) | 672 (46.1%) |
Employment Industries by Sex in Hidden Meadows
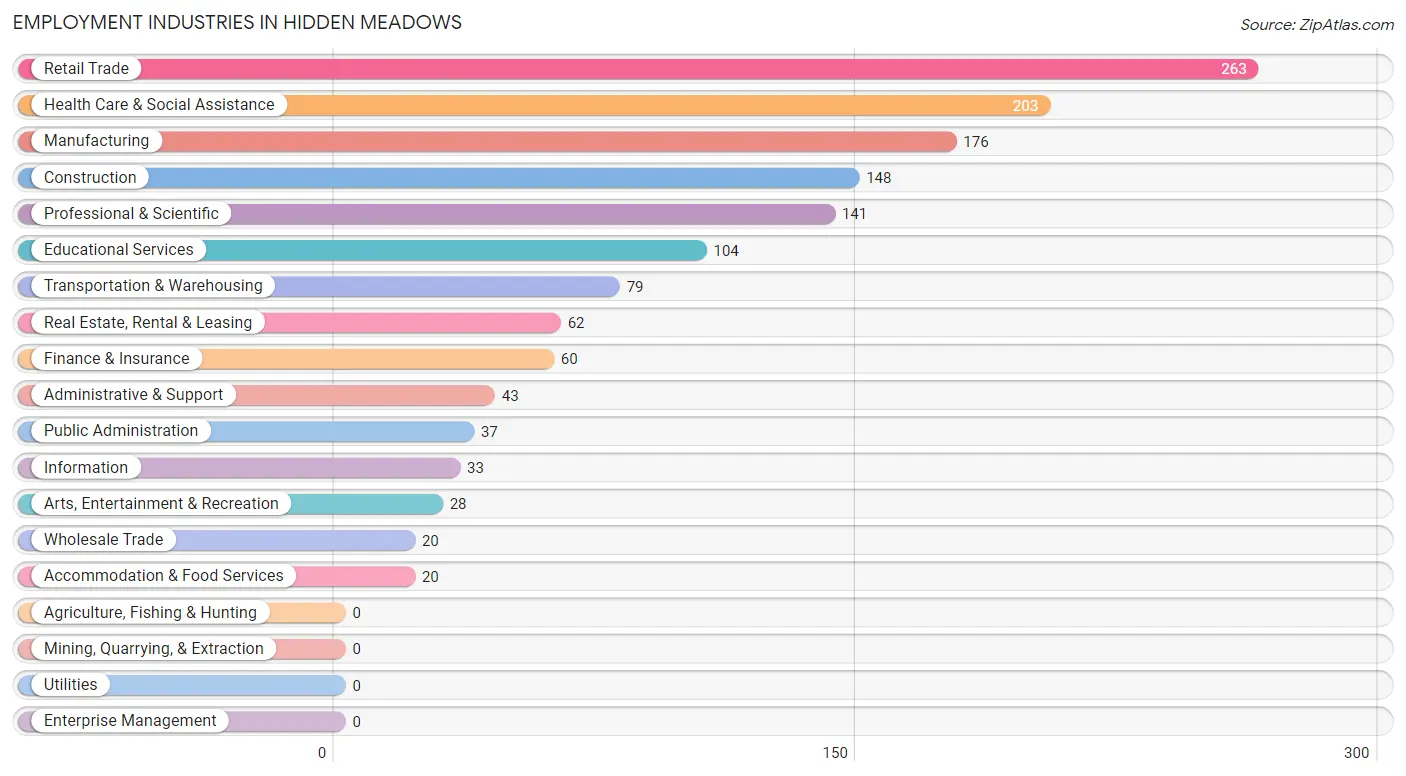
Employment Industries in Hidden Meadows
The major employment industries in Hidden Meadows include Retail Trade (263 | 18.0%), Health Care & Social Assistance (203 | 13.9%), Manufacturing (176 | 12.1%), Construction (148 | 10.2%), and Professional & Scientific (141 | 9.7%).
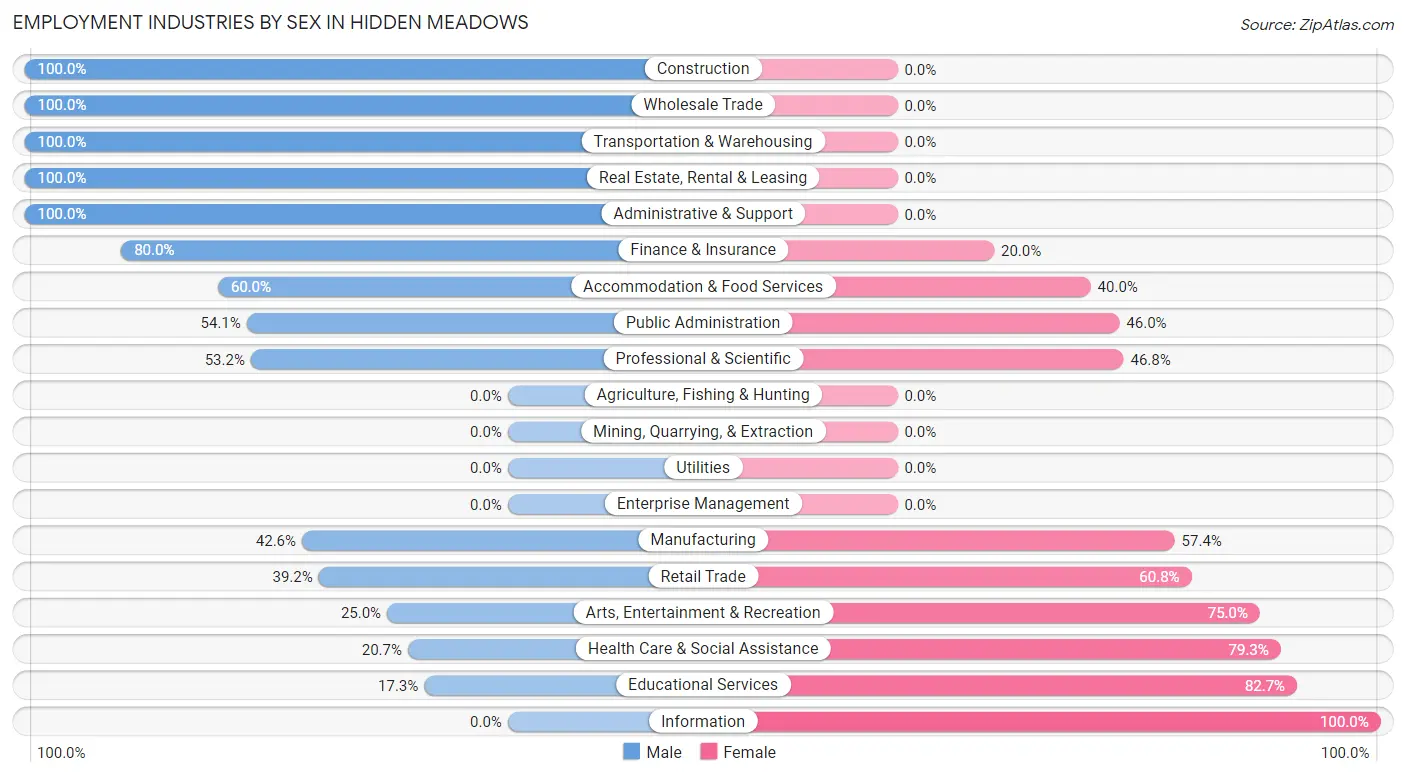
Employment Industries by Sex in Hidden Meadows
The Hidden Meadows industries that see more men than women are Construction (100.0%), Wholesale Trade (100.0%), and Transportation & Warehousing (100.0%), whereas the industries that tend to have a higher number of women are Information (100.0%), Educational Services (82.7%), and Health Care & Social Assistance (79.3%).
| Industry | Male | Female |
| Agriculture, Fishing & Hunting | 0 (0.0%) | 0 (0.0%) |
| Mining, Quarrying, & Extraction | 0 (0.0%) | 0 (0.0%) |
| Construction | 148 (100.0%) | 0 (0.0%) |
| Manufacturing | 75 (42.6%) | 101 (57.4%) |
| Wholesale Trade | 20 (100.0%) | 0 (0.0%) |
| Retail Trade | 103 (39.2%) | 160 (60.8%) |
| Transportation & Warehousing | 79 (100.0%) | 0 (0.0%) |
| Utilities | 0 (0.0%) | 0 (0.0%) |
| Information | 0 (0.0%) | 33 (100.0%) |
| Finance & Insurance | 48 (80.0%) | 12 (20.0%) |
| Real Estate, Rental & Leasing | 62 (100.0%) | 0 (0.0%) |
| Professional & Scientific | 75 (53.2%) | 66 (46.8%) |
| Enterprise Management | 0 (0.0%) | 0 (0.0%) |
| Administrative & Support | 43 (100.0%) | 0 (0.0%) |
| Educational Services | 18 (17.3%) | 86 (82.7%) |
| Health Care & Social Assistance | 42 (20.7%) | 161 (79.3%) |
| Arts, Entertainment & Recreation | 7 (25.0%) | 21 (75.0%) |
| Accommodation & Food Services | 12 (60.0%) | 8 (40.0%) |
| Public Administration | 20 (54.0%) | 17 (46.0%) |
| Total | 785 (53.9%) | 672 (46.1%) |
Education in Hidden Meadows
School Enrollment in Hidden Meadows
The most common levels of schooling among the 341 students in Hidden Meadows are college / undergraduate (184 | 54.0%), middle school (78 | 22.9%), and high school (45 | 13.2%).
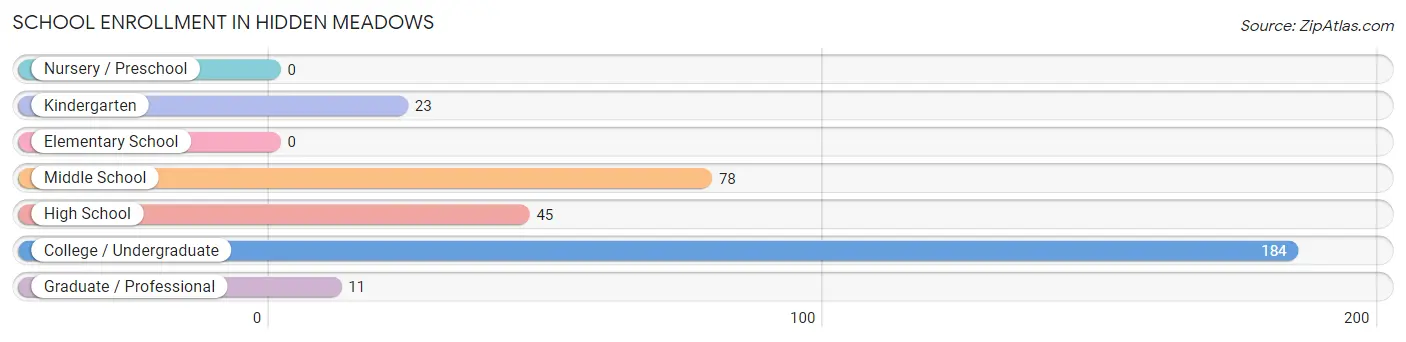
| School Level | # Students | % Students |
| Nursery / Preschool | 0 | 0.0% |
| Kindergarten | 23 | 6.7% |
| Elementary School | 0 | 0.0% |
| Middle School | 78 | 22.9% |
| High School | 45 | 13.2% |
| College / Undergraduate | 184 | 54.0% |
| Graduate / Professional | 11 | 3.2% |
| Total | 341 | 100.0% |
School Enrollment by Age by Funding Source in Hidden Meadows
Out of a total of 341 students who are enrolled in schools in Hidden Meadows, 41 (12.0%) attend a private institution, while the remaining 300 (88.0%) are enrolled in public schools. The age group of 20 to 24 year olds has the highest likelihood of being enrolled in private schools, with 41 (38.3% in the age bracket) enrolled. Conversely, the age group of 5 to 9 year old has the lowest likelihood of being enrolled in a private school, with 23 (100.0% in the age bracket) attending a public institution.
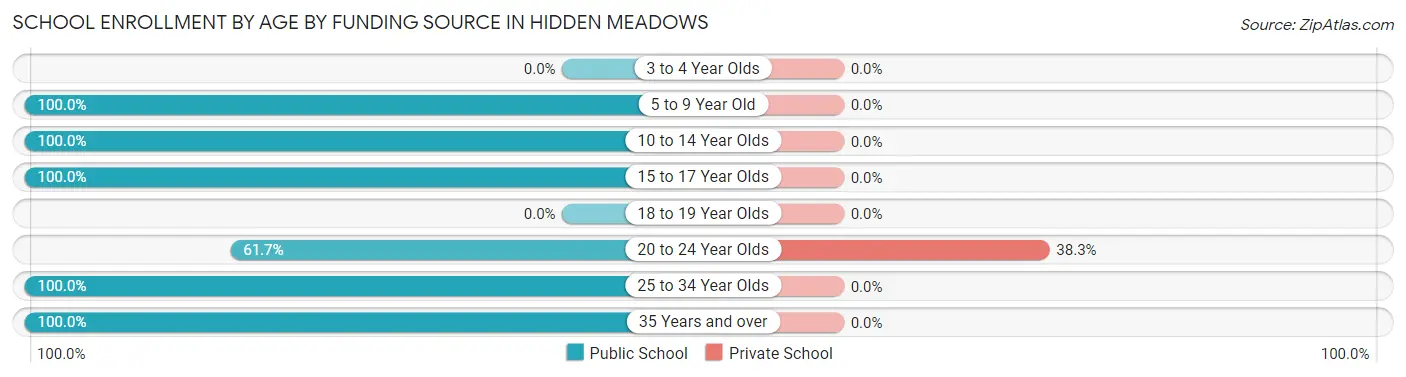
| Age Bracket | Public School | Private School |
| 3 to 4 Year Olds | 0 (0.0%) | 0 (0.0%) |
| 5 to 9 Year Old | 23 (100.0%) | 0 (0.0%) |
| 10 to 14 Year Olds | 78 (100.0%) | 0 (0.0%) |
| 15 to 17 Year Olds | 45 (100.0%) | 0 (0.0%) |
| 18 to 19 Year Olds | 0 (0.0%) | 0 (0.0%) |
| 20 to 24 Year Olds | 66 (61.7%) | 41 (38.3%) |
| 25 to 34 Year Olds | 34 (100.0%) | 0 (0.0%) |
| 35 Years and over | 54 (100.0%) | 0 (0.0%) |
| Total | 300 (88.0%) | 41 (12.0%) |
Educational Attainment by Field of Study in Hidden Meadows
Business (370 | 25.8%), arts & humanities (144 | 10.1%), social sciences (123 | 8.6%), science & technology (115 | 8.0%), and literature & languages (96 | 6.7%) are the most common fields of study among 1,432 individuals in Hidden Meadows who have obtained a bachelor's degree or higher.
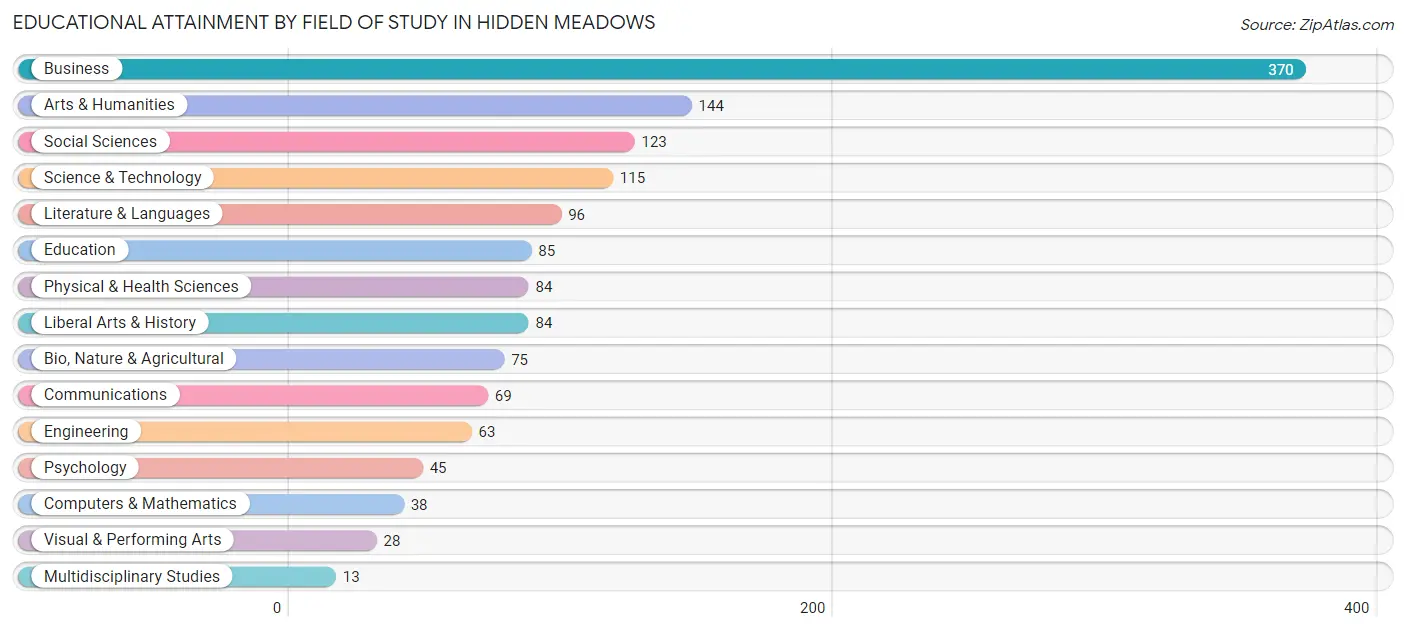
| Field of Study | # Graduates | % Graduates |
| Computers & Mathematics | 38 | 2.6% |
| Bio, Nature & Agricultural | 75 | 5.2% |
| Physical & Health Sciences | 84 | 5.9% |
| Psychology | 45 | 3.1% |
| Social Sciences | 123 | 8.6% |
| Engineering | 63 | 4.4% |
| Multidisciplinary Studies | 13 | 0.9% |
| Science & Technology | 115 | 8.0% |
| Business | 370 | 25.8% |
| Education | 85 | 5.9% |
| Literature & Languages | 96 | 6.7% |
| Liberal Arts & History | 84 | 5.9% |
| Visual & Performing Arts | 28 | 2.0% |
| Communications | 69 | 4.8% |
| Arts & Humanities | 144 | 10.1% |
| Total | 1,432 | 100.0% |
Transportation & Commute in Hidden Meadows
Vehicle Availability by Sex in Hidden Meadows
The most prevalent vehicle ownership categories in Hidden Meadows are males with 2 vehicles (400, accounting for 52.5%) and females with 2 vehicles (387, making up 58.2%).
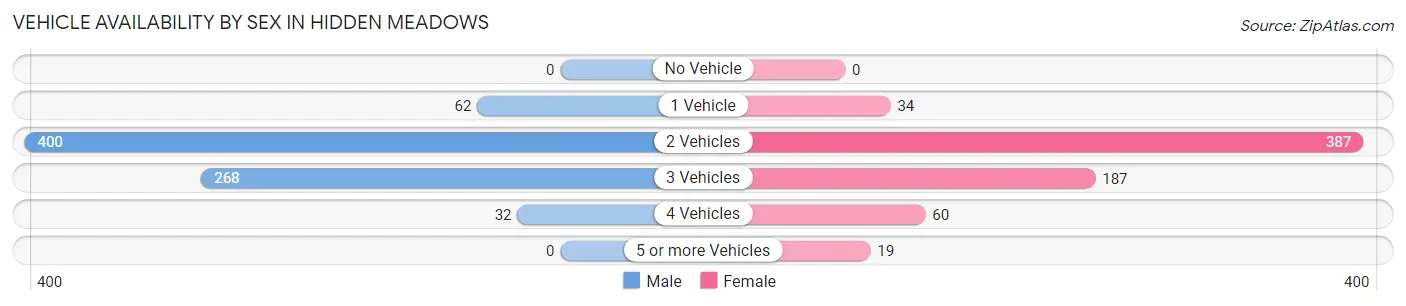
| Vehicles Available | Male | Female |
| No Vehicle | 0 (0.0%) | 0 (0.0%) |
| 1 Vehicle | 62 (8.1%) | 34 (5.0%) |
| 2 Vehicles | 400 (52.5%) | 387 (56.3%) |
| 3 Vehicles | 268 (35.2%) | 187 (27.2%) |
| 4 Vehicles | 32 (4.2%) | 60 (8.7%) |
| 5 or more Vehicles | 0 (0.0%) | 19 (2.8%) |
| Total | 762 (100.0%) | 687 (100.0%) |
Commute Time in Hidden Meadows
The most frequently occuring commute durations in Hidden Meadows are 30 to 34 minutes (267 commuters, 19.9%), 45 to 59 minutes (231 commuters, 17.2%), and 15 to 19 minutes (162 commuters, 12.0%).
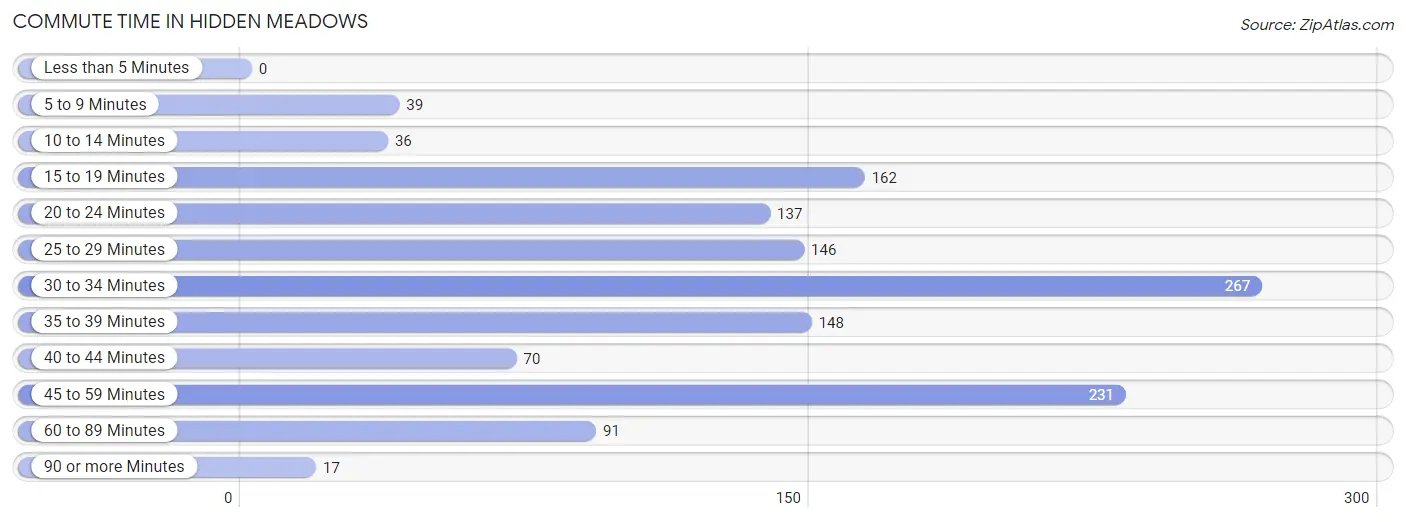
| Commute Time | # Commuters | % Commuters |
| Less than 5 Minutes | 0 | 0.0% |
| 5 to 9 Minutes | 39 | 2.9% |
| 10 to 14 Minutes | 36 | 2.7% |
| 15 to 19 Minutes | 162 | 12.0% |
| 20 to 24 Minutes | 137 | 10.2% |
| 25 to 29 Minutes | 146 | 10.9% |
| 30 to 34 Minutes | 267 | 19.9% |
| 35 to 39 Minutes | 148 | 11.0% |
| 40 to 44 Minutes | 70 | 5.2% |
| 45 to 59 Minutes | 231 | 17.2% |
| 60 to 89 Minutes | 91 | 6.8% |
| 90 or more Minutes | 17 | 1.3% |
Commute Time by Sex in Hidden Meadows
The most common commute times in Hidden Meadows are 30 to 34 minutes (176 commuters, 24.2%) for males and 25 to 29 minutes (146 commuters, 23.7%) for females.
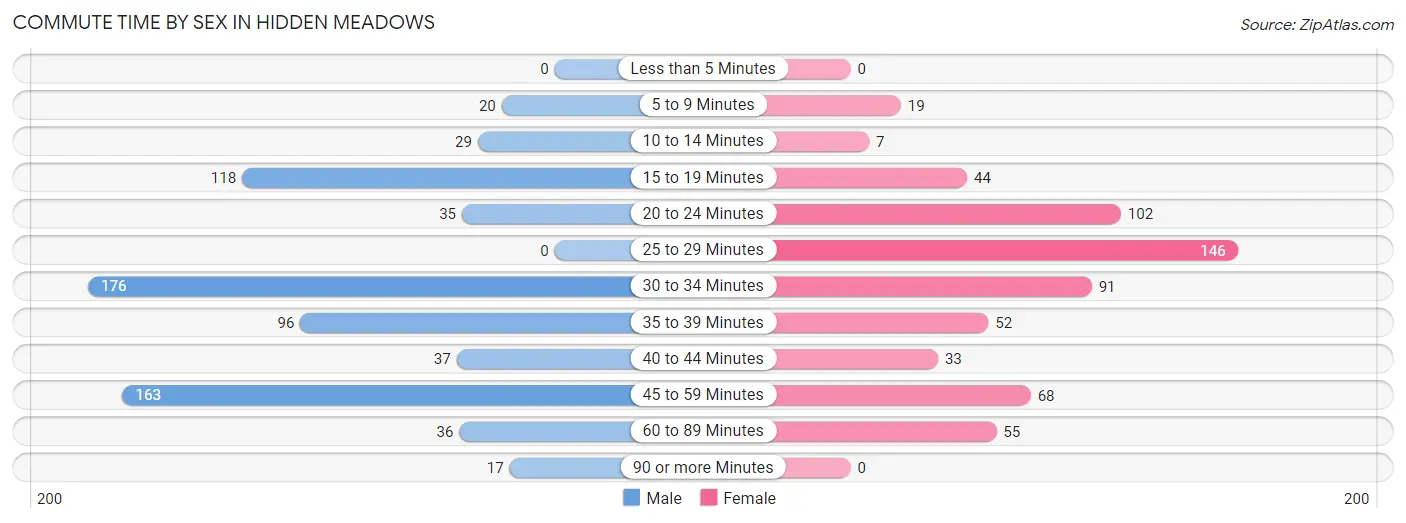
| Commute Time | Male | Female |
| Less than 5 Minutes | 0 (0.0%) | 0 (0.0%) |
| 5 to 9 Minutes | 20 (2.8%) | 19 (3.1%) |
| 10 to 14 Minutes | 29 (4.0%) | 7 (1.1%) |
| 15 to 19 Minutes | 118 (16.2%) | 44 (7.1%) |
| 20 to 24 Minutes | 35 (4.8%) | 102 (16.5%) |
| 25 to 29 Minutes | 0 (0.0%) | 146 (23.7%) |
| 30 to 34 Minutes | 176 (24.2%) | 91 (14.7%) |
| 35 to 39 Minutes | 96 (13.2%) | 52 (8.4%) |
| 40 to 44 Minutes | 37 (5.1%) | 33 (5.3%) |
| 45 to 59 Minutes | 163 (22.4%) | 68 (11.0%) |
| 60 to 89 Minutes | 36 (5.0%) | 55 (8.9%) |
| 90 or more Minutes | 17 (2.3%) | 0 (0.0%) |
Time of Departure to Work by Sex in Hidden Meadows
The most frequent times of departure to work in Hidden Meadows are 7:00 AM to 7:29 AM (142, 19.5%) for males and 7:30 AM to 7:59 AM (97, 15.7%) for females.
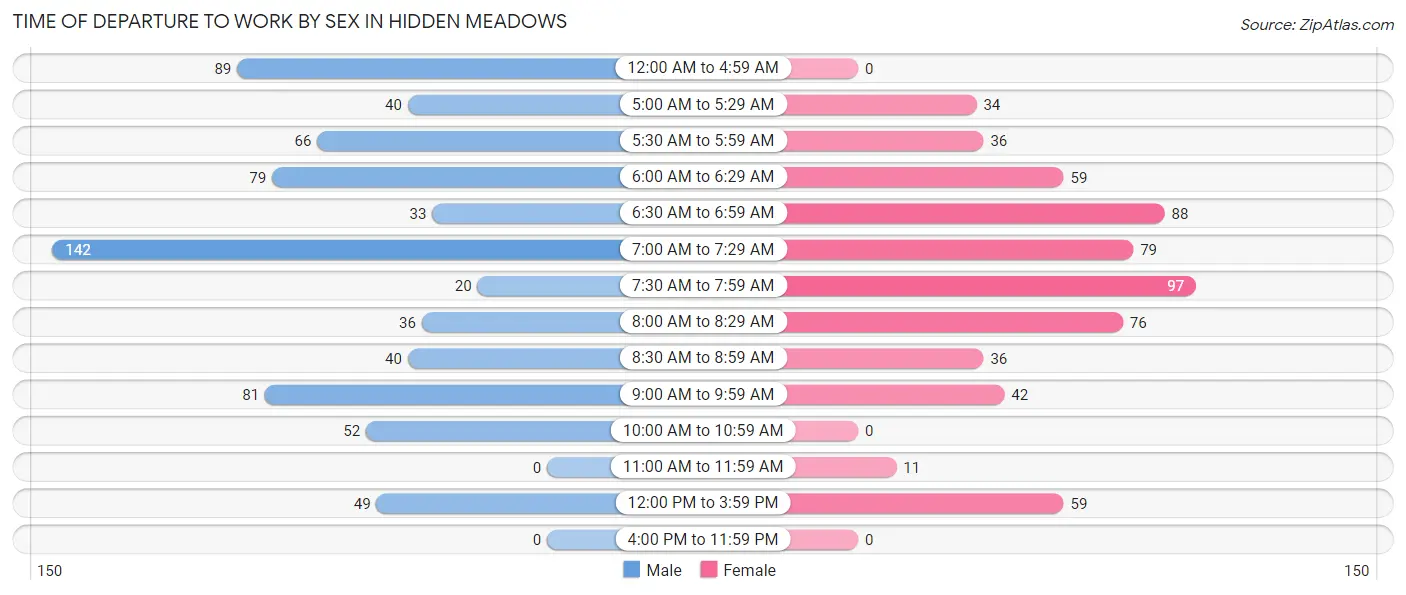
| Time of Departure | Male | Female |
| 12:00 AM to 4:59 AM | 89 (12.2%) | 0 (0.0%) |
| 5:00 AM to 5:29 AM | 40 (5.5%) | 34 (5.5%) |
| 5:30 AM to 5:59 AM | 66 (9.1%) | 36 (5.8%) |
| 6:00 AM to 6:29 AM | 79 (10.9%) | 59 (9.6%) |
| 6:30 AM to 6:59 AM | 33 (4.5%) | 88 (14.3%) |
| 7:00 AM to 7:29 AM | 142 (19.5%) | 79 (12.8%) |
| 7:30 AM to 7:59 AM | 20 (2.8%) | 97 (15.7%) |
| 8:00 AM to 8:29 AM | 36 (5.0%) | 76 (12.3%) |
| 8:30 AM to 8:59 AM | 40 (5.5%) | 36 (5.8%) |
| 9:00 AM to 9:59 AM | 81 (11.1%) | 42 (6.8%) |
| 10:00 AM to 10:59 AM | 52 (7.1%) | 0 (0.0%) |
| 11:00 AM to 11:59 AM | 0 (0.0%) | 11 (1.8%) |
| 12:00 PM to 3:59 PM | 49 (6.7%) | 59 (9.6%) |
| 4:00 PM to 11:59 PM | 0 (0.0%) | 0 (0.0%) |
| Total | 727 (100.0%) | 617 (100.0%) |
Housing Occupancy in Hidden Meadows
Occupancy by Ownership in Hidden Meadows
Of the total 1,679 dwellings in Hidden Meadows, owner-occupied units account for 1,605 (95.6%), while renter-occupied units make up 74 (4.4%).
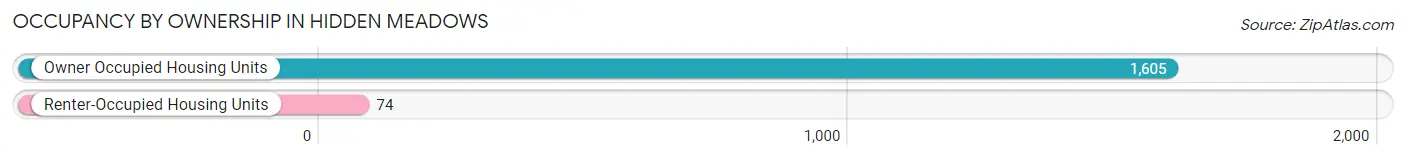
| Occupancy | # Housing Units | % Housing Units |
| Owner Occupied Housing Units | 1,605 | 95.6% |
| Renter-Occupied Housing Units | 74 | 4.4% |
| Total Occupied Housing Units | 1,679 | 100.0% |
Occupancy by Household Size in Hidden Meadows
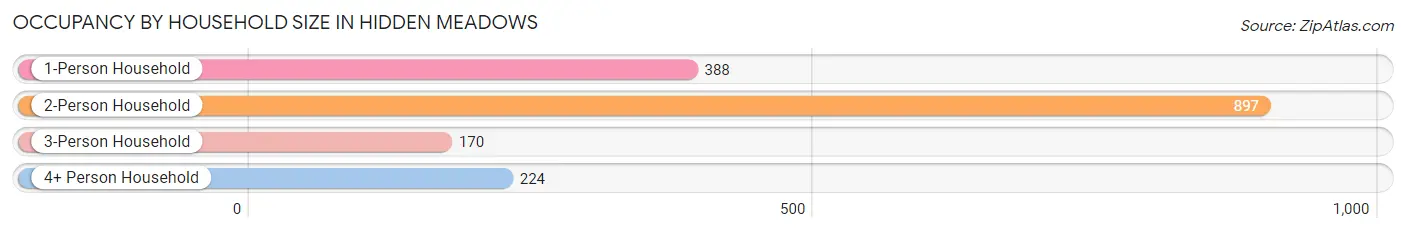
| Household Size | # Housing Units | % Housing Units |
| 1-Person Household | 388 | 23.1% |
| 2-Person Household | 897 | 53.4% |
| 3-Person Household | 170 | 10.1% |
| 4+ Person Household | 224 | 13.3% |
| Total Housing Units | 1,679 | 100.0% |
Occupancy by Ownership by Household Size in Hidden Meadows
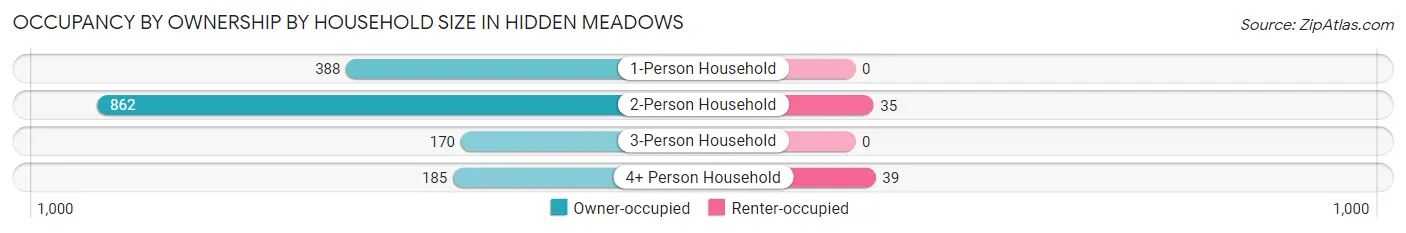
| Household Size | Owner-occupied | Renter-occupied |
| 1-Person Household | 388 (100.0%) | 0 (0.0%) |
| 2-Person Household | 862 (96.1%) | 35 (3.9%) |
| 3-Person Household | 170 (100.0%) | 0 (0.0%) |
| 4+ Person Household | 185 (82.6%) | 39 (17.4%) |
| Total Housing Units | 1,605 (95.6%) | 74 (4.4%) |
Occupancy by Educational Attainment in Hidden Meadows
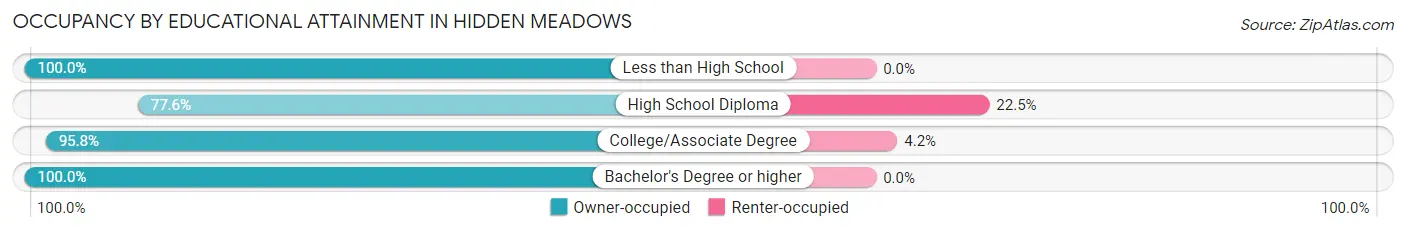
| Household Size | Owner-occupied | Renter-occupied |
| Less than High School | 51 (100.0%) | 0 (0.0%) |
| High School Diploma | 152 (77.5%) | 44 (22.5%) |
| College/Associate Degree | 686 (95.8%) | 30 (4.2%) |
| Bachelor's Degree or higher | 716 (100.0%) | 0 (0.0%) |
Occupancy by Age of Householder in Hidden Meadows
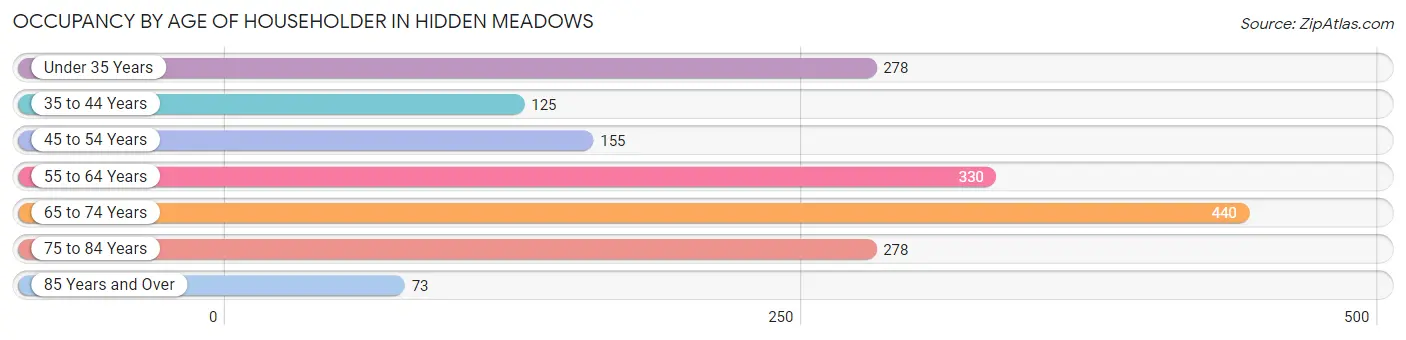
| Age Bracket | # Households | % Households |
| Under 35 Years | 278 | 16.6% |
| 35 to 44 Years | 125 | 7.4% |
| 45 to 54 Years | 155 | 9.2% |
| 55 to 64 Years | 330 | 19.7% |
| 65 to 74 Years | 440 | 26.2% |
| 75 to 84 Years | 278 | 16.6% |
| 85 Years and Over | 73 | 4.3% |
| Total | 1,679 | 100.0% |
Housing Finances in Hidden Meadows
Median Income by Occupancy in Hidden Meadows
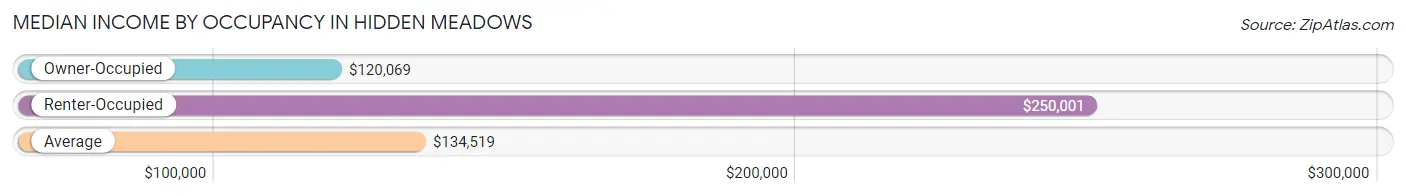
| Occupancy Type | # Households | Median Income |
| Owner-Occupied | 1,605 (95.6%) | $120,069 |
| Renter-Occupied | 74 (4.4%) | $250,001 |
| Average | 1,679 (100.0%) | $134,519 |
Occupancy by Householder Income Bracket in Hidden Meadows
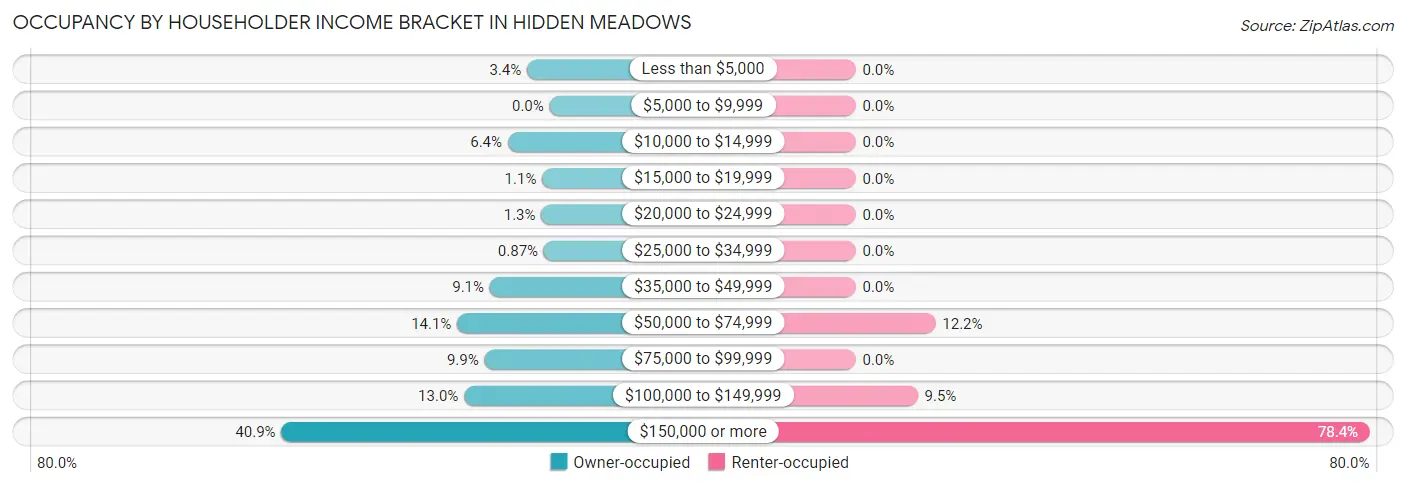
| Income Bracket | Owner-occupied | Renter-occupied |
| Less than $5,000 | 55 (3.4%) | 0 (0.0%) |
| $5,000 to $9,999 | 0 (0.0%) | 0 (0.0%) |
| $10,000 to $14,999 | 102 (6.4%) | 0 (0.0%) |
| $15,000 to $19,999 | 18 (1.1%) | 0 (0.0%) |
| $20,000 to $24,999 | 20 (1.3%) | 0 (0.0%) |
| $25,000 to $34,999 | 14 (0.9%) | 0 (0.0%) |
| $35,000 to $49,999 | 146 (9.1%) | 0 (0.0%) |
| $50,000 to $74,999 | 226 (14.1%) | 9 (12.2%) |
| $75,000 to $99,999 | 159 (9.9%) | 0 (0.0%) |
| $100,000 to $149,999 | 209 (13.0%) | 7 (9.5%) |
| $150,000 or more | 656 (40.9%) | 58 (78.4%) |
| Total | 1,605 (100.0%) | 74 (100.0%) |
Monthly Housing Cost Tiers in Hidden Meadows
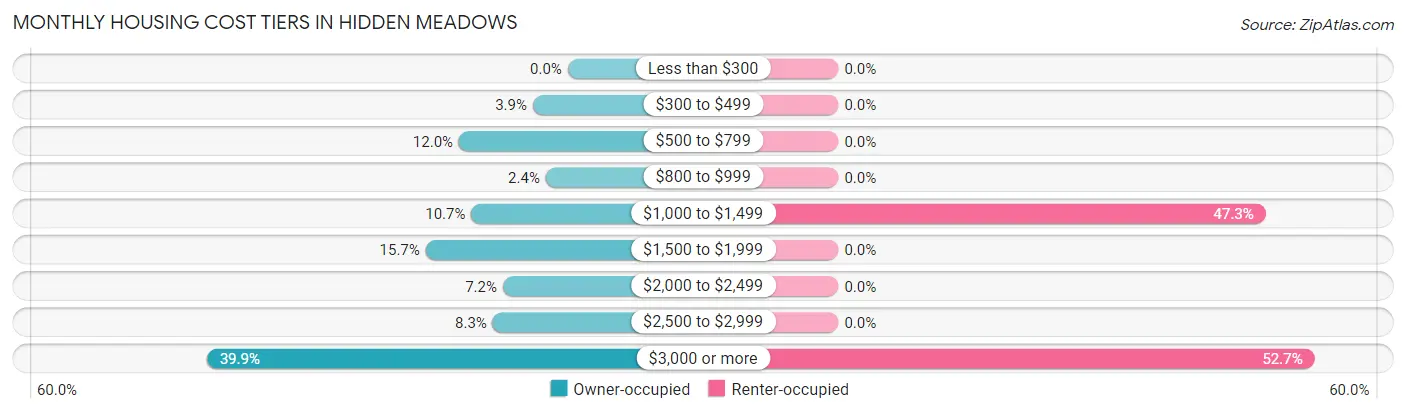
| Monthly Cost | Owner-occupied | Renter-occupied |
| Less than $300 | 0 (0.0%) | 0 (0.0%) |
| $300 to $499 | 62 (3.9%) | 0 (0.0%) |
| $500 to $799 | 193 (12.0%) | 0 (0.0%) |
| $800 to $999 | 39 (2.4%) | 0 (0.0%) |
| $1,000 to $1,499 | 171 (10.6%) | 35 (47.3%) |
| $1,500 to $1,999 | 252 (15.7%) | 0 (0.0%) |
| $2,000 to $2,499 | 115 (7.2%) | 0 (0.0%) |
| $2,500 to $2,999 | 133 (8.3%) | 0 (0.0%) |
| $3,000 or more | 640 (39.9%) | 39 (52.7%) |
| Total | 1,605 (100.0%) | 74 (100.0%) |
Physical Housing Characteristics in Hidden Meadows
Housing Structures in Hidden Meadows
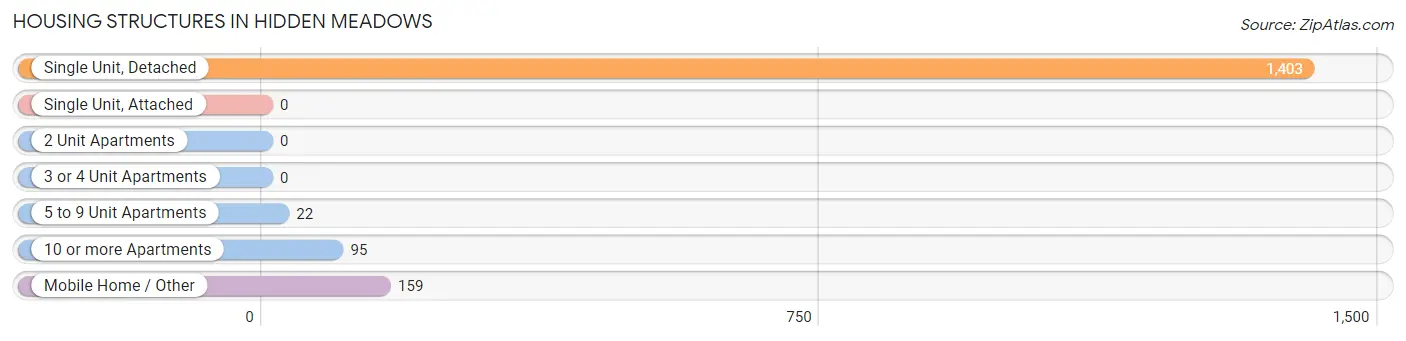
| Structure Type | # Housing Units | % Housing Units |
| Single Unit, Detached | 1,403 | 83.6% |
| Single Unit, Attached | 0 | 0.0% |
| 2 Unit Apartments | 0 | 0.0% |
| 3 or 4 Unit Apartments | 0 | 0.0% |
| 5 to 9 Unit Apartments | 22 | 1.3% |
| 10 or more Apartments | 95 | 5.7% |
| Mobile Home / Other | 159 | 9.5% |
| Total | 1,679 | 100.0% |
Housing Structures by Occupancy in Hidden Meadows
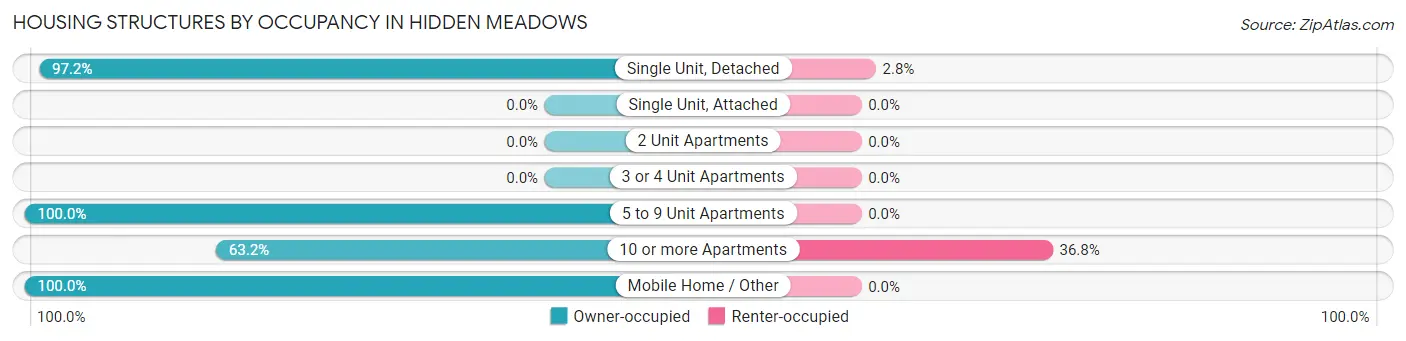
| Structure Type | Owner-occupied | Renter-occupied |
| Single Unit, Detached | 1,364 (97.2%) | 39 (2.8%) |
| Single Unit, Attached | 0 (0.0%) | 0 (0.0%) |
| 2 Unit Apartments | 0 (0.0%) | 0 (0.0%) |
| 3 or 4 Unit Apartments | 0 (0.0%) | 0 (0.0%) |
| 5 to 9 Unit Apartments | 22 (100.0%) | 0 (0.0%) |
| 10 or more Apartments | 60 (63.2%) | 35 (36.8%) |
| Mobile Home / Other | 159 (100.0%) | 0 (0.0%) |
| Total | 1,605 (95.6%) | 74 (4.4%) |
Housing Structures by Number of Rooms in Hidden Meadows
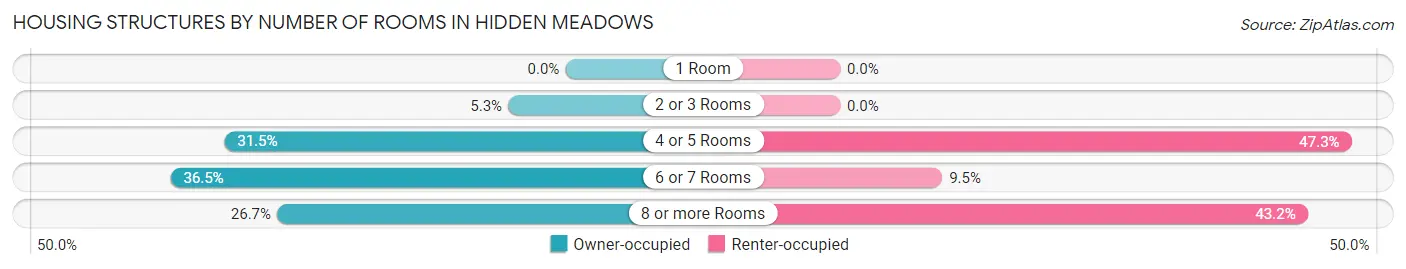
| Number of Rooms | Owner-occupied | Renter-occupied |
| 1 Room | 0 (0.0%) | 0 (0.0%) |
| 2 or 3 Rooms | 85 (5.3%) | 0 (0.0%) |
| 4 or 5 Rooms | 506 (31.5%) | 35 (47.3%) |
| 6 or 7 Rooms | 586 (36.5%) | 7 (9.5%) |
| 8 or more Rooms | 428 (26.7%) | 32 (43.2%) |
| Total | 1,605 (100.0%) | 74 (100.0%) |
Housing Structure by Heating Type in Hidden Meadows
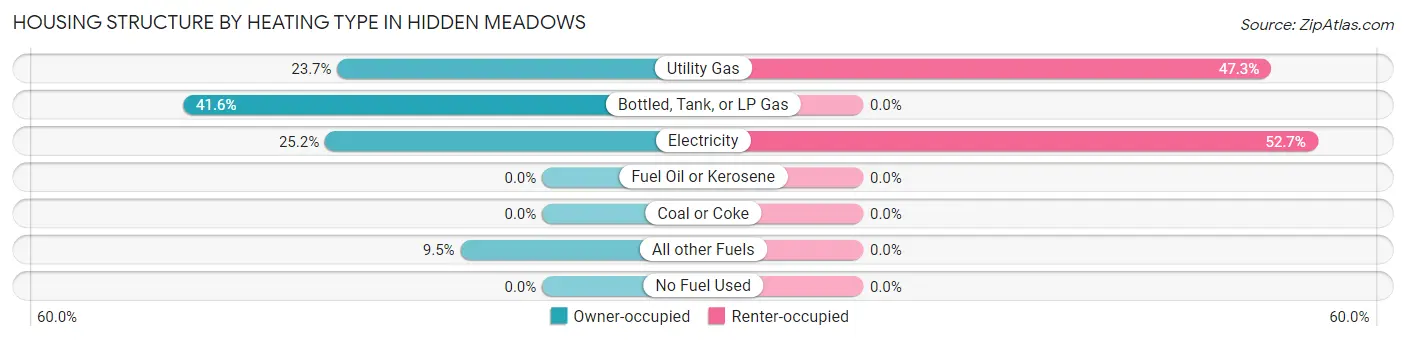
| Heating Type | Owner-occupied | Renter-occupied |
| Utility Gas | 381 (23.7%) | 35 (47.3%) |
| Bottled, Tank, or LP Gas | 668 (41.6%) | 0 (0.0%) |
| Electricity | 404 (25.2%) | 39 (52.7%) |
| Fuel Oil or Kerosene | 0 (0.0%) | 0 (0.0%) |
| Coal or Coke | 0 (0.0%) | 0 (0.0%) |
| All other Fuels | 152 (9.5%) | 0 (0.0%) |
| No Fuel Used | 0 (0.0%) | 0 (0.0%) |
| Total | 1,605 (100.0%) | 74 (100.0%) |
Household Vehicle Usage in Hidden Meadows
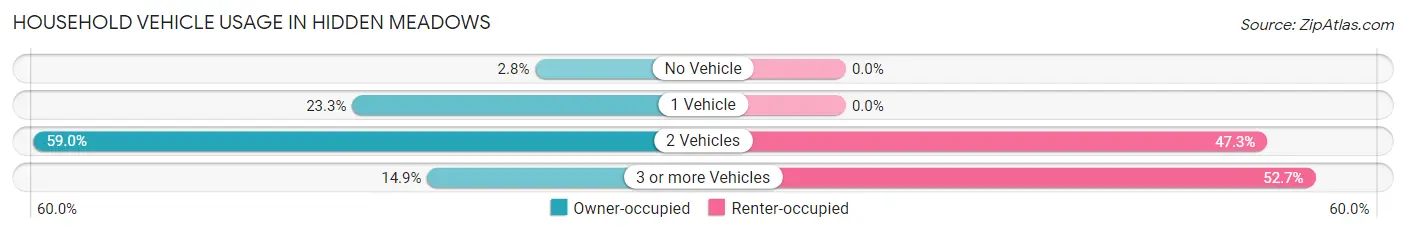
| Vehicles per Household | Owner-occupied | Renter-occupied |
| No Vehicle | 45 (2.8%) | 0 (0.0%) |
| 1 Vehicle | 374 (23.3%) | 0 (0.0%) |
| 2 Vehicles | 947 (59.0%) | 35 (47.3%) |
| 3 or more Vehicles | 239 (14.9%) | 39 (52.7%) |
| Total | 1,605 (100.0%) | 74 (100.0%) |
Real Estate & Mortgages in Hidden Meadows
Real Estate and Mortgage Overview in Hidden Meadows
| Characteristic | Without Mortgage | With Mortgage |
| Housing Units | 498 | 1,107 |
| Median Property Value | $716,900 | $759,200 |
| Median Household Income | $46,715 | $572 |
| Monthly Housing Costs | $850 | $640 |
| Real Estate Taxes | $4,877 | $30 |
Property Value by Mortgage Status in Hidden Meadows
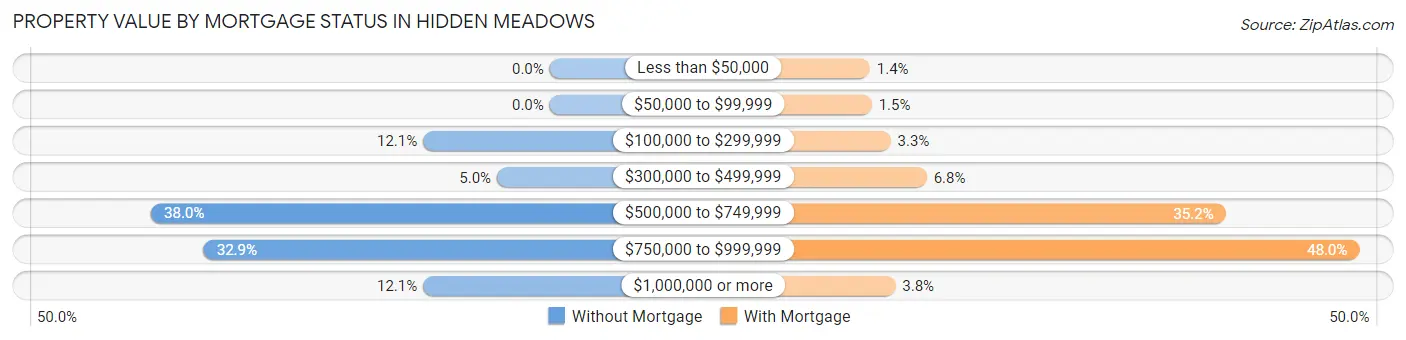
| Property Value | Without Mortgage | With Mortgage |
| Less than $50,000 | 0 (0.0%) | 15 (1.4%) |
| $50,000 to $99,999 | 0 (0.0%) | 17 (1.5%) |
| $100,000 to $299,999 | 60 (12.0%) | 37 (3.3%) |
| $300,000 to $499,999 | 25 (5.0%) | 75 (6.8%) |
| $500,000 to $749,999 | 189 (38.0%) | 390 (35.2%) |
| $750,000 to $999,999 | 164 (32.9%) | 531 (48.0%) |
| $1,000,000 or more | 60 (12.0%) | 42 (3.8%) |
| Total | 498 (100.0%) | 1,107 (100.0%) |
Household Income by Mortgage Status in Hidden Meadows
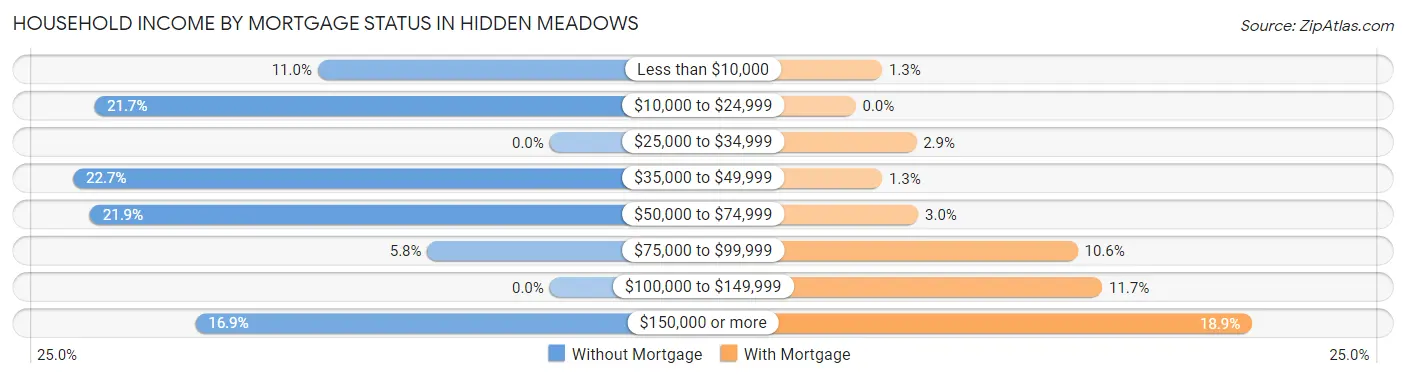
| Household Income | Without Mortgage | With Mortgage |
| Less than $10,000 | 55 (11.0%) | 14 (1.3%) |
| $10,000 to $24,999 | 108 (21.7%) | 0 (0.0%) |
| $25,000 to $34,999 | 0 (0.0%) | 32 (2.9%) |
| $35,000 to $49,999 | 113 (22.7%) | 14 (1.3%) |
| $50,000 to $74,999 | 109 (21.9%) | 33 (3.0%) |
| $75,000 to $99,999 | 29 (5.8%) | 117 (10.6%) |
| $100,000 to $149,999 | 0 (0.0%) | 130 (11.7%) |
| $150,000 or more | 84 (16.9%) | 209 (18.9%) |
| Total | 498 (100.0%) | 1,107 (100.0%) |
Property Value to Household Income Ratio in Hidden Meadows
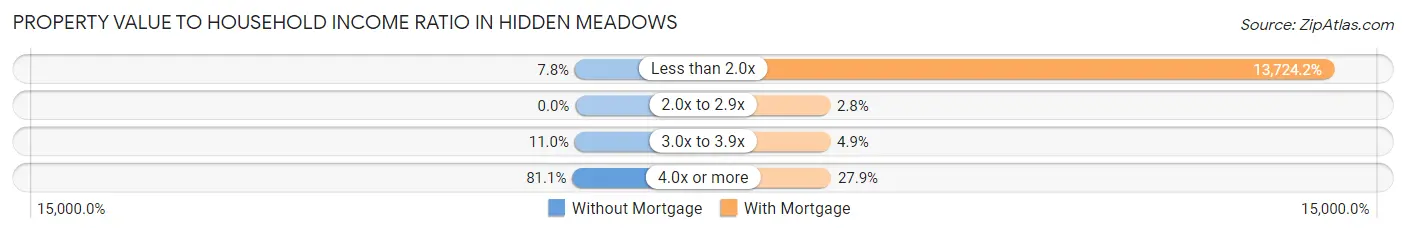
| Value-to-Income Ratio | Without Mortgage | With Mortgage |
| Less than 2.0x | 39 (7.8%) | 151,927 (13,724.2%) |
| 2.0x to 2.9x | 0 (0.0%) | 31 (2.8%) |
| 3.0x to 3.9x | 55 (11.0%) | 54 (4.9%) |
| 4.0x or more | 404 (81.1%) | 309 (27.9%) |
| Total | 498 (100.0%) | 1,107 (100.0%) |
Real Estate Taxes by Mortgage Status in Hidden Meadows
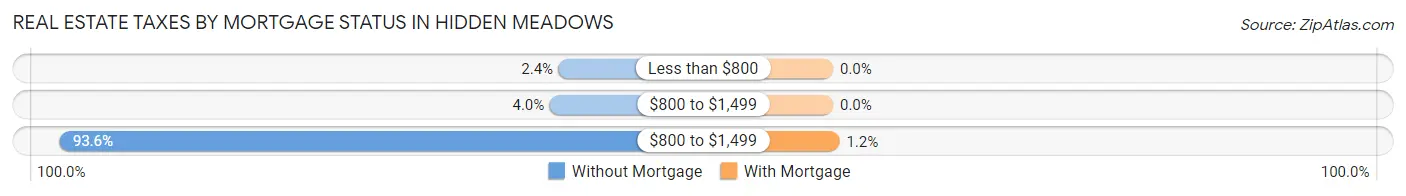
| Property Taxes | Without Mortgage | With Mortgage |
| Less than $800 | 12 (2.4%) | 0 (0.0%) |
| $800 to $1,499 | 20 (4.0%) | 0 (0.0%) |
| $800 to $1,499 | 466 (93.6%) | 13 (1.2%) |
| Total | 498 (100.0%) | 1,107 (100.0%) |
Health & Disability in Hidden Meadows
Health Insurance Coverage by Age in Hidden Meadows
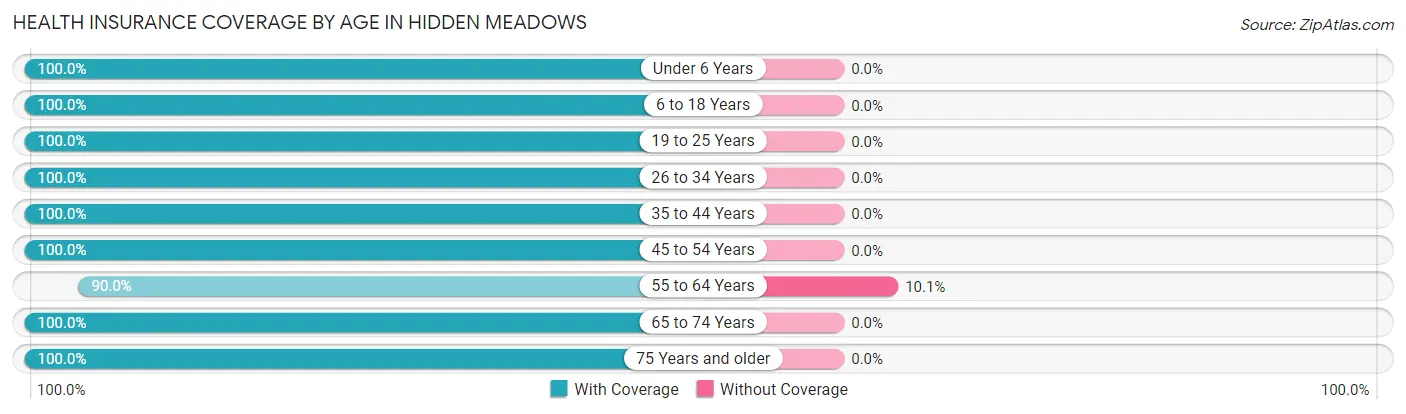
| Age Bracket | With Coverage | Without Coverage |
| Under 6 Years | 303 (100.0%) | 0 (0.0%) |
| 6 to 18 Years | 123 (100.0%) | 0 (0.0%) |
| 19 to 25 Years | 203 (100.0%) | 0 (0.0%) |
| 26 to 34 Years | 412 (100.0%) | 0 (0.0%) |
| 35 to 44 Years | 357 (100.0%) | 0 (0.0%) |
| 45 to 54 Years | 222 (100.0%) | 0 (0.0%) |
| 55 to 64 Years | 662 (89.9%) | 74 (10.1%) |
| 65 to 74 Years | 720 (100.0%) | 0 (0.0%) |
| 75 Years and older | 607 (100.0%) | 0 (0.0%) |
| Total | 3,609 (98.0%) | 74 (2.0%) |
Health Insurance Coverage by Citizenship Status in Hidden Meadows
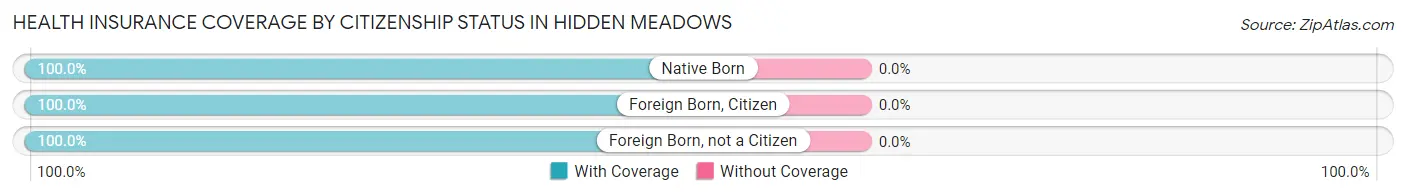
| Citizenship Status | With Coverage | Without Coverage |
| Native Born | 303 (100.0%) | 0 (0.0%) |
| Foreign Born, Citizen | 123 (100.0%) | 0 (0.0%) |
| Foreign Born, not a Citizen | 203 (100.0%) | 0 (0.0%) |
Health Insurance Coverage by Household Income in Hidden Meadows
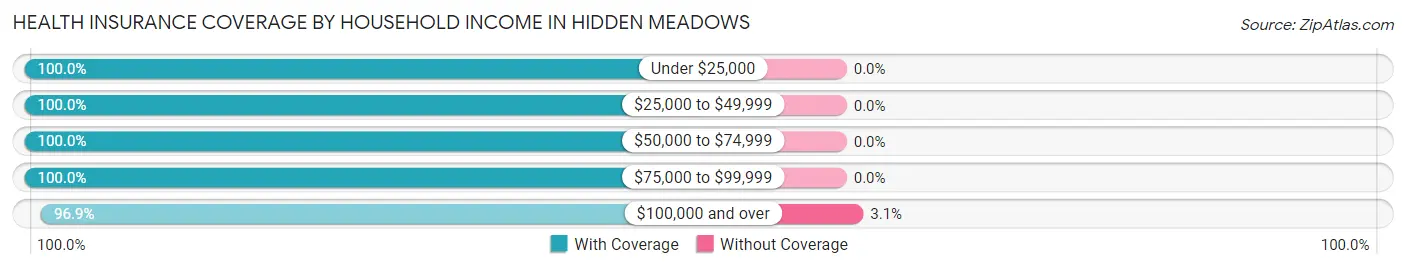
| Household Income | With Coverage | Without Coverage |
| Under $25,000 | 316 (100.0%) | 0 (0.0%) |
| $25,000 to $49,999 | 240 (100.0%) | 0 (0.0%) |
| $50,000 to $74,999 | 445 (100.0%) | 0 (0.0%) |
| $75,000 to $99,999 | 268 (100.0%) | 0 (0.0%) |
| $100,000 and over | 2,312 (96.9%) | 74 (3.1%) |
Public vs Private Health Insurance Coverage by Age in Hidden Meadows
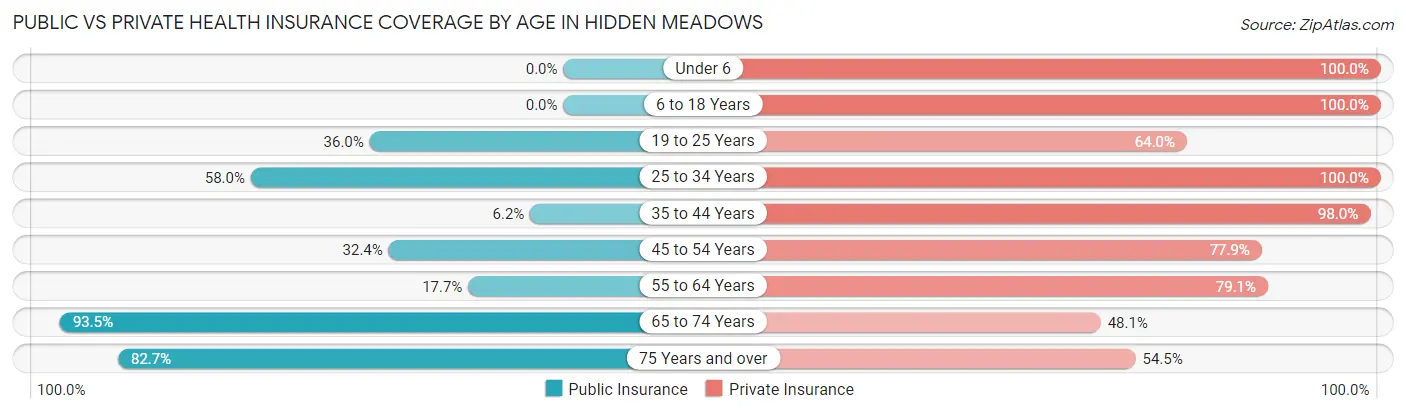
| Age Bracket | Public Insurance | Private Insurance |
| Under 6 | 0 (0.0%) | 303 (100.0%) |
| 6 to 18 Years | 0 (0.0%) | 123 (100.0%) |
| 19 to 25 Years | 73 (36.0%) | 130 (64.0%) |
| 25 to 34 Years | 239 (58.0%) | 412 (100.0%) |
| 35 to 44 Years | 22 (6.2%) | 350 (98.0%) |
| 45 to 54 Years | 72 (32.4%) | 173 (77.9%) |
| 55 to 64 Years | 130 (17.7%) | 582 (79.1%) |
| 65 to 74 Years | 673 (93.5%) | 346 (48.1%) |
| 75 Years and over | 502 (82.7%) | 331 (54.5%) |
| Total | 1,711 (46.5%) | 2,750 (74.7%) |
Disability Status by Sex by Age in Hidden Meadows
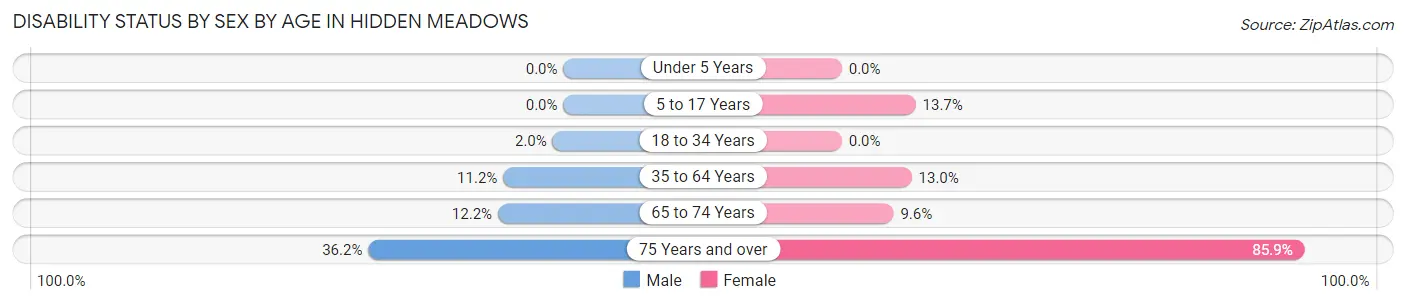
| Age Bracket | Male | Female |
| Under 5 Years | 0 (0.0%) | 0 (0.0%) |
| 5 to 17 Years | 0 (0.0%) | 20 (13.7%) |
| 18 to 34 Years | 8 (2.0%) | 0 (0.0%) |
| 35 to 64 Years | 65 (11.2%) | 95 (13.0%) |
| 65 to 74 Years | 52 (12.1%) | 28 (9.6%) |
| 75 Years and over | 71 (36.2%) | 353 (85.9%) |
Disability Class by Sex by Age in Hidden Meadows
Disability Class: Hearing Difficulty
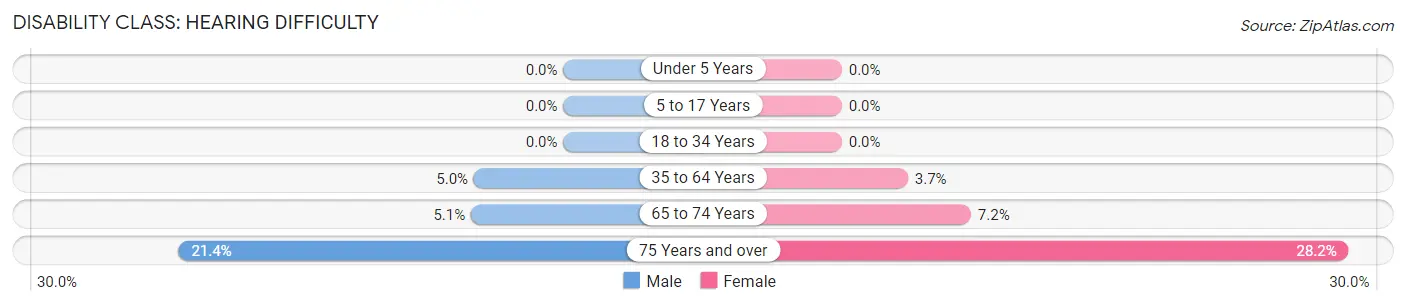
| Age Bracket | Male | Female |
| Under 5 Years | 0 (0.0%) | 0 (0.0%) |
| 5 to 17 Years | 0 (0.0%) | 0 (0.0%) |
| 18 to 34 Years | 0 (0.0%) | 0 (0.0%) |
| 35 to 64 Years | 29 (5.0%) | 27 (3.7%) |
| 65 to 74 Years | 22 (5.1%) | 21 (7.2%) |
| 75 Years and over | 42 (21.4%) | 116 (28.2%) |
Disability Class: Vision Difficulty
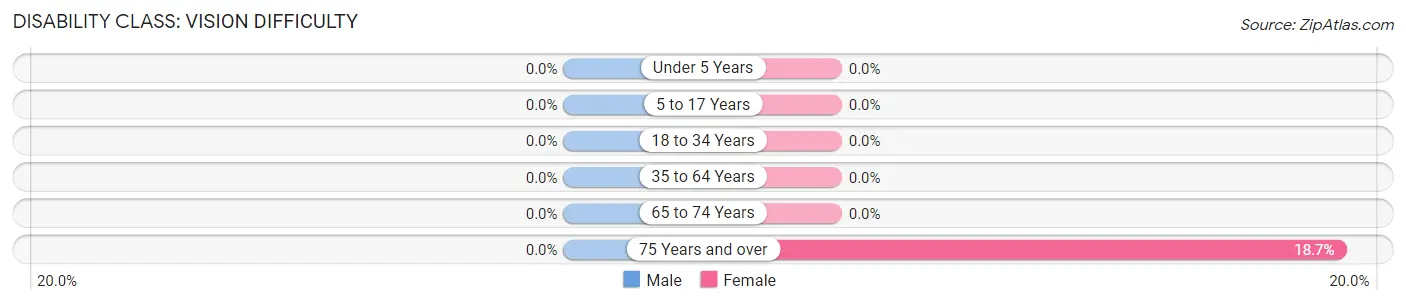
| Age Bracket | Male | Female |
| Under 5 Years | 0 (0.0%) | 0 (0.0%) |
| 5 to 17 Years | 0 (0.0%) | 0 (0.0%) |
| 18 to 34 Years | 0 (0.0%) | 0 (0.0%) |
| 35 to 64 Years | 0 (0.0%) | 0 (0.0%) |
| 65 to 74 Years | 0 (0.0%) | 0 (0.0%) |
| 75 Years and over | 0 (0.0%) | 77 (18.7%) |
Disability Class: Cognitive Difficulty
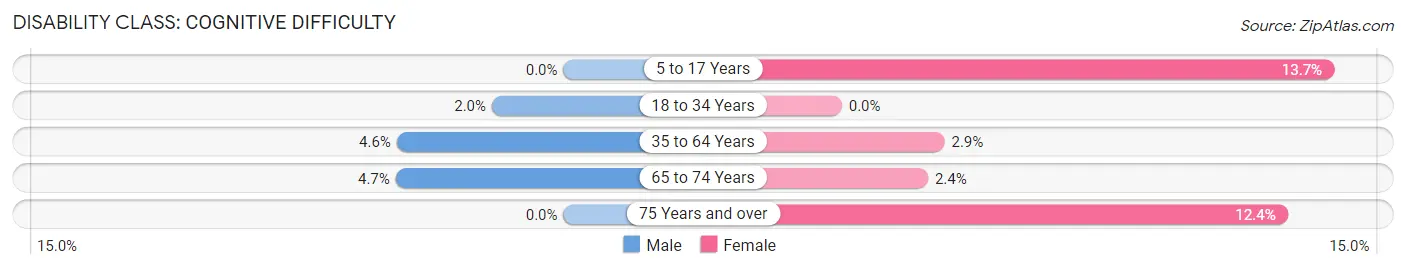
| Age Bracket | Male | Female |
| 5 to 17 Years | 0 (0.0%) | 20 (13.7%) |
| 18 to 34 Years | 8 (2.0%) | 0 (0.0%) |
| 35 to 64 Years | 27 (4.6%) | 21 (2.9%) |
| 65 to 74 Years | 20 (4.7%) | 7 (2.4%) |
| 75 Years and over | 0 (0.0%) | 51 (12.4%) |
Disability Class: Ambulatory Difficulty
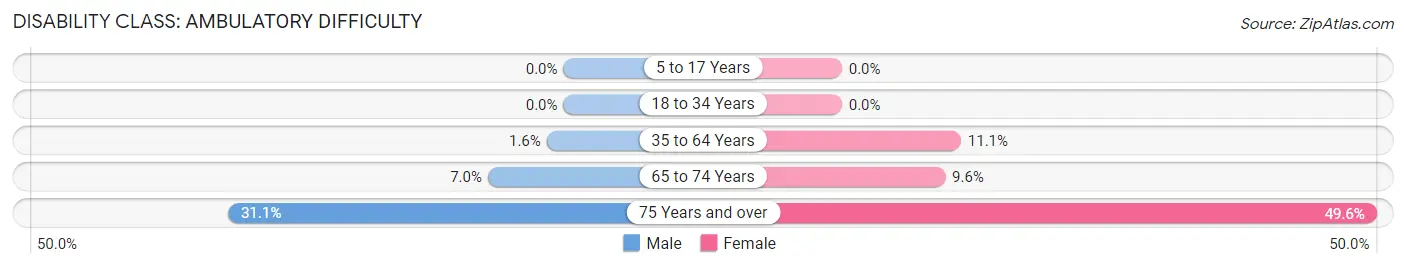
| Age Bracket | Male | Female |
| 5 to 17 Years | 0 (0.0%) | 0 (0.0%) |
| 18 to 34 Years | 0 (0.0%) | 0 (0.0%) |
| 35 to 64 Years | 9 (1.5%) | 81 (11.1%) |
| 65 to 74 Years | 30 (7.0%) | 28 (9.6%) |
| 75 Years and over | 61 (31.1%) | 204 (49.6%) |
Disability Class: Self-Care Difficulty
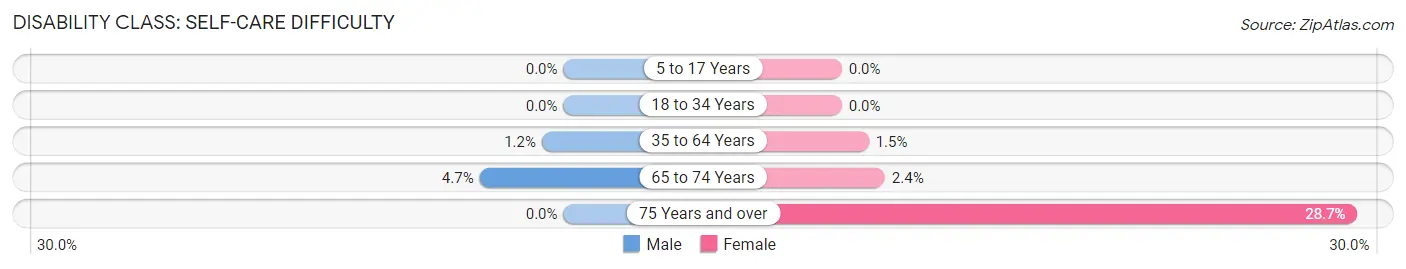
| Age Bracket | Male | Female |
| 5 to 17 Years | 0 (0.0%) | 0 (0.0%) |
| 18 to 34 Years | 0 (0.0%) | 0 (0.0%) |
| 35 to 64 Years | 7 (1.2%) | 11 (1.5%) |
| 65 to 74 Years | 20 (4.7%) | 7 (2.4%) |
| 75 Years and over | 0 (0.0%) | 118 (28.7%) |
Technology Access in Hidden Meadows
Computing Device Access in Hidden Meadows
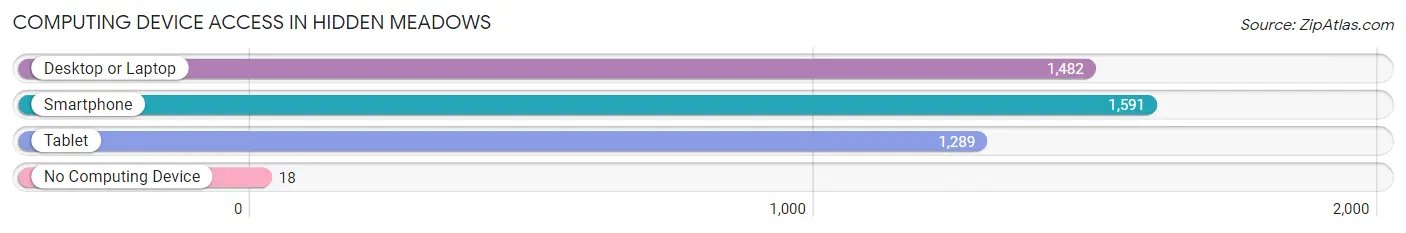
| Device Type | # Households | % Households |
| Desktop or Laptop | 1,482 | 88.3% |
| Smartphone | 1,591 | 94.8% |
| Tablet | 1,289 | 76.8% |
| No Computing Device | 18 | 1.1% |
| Total | 1,679 | 100.0% |
Internet Access in Hidden Meadows
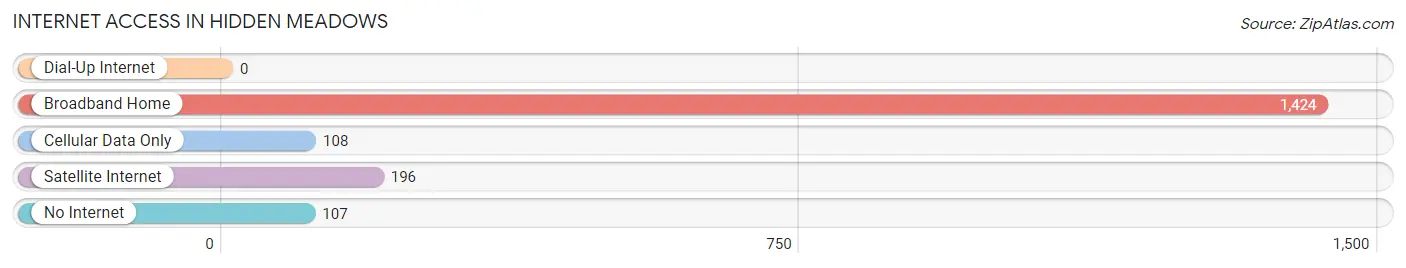
| Internet Type | # Households | % Households |
| Dial-Up Internet | 0 | 0.0% |
| Broadband Home | 1,424 | 84.8% |
| Cellular Data Only | 108 | 6.4% |
| Satellite Internet | 196 | 11.7% |
| No Internet | 107 | 6.4% |
| Total | 1,679 | 100.0% |
Hidden Meadows Summary
Introduction
Hidden Meadows is a small unincorporated community located in San Diego County, California. It is situated in the foothills of the Palomar Mountains, approximately 25 miles northeast of San Diego. The community is home to approximately 1,500 people and is known for its rural atmosphere and scenic views.
History
The area now known as Hidden Meadows was originally inhabited by the Luiseño Indians, who lived in the area for thousands of years before the arrival of Europeans. The first Europeans to settle in the area were Spanish missionaries, who established a mission in nearby San Luis Rey in 1798.
In the late 19th century, the area was settled by ranchers and farmers, who established small ranches and farms in the area. The area was known as “Hidden Valley” until the early 20th century, when the name was changed to “Hidden Meadows”.
In the 1950s, the area began to experience rapid growth as people moved to the area from other parts of California. This growth continued into the 1960s and 1970s, and by the 1980s, the area had become a popular destination for people looking for a rural lifestyle.
Geography
Hidden Meadows is located in the foothills of the Palomar Mountains, approximately 25 miles northeast of San Diego. The area is characterized by rolling hills, oak woodlands, and grassy meadows. The climate is mild, with temperatures ranging from the mid-50s to the mid-80s throughout the year.
The area is home to several parks and recreational areas, including the Palomar Mountain State Park, which offers camping, hiking, and other outdoor activities. The area is also home to several wineries, including the Hidden Meadows Winery, which produces a variety of wines.
Economy
The economy of Hidden Meadows is largely based on agriculture and tourism. The area is home to several farms and ranches, which produce a variety of crops, including avocados, citrus fruits, and olives. The area is also home to several wineries, which produce a variety of wines.
The area is also a popular tourist destination, with visitors coming to the area to enjoy the rural atmosphere and scenic views. The area is home to several bed and breakfasts, as well as several restaurants and shops.
Demographics
As of the 2010 census, the population of Hidden Meadows was 1,521. The population is largely white (90.2%), with smaller percentages of Hispanic (4.2%), Asian (2.2%), and African American (1.2%) residents. The median household income is $76,944, and the median age is 48.
Conclusion
Hidden Meadows is a small unincorporated community located in San Diego County, California. It is situated in the foothills of the Palomar Mountains, approximately 25 miles northeast of San Diego. The area is characterized by rolling hills, oak woodlands, and grassy meadows. The economy of Hidden Meadows is largely based on agriculture and tourism, and the population is largely white. The area is a popular destination for people looking for a rural lifestyle, and offers a variety of outdoor activities, wineries, and other attractions.
Common Questions
What is Per Capita Income in Hidden Meadows?
Per Capita income in Hidden Meadows is $64,708.
What is the Median Family Income in Hidden Meadows?
Median Family Income in Hidden Meadows is $159,023.
What is the Median Household income in Hidden Meadows?
Median Household Income in Hidden Meadows is $134,519.
What is Income or Wage Gap in Hidden Meadows?
Income or Wage Gap in Hidden Meadows is 36.1%.
Women in Hidden Meadows earn 63.9 cents for every dollar earned by a man.
What is Inequality or Gini Index in Hidden Meadows?
Inequality or Gini Index in Hidden Meadows is 0.46.
What is the Total Population of Hidden Meadows?
Total Population of Hidden Meadows is 3,698.
What is the Total Male Population of Hidden Meadows?
Total Male Population of Hidden Meadows is 1,736.
What is the Total Female Population of Hidden Meadows?
Total Female Population of Hidden Meadows is 1,962.
What is the Ratio of Males per 100 Females in Hidden Meadows?
There are 88.48 Males per 100 Females in Hidden Meadows.
What is the Ratio of Females per 100 Males in Hidden Meadows?
There are 113.02 Females per 100 Males in Hidden Meadows.
What is the Median Population Age in Hidden Meadows?
Median Population Age in Hidden Meadows is 58.5 Years.
What is the Average Family Size in Hidden Meadows
Average Family Size in Hidden Meadows is 2.5 People.
What is the Average Household Size in Hidden Meadows
Average Household Size in Hidden Meadows is 2.2 People.
How Large is the Labor Force in Hidden Meadows?
There are 1,775 People in the Labor Forcein in Hidden Meadows.
What is the Percentage of People in the Labor Force in Hidden Meadows?
53.8% of People are in the Labor Force in Hidden Meadows.
What is the Unemployment Rate in Hidden Meadows?
Unemployment Rate in Hidden Meadows is 17.2%.