Cities with the Highest Percentage of Population Employed in Health Technologists in Pennsylvania
RELATED REPORTS & OPTIONS
Health Technologists
Pennsylvania
Compare Cities
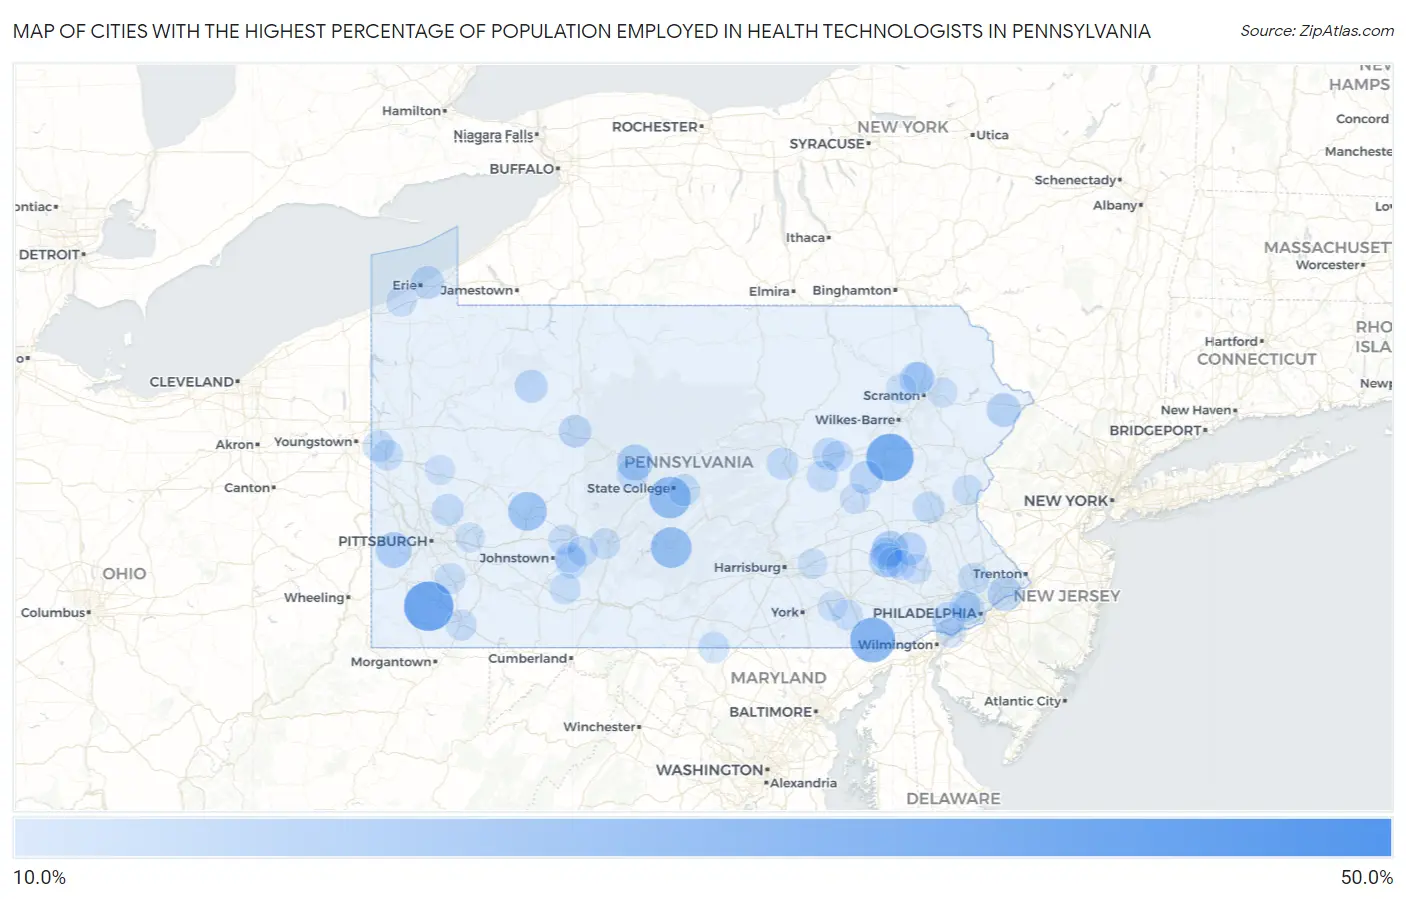
Map of Cities with the Highest Percentage of Population Employed in Health Technologists in Pennsylvania
0.0%
50.0%
Cities with the Highest Percentage of Population Employed in Health Technologists in Pennsylvania
| City | % Employed | vs State | vs National | |
| 1. | Green Hills Borough | 50.0% | 5.0%(+45.0)#1 | 4.3%(+45.7)#46 |
| 2. | Fredericktown | 38.9% | 5.0%(+33.9)#2 | 4.3%(+34.6)#79 |
| 3. | Lattimer | 35.8% | 5.0%(+30.8)#3 | 4.3%(+31.5)#97 |
| 4. | Callimont Borough | 31.8% | 5.0%(+26.8)#4 | 4.3%(+27.5)#138 |
| 5. | Little Britain | 31.7% | 5.0%(+26.6)#5 | 4.3%(+27.4)#141 |
| 6. | Pine Grove Mills | 27.1% | 5.0%(+22.0)#6 | 4.3%(+22.8)#190 |
| 7. | Cedar Crest | 25.9% | 5.0%(+20.9)#7 | 4.3%(+21.6)#208 |
| 8. | Danville Borough | 25.0% | 5.0%(+20.0)#8 | 4.3%(+20.8)#215 |
| 9. | Chevy Chase Heights | 23.0% | 5.0%(+18.0)#9 | 4.3%(+18.7)#265 |
| 10. | Sylvan Hills | 20.1% | 5.0%(+15.1)#10 | 4.3%(+15.8)#360 |
| 11. | Runville | 20.1% | 5.0%(+15.1)#11 | 4.3%(+15.8)#361 |
| 12. | Allport | 19.2% | 5.0%(+14.2)#12 | 4.3%(+14.9)#404 |
| 13. | Bulger | 18.9% | 5.0%(+13.9)#13 | 4.3%(+14.6)#417 |
| 14. | Eldorado | 18.7% | 5.0%(+13.7)#14 | 4.3%(+14.4)#429 |
| 15. | Riverview Park | 18.7% | 5.0%(+13.7)#15 | 4.3%(+14.4)#433 |
| 16. | Sunbrook | 17.5% | 5.0%(+12.5)#16 | 4.3%(+13.3)#488 |
| 17. | Eddington | 17.5% | 5.0%(+12.5)#17 | 4.3%(+13.2)#490 |
| 18. | Fox Chapel Borough | 17.4% | 5.0%(+12.4)#18 | 4.3%(+13.1)#495 |
| 19. | Lincoln Park | 17.2% | 5.0%(+12.2)#19 | 4.3%(+12.9)#508 |
| 20. | Rose Valley Borough | 16.9% | 5.0%(+11.8)#20 | 4.3%(+12.6)#533 |
| 21. | Sunrise Lake | 16.5% | 5.0%(+11.5)#21 | 4.3%(+12.2)#560 |
| 22. | Jennerstown Borough | 16.3% | 5.0%(+11.3)#22 | 4.3%(+12.0)#576 |
| 23. | Manor Borough | 16.1% | 5.0%(+11.1)#23 | 4.3%(+11.8)#597 |
| 24. | Newburg Borough Clearfield County | 16.0% | 5.0%(+11.0)#24 | 4.3%(+11.7)#604 |
| 25. | Glenburn | 15.5% | 5.0%(+10.5)#25 | 4.3%(+11.3)#636 |
| 26. | Brandonville | 15.4% | 5.0%(+10.4)#26 | 4.3%(+11.1)#649 |
| 27. | Lima | 15.4% | 5.0%(+10.3)#27 | 4.3%(+11.1)#656 |
| 28. | Bear Creek Village Borough | 15.3% | 5.0%(+10.3)#28 | 4.3%(+11.1)#661 |
| 29. | Lawrence Park | 14.9% | 5.0%(+9.90)#29 | 4.3%(+10.6)#698 |
| 30. | Marienville | 14.8% | 5.0%(+9.82)#30 | 4.3%(+10.6)#706 |
| 31. | Spring Drive Mobile Home Park | 14.8% | 5.0%(+9.78)#31 | 4.3%(+10.5)#710 |
| 32. | Eagle | 14.5% | 5.0%(+9.51)#32 | 4.3%(+10.3)#745 |
| 33. | Oley | 14.5% | 5.0%(+9.48)#33 | 4.3%(+10.2)#751 |
| 34. | Treasure Lake | 14.5% | 5.0%(+9.46)#34 | 4.3%(+10.2)#755 |
| 35. | Spring Ridge | 14.2% | 5.0%(+9.16)#35 | 4.3%(+9.91)#786 |
| 36. | Penn Farms | 14.1% | 5.0%(+9.03)#36 | 4.3%(+9.78)#808 |
| 37. | Laflin Borough | 14.0% | 5.0%(+8.98)#37 | 4.3%(+9.73)#815 |
| 38. | Buckhorn | 14.0% | 5.0%(+8.92)#38 | 4.3%(+9.67)#820 |
| 39. | Greensboro Borough | 14.0% | 5.0%(+8.92)#39 | 4.3%(+9.67)#821 |
| 40. | Boalsburg | 13.7% | 5.0%(+8.65)#40 | 4.3%(+9.39)#867 |
| 41. | Jermyn Borough | 13.6% | 5.0%(+8.58)#41 | 4.3%(+9.32)#880 |
| 42. | Frizzleburg | 13.6% | 5.0%(+8.53)#42 | 4.3%(+9.27)#888 |
| 43. | Dilworthtown | 13.5% | 5.0%(+8.52)#43 | 4.3%(+9.26)#890 |
| 44. | Linntown | 13.5% | 5.0%(+8.50)#44 | 4.3%(+9.24)#894 |
| 45. | Orrstown Borough | 13.5% | 5.0%(+8.48)#45 | 4.3%(+9.23)#895 |
| 46. | Schnecksville | 13.4% | 5.0%(+8.41)#46 | 4.3%(+9.16)#906 |
| 47. | Curtisville | 13.4% | 5.0%(+8.39)#47 | 4.3%(+9.13)#910 |
| 48. | Penn Wynne | 13.4% | 5.0%(+8.32)#48 | 4.3%(+9.06)#922 |
| 49. | West Middletown Borough | 13.2% | 5.0%(+8.13)#49 | 4.3%(+8.87)#948 |
| 50. | Salix | 13.1% | 5.0%(+8.12)#50 | 4.3%(+8.86)#951 |
| 51. | Stillwater Borough | 13.1% | 5.0%(+8.05)#51 | 4.3%(+8.80)#959 |
| 52. | Rosemont | 13.1% | 5.0%(+8.03)#52 | 4.3%(+8.78)#966 |
| 53. | Glenmoore | 13.1% | 5.0%(+8.02)#53 | 4.3%(+8.77)#967 |
| 54. | Spring House | 13.0% | 5.0%(+7.95)#54 | 4.3%(+8.69)#978 |
| 55. | South Philipsburg | 13.0% | 5.0%(+7.93)#55 | 4.3%(+8.68)#982 |
| 56. | Oakmont Borough | 12.9% | 5.0%(+7.90)#56 | 4.3%(+8.64)#988 |
| 57. | Chester Heights Borough | 12.9% | 5.0%(+7.90)#57 | 4.3%(+8.64)#989 |
| 58. | Elysburg | 12.9% | 5.0%(+7.89)#58 | 4.3%(+8.64)#990 |
| 59. | Wyomissing Borough | 12.8% | 5.0%(+7.77)#59 | 4.3%(+8.52)#1,015 |
| 60. | Waverly | 12.8% | 5.0%(+7.77)#60 | 4.3%(+8.52)#1,016 |
| 61. | Pen Mar | 12.6% | 5.0%(+7.53)#61 | 4.3%(+8.27)#1,060 |
| 62. | Hazen | 12.5% | 5.0%(+7.47)#62 | 4.3%(+8.21)#1,081 |
| 63. | Ardmore | 12.5% | 5.0%(+7.45)#63 | 4.3%(+8.20)#1,089 |
| 64. | Fellsburg | 12.3% | 5.0%(+7.32)#64 | 4.3%(+8.06)#1,112 |
| 65. | Salona | 12.3% | 5.0%(+7.28)#65 | 4.3%(+8.02)#1,120 |
| 66. | Yatesville Borough | 12.2% | 5.0%(+7.21)#66 | 4.3%(+7.96)#1,127 |
| 67. | Orwigsburg Borough | 12.2% | 5.0%(+7.21)#67 | 4.3%(+7.96)#1,131 |
| 68. | Cairnbrook | 12.2% | 5.0%(+7.21)#68 | 4.3%(+7.95)#1,134 |
| 69. | Riverside Borough | 12.2% | 5.0%(+7.15)#69 | 4.3%(+7.90)#1,142 |
| 70. | Leith Hatfield | 12.2% | 5.0%(+7.14)#70 | 4.3%(+7.88)#1,148 |
| 71. | Espy | 12.1% | 5.0%(+7.09)#71 | 4.3%(+7.84)#1,159 |
| 72. | Eagles Mere Borough | 12.1% | 5.0%(+7.09)#72 | 4.3%(+7.84)#1,162 |
| 73. | Oakwood | 12.1% | 5.0%(+7.07)#73 | 4.3%(+7.82)#1,166 |
| 74. | Mundys Corner | 12.1% | 5.0%(+7.05)#74 | 4.3%(+7.80)#1,169 |
| 75. | Sutersville Borough | 11.9% | 5.0%(+6.90)#75 | 4.3%(+7.64)#1,203 |
| 76. | Foot Of Ten | 11.9% | 5.0%(+6.85)#76 | 4.3%(+7.59)#1,220 |
| 77. | St Michael | 11.9% | 5.0%(+6.83)#77 | 4.3%(+7.58)#1,222 |
| 78. | Franklin Park Borough | 11.8% | 5.0%(+6.80)#78 | 4.3%(+7.54)#1,229 |
| 79. | Fairview | 11.8% | 5.0%(+6.79)#79 | 4.3%(+7.54)#1,232 |
| 80. | Grill | 11.8% | 5.0%(+6.79)#80 | 4.3%(+7.53)#1,234 |
| 81. | Robeson Extension | 11.8% | 5.0%(+6.73)#81 | 4.3%(+7.48)#1,254 |
| 82. | Edgewood Borough | 11.6% | 5.0%(+6.62)#82 | 4.3%(+7.36)#1,275 |
| 83. | Conshohocken Borough | 11.6% | 5.0%(+6.57)#83 | 4.3%(+7.31)#1,287 |
| 84. | Douglassville | 11.5% | 5.0%(+6.51)#84 | 4.3%(+7.25)#1,307 |
| 85. | Gibraltar | 11.5% | 5.0%(+6.47)#85 | 4.3%(+7.22)#1,316 |
| 86. | Conestoga | 11.5% | 5.0%(+6.47)#86 | 4.3%(+7.21)#1,318 |
| 87. | Spring Hill | 11.5% | 5.0%(+6.46)#87 | 4.3%(+7.21)#1,321 |
| 88. | Linwood | 11.5% | 5.0%(+6.46)#88 | 4.3%(+7.20)#1,325 |
| 89. | Belfast | 11.5% | 5.0%(+6.45)#89 | 4.3%(+7.19)#1,326 |
| 90. | Morton Borough | 11.3% | 5.0%(+6.30)#90 | 4.3%(+7.05)#1,366 |
| 91. | Heckscherville | 11.2% | 5.0%(+6.18)#91 | 4.3%(+6.93)#1,400 |
| 92. | West Falls | 11.2% | 5.0%(+6.16)#92 | 4.3%(+6.91)#1,404 |
| 93. | Prompton Borough | 11.1% | 5.0%(+6.08)#93 | 4.3%(+6.83)#1,419 |
| 94. | Mount Cobb | 11.1% | 5.0%(+6.05)#94 | 4.3%(+6.79)#1,440 |
| 95. | Edgeworth Borough | 11.0% | 5.0%(+6.00)#95 | 4.3%(+6.74)#1,449 |
| 96. | Washington Boro | 11.0% | 5.0%(+5.99)#96 | 4.3%(+6.74)#1,450 |
| 97. | Shanor Northvue | 10.9% | 5.0%(+5.91)#97 | 4.3%(+6.66)#1,470 |
| 98. | Cassville Borough | 10.9% | 5.0%(+5.91)#98 | 4.3%(+6.65)#1,474 |
| 99. | Hershey | 10.9% | 5.0%(+5.85)#99 | 4.3%(+6.60)#1,490 |
| 100. | Murrysville | 10.9% | 5.0%(+5.82)#100 | 4.3%(+6.57)#1,500 |
Common Questions
What are the Top 10 Cities with the Highest Percentage of Population Employed in Health Technologists in Pennsylvania?
Top 10 Cities with the Highest Percentage of Population Employed in Health Technologists in Pennsylvania are:
#1
38.9%
#2
35.8%
#3
31.7%
#4
27.1%
#5
25.9%
#6
23.0%
#7
19.2%
#8
18.9%
#9
18.7%
#10
17.5%
What city has the Highest Percentage of Population Employed in Health Technologists in Pennsylvania?
Fredericktown has the Highest Percentage of Population Employed in Health Technologists in Pennsylvania with 38.9%.
What is the Percentage of Population Employed in Health Technologists in the State of Pennsylvania?
Percentage of Population Employed in Health Technologists in Pennsylvania is 5.0%.
What is the Percentage of Population Employed in Health Technologists in the United States?
Percentage of Population Employed in Health Technologists in the United States is 4.3%.