Cities with the Highest Percentage of Population Employed in Health Technologists in Colorado
RELATED REPORTS & OPTIONS
Health Technologists
Colorado
Compare Cities
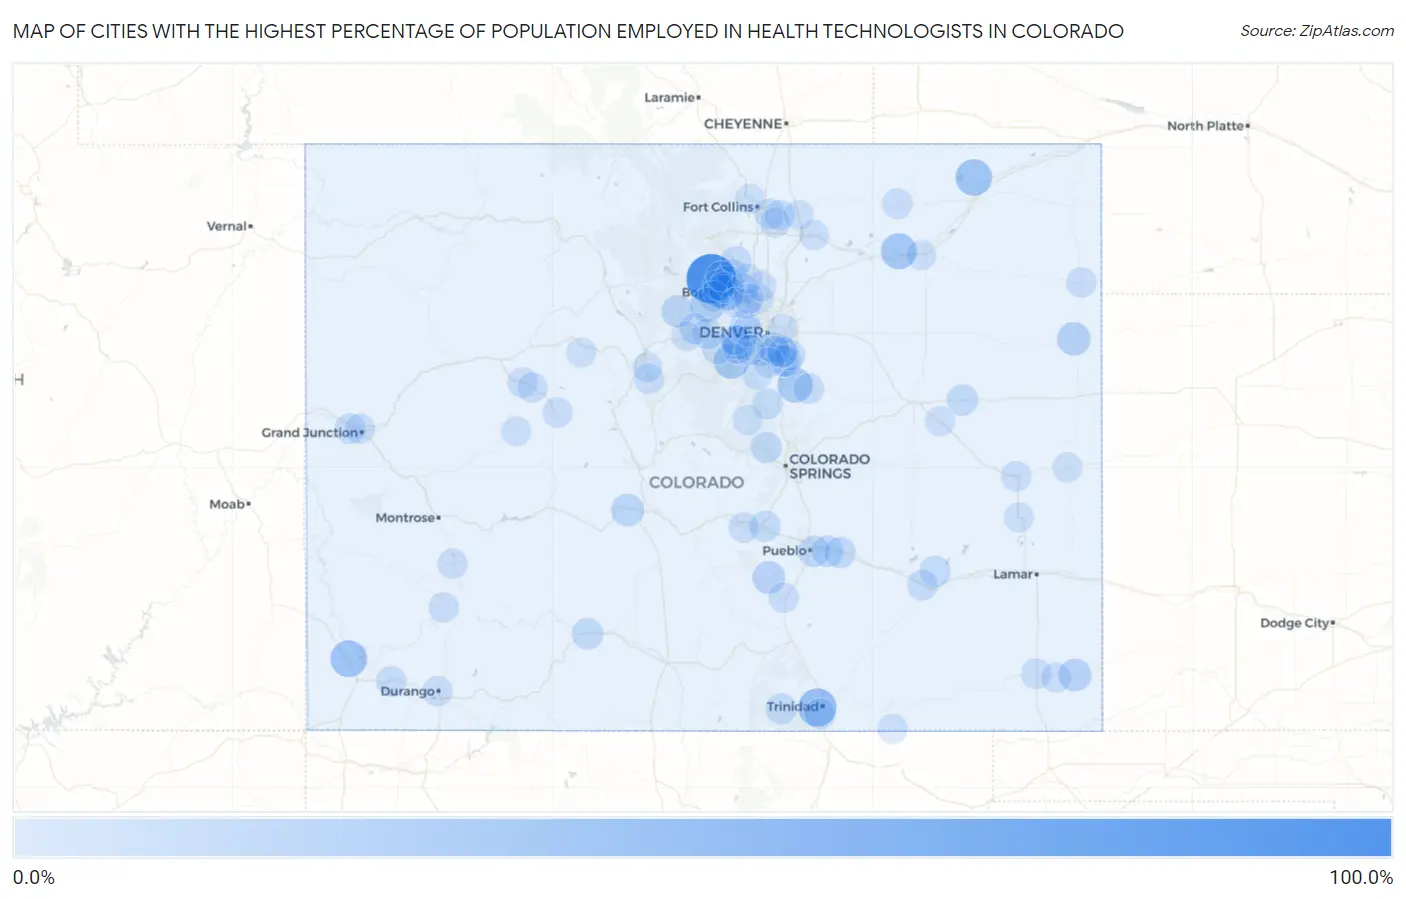
Map of Cities with the Highest Percentage of Population Employed in Health Technologists in Colorado
0.0%
100.0%
Cities with the Highest Percentage of Population Employed in Health Technologists in Colorado
| City | % Employed | vs State | vs National | |
| 1. | Hidden Lake | 100.0% | 4.2%(+95.8)#1 | 4.3%(+95.7)#9 |
| 2. | Jansen | 42.9% | 4.2%(+38.7)#2 | 4.3%(+38.6)#64 |
| 3. | Arapahoe | 41.7% | 4.2%(+37.5)#3 | 4.3%(+37.4)#72 |
| 4. | Lewis | 36.1% | 4.2%(+31.9)#4 | 4.3%(+31.8)#93 |
| 5. | Padroni | 35.7% | 4.2%(+31.5)#5 | 4.3%(+31.4)#98 |
| 6. | Morgan Heights | 32.2% | 4.2%(+28.0)#6 | 4.3%(+27.9)#130 |
| 7. | Tall Timber | 29.8% | 4.2%(+25.6)#7 | 4.3%(+25.5)#156 |
| 8. | Franktown | 28.8% | 4.2%(+24.6)#8 | 4.3%(+24.6)#164 |
| 9. | Aspen Park | 28.5% | 4.2%(+24.3)#9 | 4.3%(+24.2)#173 |
| 10. | Rollinsville | 23.7% | 4.2%(+19.5)#10 | 4.3%(+19.5)#250 |
| 11. | Idledale | 22.8% | 4.2%(+18.6)#11 | 4.3%(+18.5)#272 |
| 12. | Idalia | 21.4% | 4.2%(+17.2)#12 | 4.3%(+17.1)#311 |
| 13. | Sugarloaf | 21.1% | 4.2%(+16.9)#13 | 4.3%(+16.8)#322 |
| 14. | Beulah Valley | 18.1% | 4.2%(+13.9)#14 | 4.3%(+13.8)#465 |
| 15. | Walsh | 17.4% | 4.2%(+13.2)#15 | 4.3%(+13.1)#496 |
| 16. | Maysville | 16.8% | 4.2%(+12.6)#16 | 4.3%(+12.5)#535 |
| 17. | Winter Park | 14.6% | 4.2%(+10.4)#17 | 4.3%(+10.3)#737 |
| 18. | Bow Mar | 12.9% | 4.2%(+8.71)#18 | 4.3%(+8.63)#991 |
| 19. | Blende | 12.7% | 4.2%(+8.53)#19 | 4.3%(+8.45)#1,030 |
| 20. | Vineland | 11.9% | 4.2%(+7.71)#20 | 4.3%(+7.63)#1,208 |
| 21. | Gerrard | 11.7% | 4.2%(+7.52)#21 | 4.3%(+7.44)#1,261 |
| 22. | Avondale | 11.3% | 4.2%(+7.05)#22 | 4.3%(+6.97)#1,390 |
| 23. | Arriba | 11.0% | 4.2%(+6.80)#23 | 4.3%(+6.71)#1,455 |
| 24. | Cherry Creek | 11.0% | 4.2%(+6.75)#24 | 4.3%(+6.67)#1,468 |
| 25. | Cascade Chipita Park | 10.8% | 4.2%(+6.57)#25 | 4.3%(+6.49)#1,512 |
| 26. | Altona | 10.6% | 4.2%(+6.35)#26 | 4.3%(+6.27)#1,593 |
| 27. | Penrose | 10.3% | 4.2%(+6.07)#27 | 4.3%(+5.99)#1,694 |
| 28. | Meridian | 10.3% | 4.2%(+6.07)#28 | 4.3%(+5.99)#1,695 |
| 29. | Cheraw | 10.0% | 4.2%(+5.80)#29 | 4.3%(+5.71)#1,789 |
| 30. | Weston | 10.0% | 4.2%(+5.80)#30 | 4.3%(+5.71)#1,800 |
| 31. | Downieville Lawson Dumont | 9.6% | 4.2%(+5.41)#31 | 4.3%(+5.33)#1,951 |
| 32. | Gold Hill | 9.1% | 4.2%(+4.93)#32 | 4.3%(+4.85)#2,192 |
| 33. | Echo Hills | 9.1% | 4.2%(+4.89)#33 | 4.3%(+4.80)#2,223 |
| 34. | Lazy Acres | 8.8% | 4.2%(+4.64)#34 | 4.3%(+4.56)#2,388 |
| 35. | Swink | 8.7% | 4.2%(+4.55)#35 | 4.3%(+4.46)#2,442 |
| 36. | Perry Park | 8.7% | 4.2%(+4.45)#36 | 4.3%(+4.37)#2,511 |
| 37. | Grand View Estates | 8.4% | 4.2%(+4.20)#37 | 4.3%(+4.12)#2,674 |
| 38. | Starkville | 8.3% | 4.2%(+4.13)#38 | 4.3%(+4.05)#2,719 |
| 39. | Cherry Hills Village | 8.3% | 4.2%(+4.10)#39 | 4.3%(+4.02)#2,736 |
| 40. | Upper Bear Creek | 8.2% | 4.2%(+4.00)#40 | 4.3%(+3.92)#2,799 |
| 41. | Lyons | 8.2% | 4.2%(+3.99)#41 | 4.3%(+3.91)#2,806 |
| 42. | Redlands | 8.0% | 4.2%(+3.84)#42 | 4.3%(+3.76)#2,942 |
| 43. | St Ann Highlands | 7.9% | 4.2%(+3.72)#43 | 4.3%(+3.63)#3,047 |
| 44. | Timnath | 7.7% | 4.2%(+3.47)#44 | 4.3%(+3.39)#3,279 |
| 45. | Elizabeth | 7.6% | 4.2%(+3.39)#45 | 4.3%(+3.31)#3,349 |
| 46. | Mancos | 7.6% | 4.2%(+3.38)#46 | 4.3%(+3.30)#3,354 |
| 47. | Stepping Stone | 7.6% | 4.2%(+3.38)#47 | 4.3%(+3.30)#3,357 |
| 48. | Idaho Springs | 7.6% | 4.2%(+3.37)#48 | 4.3%(+3.29)#3,361 |
| 49. | Foxfield | 7.5% | 4.2%(+3.33)#49 | 4.3%(+3.24)#3,408 |
| 50. | Indian Hills | 7.5% | 4.2%(+3.30)#50 | 4.3%(+3.21)#3,429 |
| 51. | Raymer New Raymer | 7.4% | 4.2%(+3.20)#51 | 4.3%(+3.12)#3,526 |
| 52. | Crisman | 7.4% | 4.2%(+3.18)#52 | 4.3%(+3.10)#3,546 |
| 53. | Brookside | 7.3% | 4.2%(+3.13)#53 | 4.3%(+3.05)#3,589 |
| 54. | Catherine | 7.3% | 4.2%(+3.13)#54 | 4.3%(+3.05)#3,591 |
| 55. | Ridgway | 7.2% | 4.2%(+3.03)#55 | 4.3%(+2.95)#3,689 |
| 56. | Springfield | 7.2% | 4.2%(+3.00)#56 | 4.3%(+2.92)#3,721 |
| 57. | Ophir | 7.1% | 4.2%(+2.94)#57 | 4.3%(+2.86)#3,799 |
| 58. | Applewood | 7.1% | 4.2%(+2.85)#58 | 4.3%(+2.76)#3,914 |
| 59. | Aspen | 6.9% | 4.2%(+2.65)#59 | 4.3%(+2.57)#4,140 |
| 60. | Kit Carson | 6.5% | 4.2%(+2.32)#60 | 4.3%(+2.24)#4,578 |
| 61. | Colorado City | 6.5% | 4.2%(+2.30)#61 | 4.3%(+2.22)#4,600 |
| 62. | Blue River | 6.5% | 4.2%(+2.30)#62 | 4.3%(+2.22)#4,603 |
| 63. | Grand Junction | 6.4% | 4.2%(+2.23)#63 | 4.3%(+2.15)#4,697 |
| 64. | Fairmount | 6.4% | 4.2%(+2.19)#64 | 4.3%(+2.11)#4,734 |
| 65. | Genesee | 6.4% | 4.2%(+2.19)#65 | 4.3%(+2.10)#4,751 |
| 66. | Vilas | 6.2% | 4.2%(+2.05)#66 | 4.3%(+1.96)#4,966 |
| 67. | Durango | 6.2% | 4.2%(+2.04)#67 | 4.3%(+1.96)#4,976 |
| 68. | Basalt | 6.2% | 4.2%(+2.02)#68 | 4.3%(+1.94)#5,003 |
| 69. | Severance | 6.2% | 4.2%(+1.98)#69 | 4.3%(+1.90)#5,072 |
| 70. | Valmont | 6.2% | 4.2%(+1.95)#70 | 4.3%(+1.87)#5,121 |
| 71. | Wray | 6.1% | 4.2%(+1.92)#71 | 4.3%(+1.83)#5,189 |
| 72. | Greenwood Village | 6.1% | 4.2%(+1.87)#72 | 4.3%(+1.79)#5,250 |
| 73. | Jamestown | 6.0% | 4.2%(+1.79)#73 | 4.3%(+1.70)#5,398 |
| 74. | Kersey | 5.9% | 4.2%(+1.68)#74 | 4.3%(+1.60)#5,558 |
| 75. | Branson | 5.9% | 4.2%(+1.68)#75 | 4.3%(+1.60)#5,578 |
| 76. | Breckenridge | 5.8% | 4.2%(+1.61)#76 | 4.3%(+1.53)#5,674 |
| 77. | Marble | 5.8% | 4.2%(+1.56)#77 | 4.3%(+1.48)#5,763 |
| 78. | Eldorado Springs | 5.7% | 4.2%(+1.49)#78 | 4.3%(+1.41)#5,903 |
| 79. | Superior | 5.6% | 4.2%(+1.41)#79 | 4.3%(+1.33)#6,056 |
| 80. | Windsor | 5.6% | 4.2%(+1.39)#80 | 4.3%(+1.31)#6,074 |
| 81. | Brush | 5.6% | 4.2%(+1.37)#81 | 4.3%(+1.29)#6,105 |
| 82. | Westcreek | 5.6% | 4.2%(+1.37)#82 | 4.3%(+1.29)#6,106 |
| 83. | Highlands Ranch | 5.6% | 4.2%(+1.36)#83 | 4.3%(+1.28)#6,129 |
| 84. | Eaton | 5.6% | 4.2%(+1.36)#84 | 4.3%(+1.28)#6,132 |
| 85. | Centennial | 5.5% | 4.2%(+1.32)#85 | 4.3%(+1.24)#6,217 |
| 86. | Eads | 5.5% | 4.2%(+1.32)#86 | 4.3%(+1.24)#6,224 |
| 87. | Broomfield | 5.5% | 4.2%(+1.29)#87 | 4.3%(+1.21)#6,273 |
| 88. | Niwot | 5.4% | 4.2%(+1.24)#88 | 4.3%(+1.16)#6,372 |
| 89. | Hugo | 5.4% | 4.2%(+1.19)#89 | 4.3%(+1.10)#6,493 |
| 90. | Sterling Ranch | 5.4% | 4.2%(+1.15)#90 | 4.3%(+1.07)#6,563 |
| 91. | Louisville | 5.4% | 4.2%(+1.15)#91 | 4.3%(+1.06)#6,588 |
| 92. | Edwards | 5.3% | 4.2%(+1.14)#92 | 4.3%(+1.06)#6,596 |
| 93. | Denver | 5.3% | 4.2%(+1.13)#93 | 4.3%(+1.04)#6,616 |
| 94. | Dakota Ridge | 5.3% | 4.2%(+1.10)#94 | 4.3%(+1.02)#6,675 |
| 95. | Four Square Mile | 5.3% | 4.2%(+1.09)#95 | 4.3%(+1.01)#6,691 |
| 96. | Laporte | 5.3% | 4.2%(+1.06)#96 | 4.3%(+0.981)#6,750 |
| 97. | Cheyenne Wells | 5.2% | 4.2%(+1.01)#97 | 4.3%(+0.933)#6,873 |
| 98. | Erie | 5.2% | 4.2%(+0.993)#98 | 4.3%(+0.912)#6,926 |
| 99. | Roxborough Park | 5.2% | 4.2%(+0.966)#99 | 4.3%(+0.885)#6,984 |
| 100. | Georgetown | 5.1% | 4.2%(+0.936)#100 | 4.3%(+0.855)#7,033 |
Common Questions
What are the Top 10 Cities with the Highest Percentage of Population Employed in Health Technologists in Colorado?
Top 10 Cities with the Highest Percentage of Population Employed in Health Technologists in Colorado are:
#1
100.0%
#2
42.9%
#3
36.1%
#4
35.7%
#5
32.2%
#6
29.8%
#7
28.8%
#8
28.5%
#9
23.7%
#10
22.8%
What city has the Highest Percentage of Population Employed in Health Technologists in Colorado?
Hidden Lake has the Highest Percentage of Population Employed in Health Technologists in Colorado with 100.0%.
What is the Percentage of Population Employed in Health Technologists in the State of Colorado?
Percentage of Population Employed in Health Technologists in Colorado is 4.2%.
What is the Percentage of Population Employed in Health Technologists in the United States?
Percentage of Population Employed in Health Technologists in the United States is 4.3%.