Cities with the Highest Percentage of Population Employed in Health Technologists in Illinois
RELATED REPORTS & OPTIONS
Health Technologists
Illinois
Compare Cities
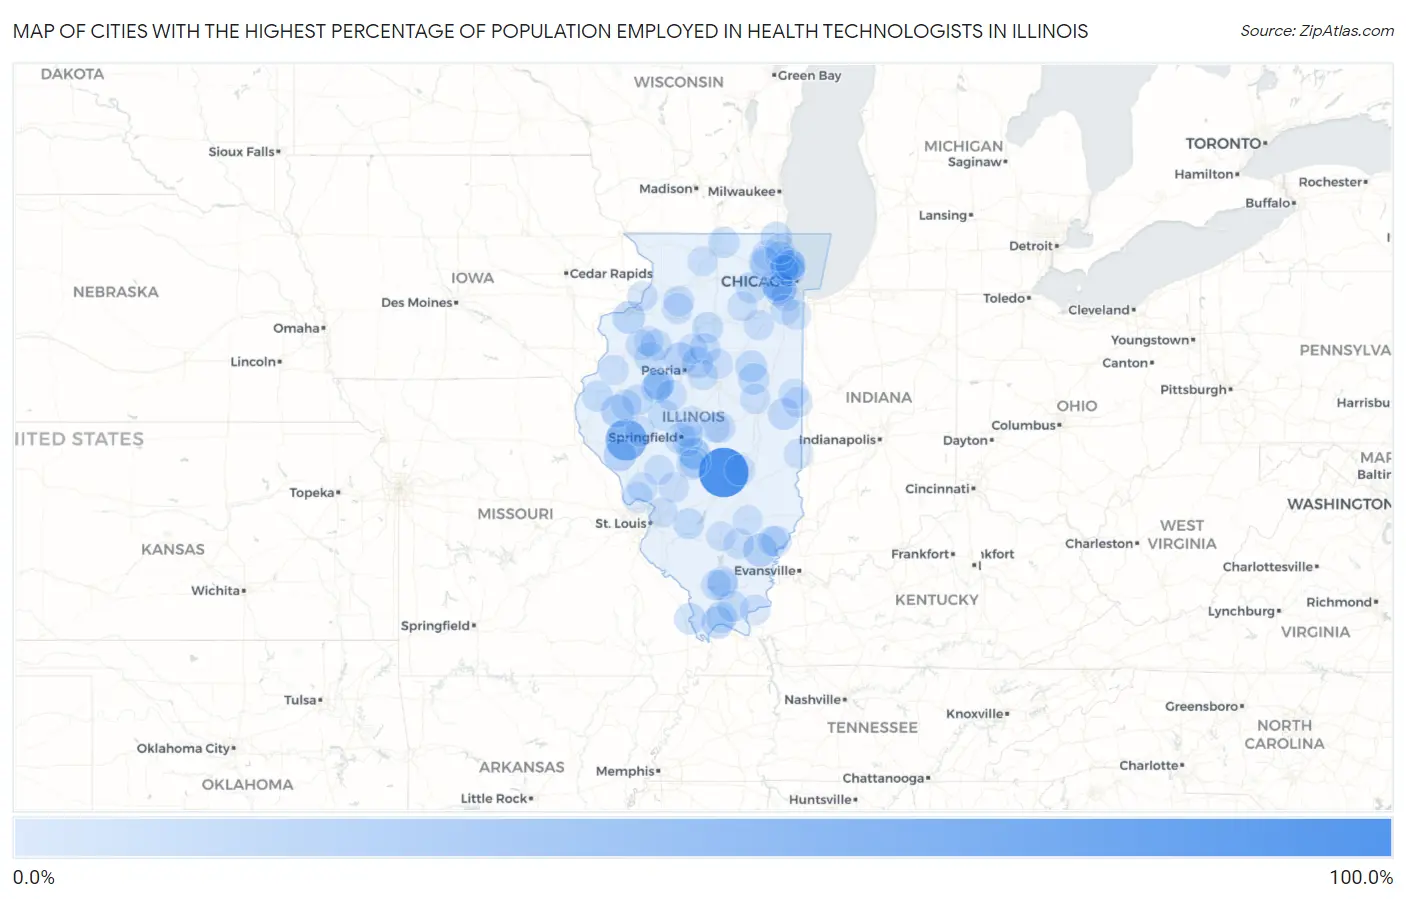
Map of Cities with the Highest Percentage of Population Employed in Health Technologists in Illinois
0.0%
100.0%
Cities with the Highest Percentage of Population Employed in Health Technologists in Illinois
| City | % Employed | vs State | vs National | |
| 1. | Lakewood | 100.0% | 4.4%(+95.6)#1 | 4.3%(+95.7)#12 |
| 2. | Naples | 59.6% | 4.4%(+55.2)#2 | 4.3%(+55.3)#22 |
| 3. | Marcelline | 29.6% | 4.4%(+25.2)#3 | 4.3%(+25.3)#160 |
| 4. | Elwin | 25.0% | 4.4%(+20.6)#4 | 4.3%(+20.7)#219 |
| 5. | Burnt Prairie | 24.1% | 4.4%(+19.7)#5 | 4.3%(+19.9)#241 |
| 6. | Camden | 21.7% | 4.4%(+17.3)#6 | 4.3%(+17.5)#303 |
| 7. | Oak Brook | 21.5% | 4.4%(+17.1)#7 | 4.3%(+17.2)#307 |
| 8. | Time | 20.0% | 4.4%(+15.6)#8 | 4.3%(+15.7)#370 |
| 9. | Dunlap | 19.9% | 4.4%(+15.5)#9 | 4.3%(+15.6)#371 |
| 10. | Coyne Center | 19.3% | 4.4%(+14.9)#10 | 4.3%(+15.0)#397 |
| 11. | New Grand Chain | 18.2% | 4.4%(+13.8)#11 | 4.3%(+13.9)#462 |
| 12. | Burr Ridge | 17.5% | 4.4%(+13.1)#12 | 4.3%(+13.2)#493 |
| 13. | Baileyville | 16.9% | 4.4%(+12.5)#13 | 4.3%(+12.6)#526 |
| 14. | South Barrington | 16.5% | 4.4%(+12.1)#14 | 4.3%(+12.2)#558 |
| 15. | Forrest | 16.2% | 4.4%(+11.8)#15 | 4.3%(+11.9)#591 |
| 16. | Muncie | 15.6% | 4.4%(+11.2)#16 | 4.3%(+11.3)#633 |
| 17. | Old Mill Creek | 15.1% | 4.4%(+10.7)#17 | 4.3%(+10.8)#679 |
| 18. | Tovey | 14.7% | 4.4%(+10.3)#18 | 4.3%(+10.4)#718 |
| 19. | Belknap | 14.7% | 4.4%(+10.3)#19 | 4.3%(+10.4)#720 |
| 20. | East Cape Girardeau | 14.7% | 4.4%(+10.3)#20 | 4.3%(+10.4)#724 |
| 21. | Sibley | 14.5% | 4.4%(+10.1)#21 | 4.3%(+10.2)#756 |
| 22. | Literberry | 14.3% | 4.4%(+9.90)#22 | 4.3%(+10.00)#775 |
| 23. | Simpson | 14.3% | 4.4%(+9.90)#23 | 4.3%(+10.00)#778 |
| 24. | Metamora | 13.9% | 4.4%(+9.47)#24 | 4.3%(+9.58)#830 |
| 25. | Prestbury | 13.8% | 4.4%(+9.38)#25 | 4.3%(+9.49)#846 |
| 26. | Dunfermline | 13.7% | 4.4%(+9.30)#26 | 4.3%(+9.40)#864 |
| 27. | Caledonia | 13.6% | 4.4%(+9.19)#27 | 4.3%(+9.29)#887 |
| 28. | Jeisyville | 13.5% | 4.4%(+9.07)#28 | 4.3%(+9.18)#904 |
| 29. | Palmer | 13.4% | 4.4%(+9.05)#29 | 4.3%(+9.16)#907 |
| 30. | Standard | 13.2% | 4.4%(+8.84)#30 | 4.3%(+8.95)#939 |
| 31. | La Rose | 13.2% | 4.4%(+8.82)#31 | 4.3%(+8.92)#941 |
| 32. | Victoria | 13.0% | 4.4%(+8.65)#32 | 4.3%(+8.76)#969 |
| 33. | Gilson | 13.0% | 4.4%(+8.65)#33 | 4.3%(+8.76)#972 |
| 34. | Bryant | 12.9% | 4.4%(+8.55)#34 | 4.3%(+8.66)#987 |
| 35. | Oakford | 12.9% | 4.4%(+8.48)#35 | 4.3%(+8.59)#1,004 |
| 36. | Breese | 12.9% | 4.4%(+8.47)#36 | 4.3%(+8.57)#1,007 |
| 37. | Willow Lake | 12.8% | 4.4%(+8.42)#37 | 4.3%(+8.53)#1,014 |
| 38. | Bentley | 12.5% | 4.4%(+8.11)#38 | 4.3%(+8.21)#1,088 |
| 39. | Vermont | 12.5% | 4.4%(+8.07)#39 | 4.3%(+8.17)#1,094 |
| 40. | Jerome | 12.4% | 4.4%(+7.98)#40 | 4.3%(+8.09)#1,107 |
| 41. | Edgington | 12.3% | 4.4%(+7.87)#41 | 4.3%(+7.98)#1,123 |
| 42. | Browns | 12.0% | 4.4%(+7.65)#42 | 4.3%(+7.75)#1,176 |
| 43. | Forest City | 12.0% | 4.4%(+7.61)#43 | 4.3%(+7.71)#1,181 |
| 44. | Henderson | 12.0% | 4.4%(+7.57)#44 | 4.3%(+7.67)#1,195 |
| 45. | Spillertown | 11.9% | 4.4%(+7.56)#45 | 4.3%(+7.66)#1,198 |
| 46. | North Barrington | 11.7% | 4.4%(+7.29)#46 | 4.3%(+7.39)#1,270 |
| 47. | Keenes | 11.5% | 4.4%(+7.15)#47 | 4.3%(+7.25)#1,312 |
| 48. | New Bedford | 11.5% | 4.4%(+7.15)#48 | 4.3%(+7.25)#1,313 |
| 49. | Grafton | 11.5% | 4.4%(+7.10)#49 | 4.3%(+7.21)#1,322 |
| 50. | Littleton | 11.5% | 4.4%(+7.08)#50 | 4.3%(+7.19)#1,329 |
| 51. | Forsyth | 11.5% | 4.4%(+7.07)#51 | 4.3%(+7.18)#1,332 |
| 52. | Strasburg | 11.3% | 4.4%(+6.86)#52 | 4.3%(+6.96)#1,391 |
| 53. | Deer Grove | 11.1% | 4.4%(+6.72)#53 | 4.3%(+6.83)#1,429 |
| 54. | Johnston City | 10.0% | 4.4%(+5.62)#54 | 4.3%(+5.72)#1,775 |
| 55. | Arenzville | 10.0% | 4.4%(+5.61)#55 | 4.3%(+5.71)#1,785 |
| 56. | Panola | 10.0% | 4.4%(+5.61)#56 | 4.3%(+5.71)#1,802 |
| 57. | Rosiclare | 10.0% | 4.4%(+5.58)#57 | 4.3%(+5.68)#1,808 |
| 58. | Energy | 9.9% | 4.4%(+5.51)#58 | 4.3%(+5.62)#1,830 |
| 59. | Bismarck | 9.8% | 4.4%(+5.45)#59 | 4.3%(+5.55)#1,859 |
| 60. | Morton Grove | 9.8% | 4.4%(+5.39)#60 | 4.3%(+5.49)#1,888 |
| 61. | Cordova | 9.8% | 4.4%(+5.37)#61 | 4.3%(+5.48)#1,897 |
| 62. | Indian Head Park | 9.7% | 4.4%(+5.35)#62 | 4.3%(+5.45)#1,905 |
| 63. | Albion | 9.7% | 4.4%(+5.28)#63 | 4.3%(+5.39)#1,927 |
| 64. | Goodfield | 9.6% | 4.4%(+5.25)#64 | 4.3%(+5.35)#1,939 |
| 65. | Eagarville | 9.6% | 4.4%(+5.20)#65 | 4.3%(+5.30)#1,965 |
| 66. | Fisher | 9.6% | 4.4%(+5.18)#66 | 4.3%(+5.28)#1,977 |
| 67. | Hopewell | 9.5% | 4.4%(+5.15)#67 | 4.3%(+5.26)#1,990 |
| 68. | Warrensburg | 9.5% | 4.4%(+5.13)#68 | 4.3%(+5.24)#1,996 |
| 69. | Westlake | 9.5% | 4.4%(+5.08)#69 | 4.3%(+5.18)#2,024 |
| 70. | Skokie | 9.4% | 4.4%(+4.97)#70 | 4.3%(+5.08)#2,076 |
| 71. | Coal City | 9.4% | 4.4%(+4.97)#71 | 4.3%(+5.08)#2,079 |
| 72. | Rochester | 9.3% | 4.4%(+4.93)#72 | 4.3%(+5.03)#2,100 |
| 73. | Palos Heights | 9.3% | 4.4%(+4.91)#73 | 4.3%(+5.02)#2,105 |
| 74. | Glencoe | 9.2% | 4.4%(+4.83)#74 | 4.3%(+4.93)#2,155 |
| 75. | St David | 9.2% | 4.4%(+4.81)#75 | 4.3%(+4.92)#2,162 |
| 76. | Hettick | 9.1% | 4.4%(+4.70)#76 | 4.3%(+4.80)#2,231 |
| 77. | Morrisonville | 9.0% | 4.4%(+4.64)#77 | 4.3%(+4.74)#2,272 |
| 78. | Clarendon Hills | 9.0% | 4.4%(+4.59)#78 | 4.3%(+4.69)#2,308 |
| 79. | Lincolnwood | 9.0% | 4.4%(+4.58)#79 | 4.3%(+4.68)#2,311 |
| 80. | Barrington Hills | 9.0% | 4.4%(+4.57)#80 | 4.3%(+4.68)#2,313 |
| 81. | Vermilion | 9.0% | 4.4%(+4.56)#81 | 4.3%(+4.67)#2,319 |
| 82. | Raritan | 8.9% | 4.4%(+4.54)#82 | 4.3%(+4.64)#2,327 |
| 83. | Jerseyville | 8.9% | 4.4%(+4.52)#83 | 4.3%(+4.63)#2,338 |
| 84. | Elkhart | 8.9% | 4.4%(+4.51)#84 | 4.3%(+4.61)#2,351 |
| 85. | Spaulding | 8.8% | 4.4%(+4.44)#85 | 4.3%(+4.55)#2,390 |
| 86. | Glenview | 8.8% | 4.4%(+4.42)#86 | 4.3%(+4.53)#2,406 |
| 87. | Oneida | 8.8% | 4.4%(+4.41)#87 | 4.3%(+4.52)#2,412 |
| 88. | Wilmette | 8.8% | 4.4%(+4.40)#88 | 4.3%(+4.50)#2,416 |
| 89. | Frankfort | 8.8% | 4.4%(+4.40)#89 | 4.3%(+4.50)#2,419 |
| 90. | Kenilworth | 8.7% | 4.4%(+4.31)#90 | 4.3%(+4.41)#2,476 |
| 91. | Crete | 8.7% | 4.4%(+4.29)#91 | 4.3%(+4.39)#2,498 |
| 92. | Rossville | 8.7% | 4.4%(+4.28)#92 | 4.3%(+4.38)#2,505 |
| 93. | Glen Carbon | 8.5% | 4.4%(+4.13)#93 | 4.3%(+4.24)#2,580 |
| 94. | Flora | 8.5% | 4.4%(+4.10)#94 | 4.3%(+4.20)#2,608 |
| 95. | Lincolnshire | 8.5% | 4.4%(+4.08)#95 | 4.3%(+4.19)#2,619 |
| 96. | Park Ridge | 8.4% | 4.4%(+4.03)#96 | 4.3%(+4.13)#2,664 |
| 97. | Byron | 8.4% | 4.4%(+4.02)#97 | 4.3%(+4.12)#2,672 |
| 98. | Newark | 8.4% | 4.4%(+3.98)#98 | 4.3%(+4.08)#2,693 |
| 99. | Green Oaks | 8.3% | 4.4%(+3.93)#99 | 4.3%(+4.04)#2,729 |
| 100. | Dix | 8.3% | 4.4%(+3.91)#100 | 4.3%(+4.01)#2,737 |
Common Questions
What are the Top 10 Cities with the Highest Percentage of Population Employed in Health Technologists in Illinois?
Top 10 Cities with the Highest Percentage of Population Employed in Health Technologists in Illinois are:
#1
100.0%
#2
59.6%
#3
24.1%
#4
21.7%
#5
21.5%
#6
20.0%
#7
19.9%
#8
19.3%
#9
18.2%
#10
17.5%
What city has the Highest Percentage of Population Employed in Health Technologists in Illinois?
Lakewood has the Highest Percentage of Population Employed in Health Technologists in Illinois with 100.0%.
What is the Percentage of Population Employed in Health Technologists in the State of Illinois?
Percentage of Population Employed in Health Technologists in Illinois is 4.4%.
What is the Percentage of Population Employed in Health Technologists in the United States?
Percentage of Population Employed in Health Technologists in the United States is 4.3%.