Cities with the Highest Percentage of Population Employed in Health Technologists in Maryland
RELATED REPORTS & OPTIONS
Health Technologists
Maryland
Compare Cities
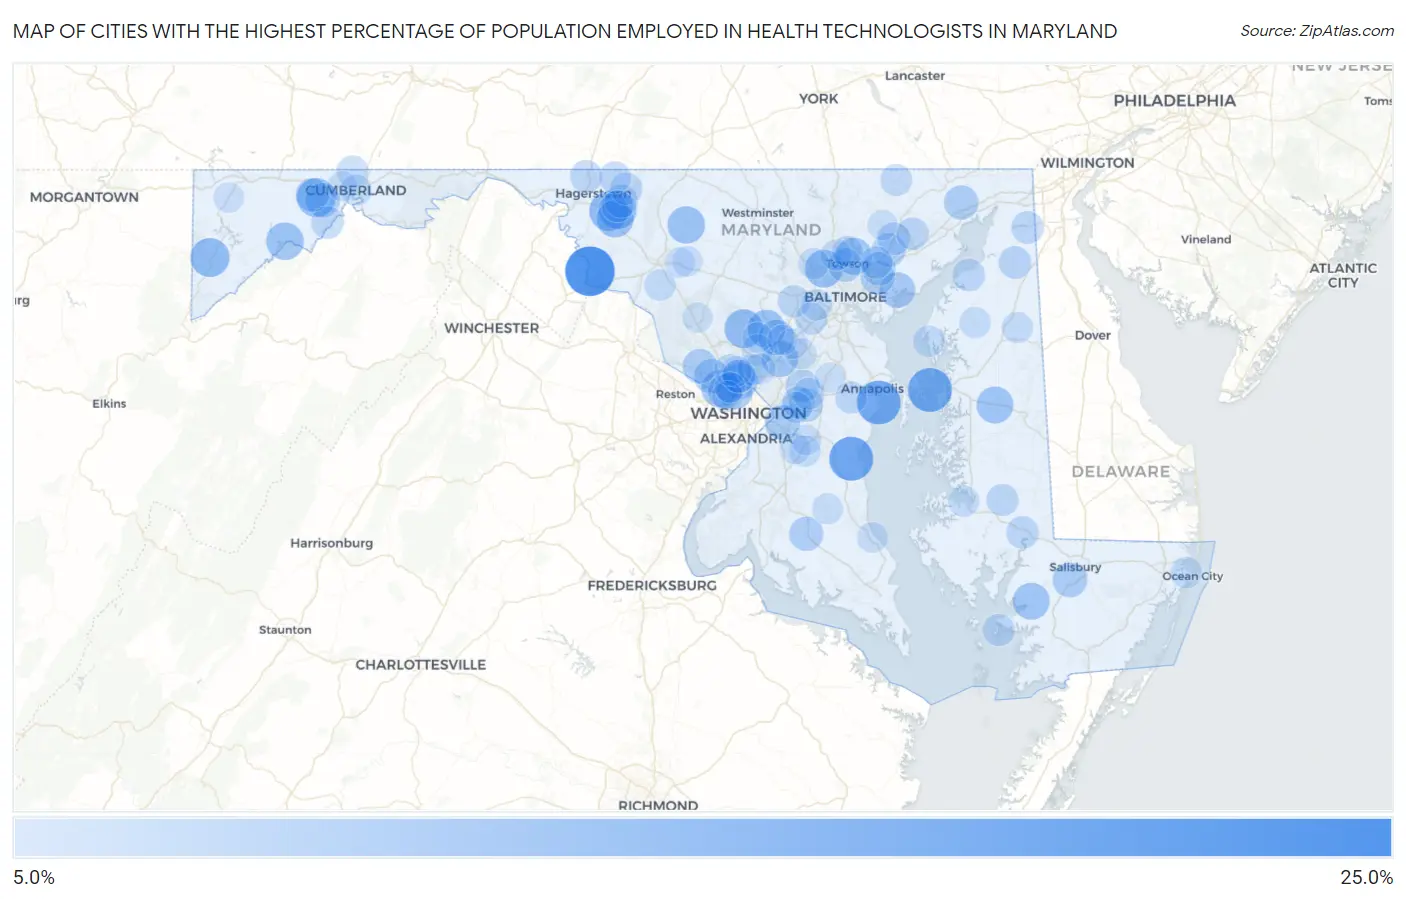
Map of Cities with the Highest Percentage of Population Employed in Health Technologists in Maryland
0.0%
25.0%
Cities with the Highest Percentage of Population Employed in Health Technologists in Maryland
| City | % Employed | vs State | vs National | |
| 1. | Dargan | 20.8% | 4.4%(+16.4)#1 | 4.3%(+16.5)#334 |
| 2. | Friendship | 16.4% | 4.4%(+12.0)#2 | 4.3%(+12.1)#565 |
| 3. | Kent Narrows | 16.3% | 4.4%(+11.9)#3 | 4.3%(+12.0)#581 |
| 4. | Crumpton | 16.2% | 4.4%(+11.8)#4 | 4.3%(+11.9)#585 |
| 5. | Highland Beach | 16.1% | 4.4%(+11.7)#5 | 4.3%(+11.8)#596 |
| 6. | Beaver Creek | 12.4% | 4.4%(+8.03)#6 | 4.3%(+8.15)#1,099 |
| 7. | Oakland | 12.4% | 4.4%(+8.01)#7 | 4.3%(+8.13)#1,102 |
| 8. | Shaft | 12.3% | 4.4%(+7.93)#8 | 4.3%(+8.05)#1,114 |
| 9. | Brookeville | 12.1% | 4.4%(+7.71)#9 | 4.3%(+7.84)#1,161 |
| 10. | Bagtown | 11.6% | 4.4%(+7.20)#10 | 4.3%(+7.32)#1,282 |
| 11. | Pikesville | 11.5% | 4.4%(+7.09)#11 | 4.3%(+7.21)#1,320 |
| 12. | Highland | 11.3% | 4.4%(+6.92)#12 | 4.3%(+7.04)#1,367 |
| 13. | Bloomington | 11.3% | 4.4%(+6.88)#13 | 4.3%(+7.00)#1,378 |
| 14. | Woodsboro | 11.2% | 4.4%(+6.83)#14 | 4.3%(+6.95)#1,395 |
| 15. | Mount Lena | 11.2% | 4.4%(+6.77)#15 | 4.3%(+6.89)#1,410 |
| 16. | Cabin John | 11.0% | 4.4%(+6.57)#16 | 4.3%(+6.69)#1,464 |
| 17. | Mount Vernon | 10.8% | 4.4%(+6.38)#17 | 4.3%(+6.50)#1,509 |
| 18. | Queen Anne | 10.8% | 4.4%(+6.38)#18 | 4.3%(+6.50)#1,511 |
| 19. | Hampton | 10.8% | 4.4%(+6.35)#19 | 4.3%(+6.47)#1,521 |
| 20. | Konterra | 10.4% | 4.4%(+6.02)#20 | 4.3%(+6.14)#1,632 |
| 21. | North Chevy Chase | 10.0% | 4.4%(+5.56)#21 | 4.3%(+5.68)#1,807 |
| 22. | Fulton | 10.0% | 4.4%(+5.55)#22 | 4.3%(+5.67)#1,810 |
| 23. | Somerset | 9.9% | 4.4%(+5.49)#23 | 4.3%(+5.62)#1,836 |
| 24. | Bowleys Quarters | 9.8% | 4.4%(+5.37)#24 | 4.3%(+5.49)#1,884 |
| 25. | District Heights | 9.4% | 4.4%(+4.99)#25 | 4.3%(+5.11)#2,063 |
| 26. | Fruitland | 9.2% | 4.4%(+4.75)#26 | 4.3%(+4.87)#2,181 |
| 27. | Vale Summit | 9.0% | 4.4%(+4.58)#27 | 4.3%(+4.70)#2,300 |
| 28. | Potomac | 9.0% | 4.4%(+4.58)#28 | 4.3%(+4.70)#2,301 |
| 29. | Travilah | 8.9% | 4.4%(+4.52)#29 | 4.3%(+4.64)#2,329 |
| 30. | Port Deposit | 8.8% | 4.4%(+4.44)#30 | 4.3%(+4.56)#2,387 |
| 31. | Honeygo | 8.8% | 4.4%(+4.38)#31 | 4.3%(+4.50)#2,417 |
| 32. | Glen Echo | 8.8% | 4.4%(+4.35)#32 | 4.3%(+4.47)#2,434 |
| 33. | Charlotte Hall | 8.8% | 4.4%(+4.35)#33 | 4.3%(+4.47)#2,437 |
| 34. | Towson | 8.5% | 4.4%(+4.14)#34 | 4.3%(+4.26)#2,564 |
| 35. | Rossville | 8.5% | 4.4%(+4.12)#35 | 4.3%(+4.24)#2,573 |
| 36. | Kingsville | 8.4% | 4.4%(+3.98)#36 | 4.3%(+4.10)#2,684 |
| 37. | White Marsh | 8.4% | 4.4%(+3.95)#37 | 4.3%(+4.07)#2,700 |
| 38. | Woodmore | 8.2% | 4.4%(+3.79)#38 | 4.3%(+3.91)#2,813 |
| 39. | Midlothian | 8.2% | 4.4%(+3.77)#39 | 4.3%(+3.90)#2,824 |
| 40. | Chevy Chase View | 8.0% | 4.4%(+3.59)#40 | 4.3%(+3.71)#2,973 |
| 41. | Glenn Dale | 8.0% | 4.4%(+3.59)#41 | 4.3%(+3.71)#2,985 |
| 42. | Jugtown | 7.8% | 4.4%(+3.39)#42 | 4.3%(+3.51)#3,157 |
| 43. | South Kensington | 7.6% | 4.4%(+3.22)#43 | 4.3%(+3.35)#3,322 |
| 44. | Pleasant Hills | 7.6% | 4.4%(+3.22)#44 | 4.3%(+3.34)#3,323 |
| 45. | Cecilton | 7.6% | 4.4%(+3.17)#45 | 4.3%(+3.29)#3,370 |
| 46. | Bel Air South | 7.5% | 4.4%(+3.10)#46 | 4.3%(+3.22)#3,424 |
| 47. | Betterton | 7.5% | 4.4%(+3.09)#47 | 4.3%(+3.21)#3,431 |
| 48. | Chesapeake City | 7.5% | 4.4%(+3.07)#48 | 4.3%(+3.19)#3,463 |
| 49. | Rawlings | 7.5% | 4.4%(+3.05)#49 | 4.3%(+3.17)#3,490 |
| 50. | Vienna | 7.4% | 4.4%(+2.98)#50 | 4.3%(+3.10)#3,542 |
| 51. | Perry Hall | 7.4% | 4.4%(+2.98)#51 | 4.3%(+3.10)#3,544 |
| 52. | Mitchellville | 7.4% | 4.4%(+2.97)#52 | 4.3%(+3.10)#3,547 |
| 53. | Maugansville | 7.3% | 4.4%(+2.91)#53 | 4.3%(+3.03)#3,610 |
| 54. | Smithsburg | 7.3% | 4.4%(+2.88)#54 | 4.3%(+3.00)#3,634 |
| 55. | Ellicott City | 7.2% | 4.4%(+2.78)#55 | 4.3%(+2.90)#3,745 |
| 56. | Ilchester | 7.2% | 4.4%(+2.75)#56 | 4.3%(+2.87)#3,775 |
| 57. | East New Market | 7.1% | 4.4%(+2.74)#57 | 4.3%(+2.86)#3,790 |
| 58. | Deal Island | 7.1% | 4.4%(+2.74)#58 | 4.3%(+2.86)#3,793 |
| 59. | Leitersburg | 7.1% | 4.4%(+2.67)#59 | 4.3%(+2.79)#3,876 |
| 60. | Riva | 7.1% | 4.4%(+2.65)#60 | 4.3%(+2.78)#3,898 |
| 61. | Mount Aetna | 7.1% | 4.4%(+2.64)#61 | 4.3%(+2.77)#3,912 |
| 62. | Fairwood | 7.0% | 4.4%(+2.57)#62 | 4.3%(+2.70)#3,988 |
| 63. | Pylesville | 6.9% | 4.4%(+2.47)#63 | 4.3%(+2.59)#4,113 |
| 64. | Ellerslie | 6.8% | 4.4%(+2.41)#64 | 4.3%(+2.53)#4,186 |
| 65. | North Bethesda | 6.7% | 4.4%(+2.31)#65 | 4.3%(+2.43)#4,323 |
| 66. | Cloverly | 6.7% | 4.4%(+2.30)#66 | 4.3%(+2.42)#4,333 |
| 67. | Rock Hall | 6.6% | 4.4%(+2.22)#67 | 4.3%(+2.34)#4,448 |
| 68. | Lake Arbor | 6.6% | 4.4%(+2.20)#68 | 4.3%(+2.32)#4,470 |
| 69. | Buckeystown | 6.6% | 4.4%(+2.19)#69 | 4.3%(+2.31)#4,486 |
| 70. | Catonsville | 6.6% | 4.4%(+2.17)#70 | 4.3%(+2.29)#4,516 |
| 71. | Sudlersville | 6.5% | 4.4%(+2.14)#71 | 4.3%(+2.26)#4,552 |
| 72. | Romancoke | 6.5% | 4.4%(+2.12)#72 | 4.3%(+2.24)#4,575 |
| 73. | Kingstown | 6.5% | 4.4%(+2.11)#73 | 4.3%(+2.24)#4,577 |
| 74. | West Ocean City | 6.5% | 4.4%(+2.11)#74 | 4.3%(+2.23)#4,589 |
| 75. | Marlton | 6.5% | 4.4%(+2.06)#75 | 4.3%(+2.18)#4,651 |
| 76. | White Oak | 6.5% | 4.4%(+2.05)#76 | 4.3%(+2.17)#4,663 |
| 77. | Kemp Mill | 6.5% | 4.4%(+2.05)#77 | 4.3%(+2.17)#4,665 |
| 78. | Mays Chapel | 6.4% | 4.4%(+2.01)#78 | 4.3%(+2.13)#4,719 |
| 79. | Garrison | 6.4% | 4.4%(+2.00)#79 | 4.3%(+2.12)#4,727 |
| 80. | Cumberland | 6.4% | 4.4%(+1.99)#80 | 4.3%(+2.11)#4,732 |
| 81. | Algonquin | 6.4% | 4.4%(+1.99)#81 | 4.3%(+2.11)#4,735 |
| 82. | Garrett Park | 6.3% | 4.4%(+1.89)#82 | 4.3%(+2.01)#4,890 |
| 83. | Rosaryville | 6.3% | 4.4%(+1.85)#83 | 4.3%(+1.97)#4,944 |
| 84. | Eagle Harbor | 6.2% | 4.4%(+1.84)#84 | 4.3%(+1.96)#4,971 |
| 85. | Maryland City | 6.2% | 4.4%(+1.83)#85 | 4.3%(+1.95)#4,986 |
| 86. | Brookmont | 6.2% | 4.4%(+1.82)#86 | 4.3%(+1.94)#5,000 |
| 87. | Timonium | 6.2% | 4.4%(+1.75)#87 | 4.3%(+1.87)#5,103 |
| 88. | St Leonard | 6.1% | 4.4%(+1.71)#88 | 4.3%(+1.83)#5,198 |
| 89. | Queensland | 6.1% | 4.4%(+1.65)#89 | 4.3%(+1.77)#5,289 |
| 90. | North Laurel | 6.0% | 4.4%(+1.59)#90 | 4.3%(+1.71)#5,383 |
| 91. | Bethesda | 6.0% | 4.4%(+1.56)#91 | 4.3%(+1.68)#5,442 |
| 92. | Linganore | 5.9% | 4.4%(+1.54)#92 | 4.3%(+1.66)#5,468 |
| 93. | Spring Ridge | 5.8% | 4.4%(+1.43)#93 | 4.3%(+1.55)#5,645 |
| 94. | Fallston | 5.8% | 4.4%(+1.43)#94 | 4.3%(+1.55)#5,651 |
| 95. | Accident | 5.8% | 4.4%(+1.42)#95 | 4.3%(+1.54)#5,659 |
| 96. | Ashton Sandy Spring | 5.8% | 4.4%(+1.39)#96 | 4.3%(+1.51)#5,709 |
| 97. | Clarksburg | 5.8% | 4.4%(+1.39)#97 | 4.3%(+1.51)#5,710 |
| 98. | Scaggsville | 5.8% | 4.4%(+1.38)#98 | 4.3%(+1.50)#5,737 |
| 99. | La Vale | 5.7% | 4.4%(+1.33)#99 | 4.3%(+1.45)#5,814 |
| 100. | Crofton | 5.7% | 4.4%(+1.27)#100 | 4.3%(+1.39)#5,925 |
Common Questions
What are the Top 10 Cities with the Highest Percentage of Population Employed in Health Technologists in Maryland?
Top 10 Cities with the Highest Percentage of Population Employed in Health Technologists in Maryland are:
#1
20.8%
#2
16.4%
#3
16.3%
#4
16.1%
#5
12.4%
#6
12.4%
#7
12.3%
#8
12.1%
#9
11.6%
#10
11.5%
What city has the Highest Percentage of Population Employed in Health Technologists in Maryland?
Dargan has the Highest Percentage of Population Employed in Health Technologists in Maryland with 20.8%.
What is the Percentage of Population Employed in Health Technologists in the State of Maryland?
Percentage of Population Employed in Health Technologists in Maryland is 4.4%.
What is the Percentage of Population Employed in Health Technologists in the United States?
Percentage of Population Employed in Health Technologists in the United States is 4.3%.