Cities with the Highest Percentage of Population Employed in Health Technologists in New Mexico
RELATED REPORTS & OPTIONS
Health Technologists
New Mexico
Compare Cities
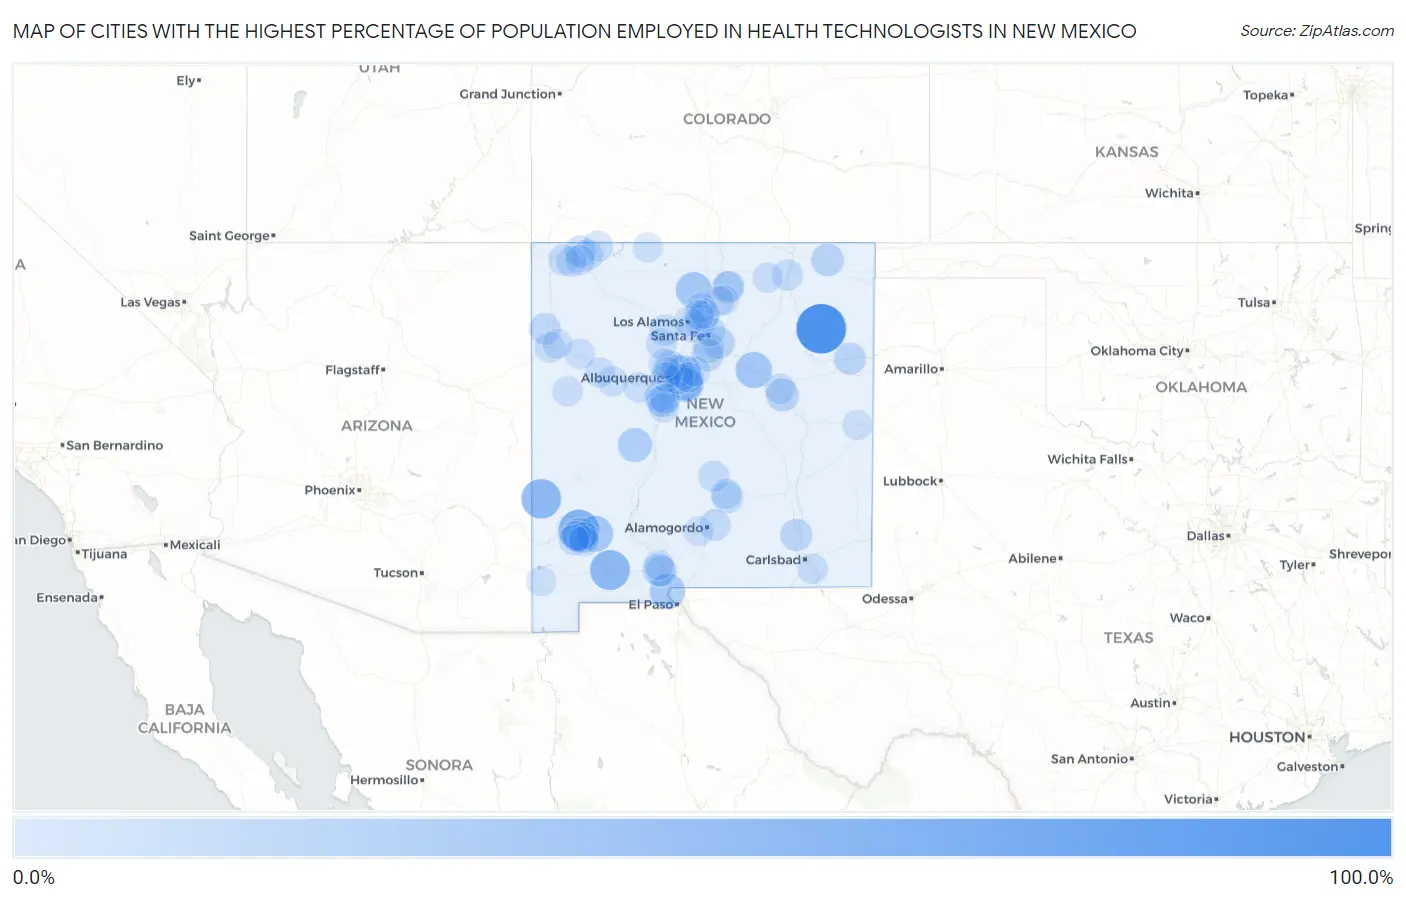
Map of Cities with the Highest Percentage of Population Employed in Health Technologists in New Mexico
0.0%
100.0%
Cities with the Highest Percentage of Population Employed in Health Technologists in New Mexico
| City | % Employed | vs State | vs National | |
| 1. | Encantado | 100.0% | 4.1%(+95.9)#1 | 4.3%(+95.7)#5 |
| 2. | Mosquero | 100.0% | 4.1%(+95.9)#2 | 4.3%(+95.7)#10 |
| 3. | Pinos Altos | 55.6% | 4.1%(+51.4)#3 | 4.3%(+51.3)#29 |
| 4. | Sagar | 54.8% | 4.1%(+50.7)#4 | 4.3%(+50.5)#30 |
| 5. | Pecan Park | 50.9% | 4.1%(+46.8)#5 | 4.3%(+46.6)#39 |
| 6. | Glenwood | 50.0% | 4.1%(+45.9)#6 | 4.3%(+45.7)#44 |
| 7. | Sunlit Hills | 38.3% | 4.1%(+34.2)#7 | 4.3%(+34.0)#81 |
| 8. | Anton Chico | 33.3% | 4.1%(+29.2)#8 | 4.3%(+29.0)#114 |
| 9. | San Lorenzo | 32.5% | 4.1%(+28.4)#9 | 4.3%(+28.2)#124 |
| 10. | El Rito | 31.3% | 4.1%(+27.2)#10 | 4.3%(+27.0)#145 |
| 11. | Cedro | 30.0% | 4.1%(+25.9)#11 | 4.3%(+25.8)#154 |
| 12. | La Union | 28.6% | 4.1%(+24.5)#12 | 4.3%(+24.3)#167 |
| 13. | Crestview | 28.6% | 4.1%(+24.4)#13 | 4.3%(+24.3)#170 |
| 14. | Little Walnut | 28.4% | 4.1%(+24.2)#14 | 4.3%(+24.1)#175 |
| 15. | Sandia Park | 24.2% | 4.1%(+20.1)#15 | 4.3%(+20.0)#236 |
| 16. | Ponderosa Pine | 24.0% | 4.1%(+19.9)#16 | 4.3%(+19.7)#244 |
| 17. | Santa Fe Foothills | 23.1% | 4.1%(+19.0)#17 | 4.3%(+18.9)#262 |
| 18. | Arenas Valley | 23.1% | 4.1%(+18.9)#18 | 4.3%(+18.8)#263 |
| 19. | Magdalena | 23.0% | 4.1%(+18.9)#19 | 4.3%(+18.7)#264 |
| 20. | Puerto De Luna | 17.0% | 4.1%(+12.8)#20 | 4.3%(+12.7)#523 |
| 21. | Sandia Heights | 16.9% | 4.1%(+12.8)#21 | 4.3%(+12.6)#528 |
| 22. | Des Moines | 16.7% | 4.1%(+12.5)#22 | 4.3%(+12.4)#549 |
| 23. | Mesilla | 15.8% | 4.1%(+11.6)#23 | 4.3%(+11.5)#620 |
| 24. | Lindrith | 15.0% | 4.1%(+10.8)#24 | 4.3%(+10.7)#697 |
| 25. | Glorieta | 14.3% | 4.1%(+10.1)#25 | 4.3%(+10.00)#768 |
| 26. | Atoka | 14.1% | 4.1%(+9.92)#26 | 4.3%(+9.77)#811 |
| 27. | Galisteo | 13.8% | 4.1%(+9.71)#27 | 4.3%(+9.56)#833 |
| 28. | Logan | 13.4% | 4.1%(+9.24)#28 | 4.3%(+9.09)#919 |
| 29. | Barton | 12.8% | 4.1%(+8.61)#29 | 4.3%(+8.46)#1,027 |
| 30. | Ranchos De Taos | 12.3% | 4.1%(+8.12)#30 | 4.3%(+7.97)#1,124 |
| 31. | Picacho Hills | 11.8% | 4.1%(+7.69)#31 | 4.3%(+7.55)#1,228 |
| 32. | Nakaibito | 11.8% | 4.1%(+7.63)#32 | 4.3%(+7.48)#1,250 |
| 33. | Placitas Cdp Sandoval County | 11.4% | 4.1%(+7.24)#33 | 4.3%(+7.10)#1,355 |
| 34. | Jaconita | 11.4% | 4.1%(+7.24)#34 | 4.3%(+7.09)#1,357 |
| 35. | Tome | 11.0% | 4.1%(+6.91)#35 | 4.3%(+6.76)#1,448 |
| 36. | Ruidoso Downs | 10.4% | 4.1%(+6.28)#36 | 4.3%(+6.13)#1,635 |
| 37. | High Rolls | 10.1% | 4.1%(+5.93)#37 | 4.3%(+5.78)#1,759 |
| 38. | La Plata | 9.8% | 4.1%(+5.64)#38 | 4.3%(+5.49)#1,886 |
| 39. | San Pablo | 9.6% | 4.1%(+5.45)#39 | 4.3%(+5.30)#1,963 |
| 40. | Eldorado At Santa Fe | 9.5% | 4.1%(+5.37)#40 | 4.3%(+5.22)#2,013 |
| 41. | Jemez Springs | 9.4% | 4.1%(+5.27)#41 | 4.3%(+5.13)#2,057 |
| 42. | Rio Rancho Estates | 9.4% | 4.1%(+5.25)#42 | 4.3%(+5.10)#2,066 |
| 43. | Tano Road | 9.2% | 4.1%(+5.11)#43 | 4.3%(+4.96)#2,137 |
| 44. | Maxwell | 9.2% | 4.1%(+5.10)#44 | 4.3%(+4.96)#2,140 |
| 45. | Spencerville | 8.7% | 4.1%(+4.54)#45 | 4.3%(+4.39)#2,500 |
| 46. | Corrales | 8.5% | 4.1%(+4.39)#46 | 4.3%(+4.25)#2,571 |
| 47. | Fort Wingate | 8.4% | 4.1%(+4.30)#47 | 4.3%(+4.16)#2,649 |
| 48. | Carrizozo | 8.3% | 4.1%(+4.19)#48 | 4.3%(+4.05)#2,706 |
| 49. | Waterflow | 8.2% | 4.1%(+4.10)#49 | 4.3%(+3.95)#2,776 |
| 50. | Los Lunas | 8.1% | 4.1%(+4.00)#50 | 4.3%(+3.86)#2,868 |
| 51. | Las Campanas | 8.1% | 4.1%(+3.94)#51 | 4.3%(+3.79)#2,910 |
| 52. | Cedar Hill | 7.9% | 4.1%(+3.76)#52 | 4.3%(+3.61)#3,067 |
| 53. | Los Chaves | 7.8% | 4.1%(+3.64)#53 | 4.3%(+3.49)#3,175 |
| 54. | Tres Arroyos | 7.7% | 4.1%(+3.61)#54 | 4.3%(+3.46)#3,195 |
| 55. | Taos | 7.7% | 4.1%(+3.57)#55 | 4.3%(+3.42)#3,232 |
| 56. | San Ysidro | 7.7% | 4.1%(+3.55)#56 | 4.3%(+3.41)#3,247 |
| 57. | Haystack | 7.5% | 4.1%(+3.36)#57 | 4.3%(+3.21)#3,434 |
| 58. | Carnuel | 7.4% | 4.1%(+3.28)#58 | 4.3%(+3.14)#3,511 |
| 59. | Santa Rosa | 7.0% | 4.1%(+2.85)#59 | 4.3%(+2.70)#3,981 |
| 60. | Ruidoso | 6.9% | 4.1%(+2.78)#60 | 4.3%(+2.63)#4,065 |
| 61. | Los Ranchos De Albuquerque | 6.9% | 4.1%(+2.71)#61 | 4.3%(+2.57)#4,141 |
| 62. | Bayard | 6.8% | 4.1%(+2.70)#62 | 4.3%(+2.55)#4,168 |
| 63. | Gallup | 6.8% | 4.1%(+2.61)#63 | 4.3%(+2.47)#4,273 |
| 64. | Loving | 6.5% | 4.1%(+2.36)#64 | 4.3%(+2.21)#4,612 |
| 65. | White Rock | 6.5% | 4.1%(+2.36)#65 | 4.3%(+2.21)#4,617 |
| 66. | Cedar Grove | 6.5% | 4.1%(+2.32)#66 | 4.3%(+2.18)#4,657 |
| 67. | Kirtland | 6.4% | 4.1%(+2.24)#67 | 4.3%(+2.10)#4,762 |
| 68. | Kirtland Afb | 6.2% | 4.1%(+2.06)#68 | 4.3%(+1.91)#5,050 |
| 69. | Sedillo | 6.1% | 4.1%(+1.99)#69 | 4.3%(+1.84)#5,169 |
| 70. | El Valle De Arroyo Seco | 6.1% | 4.1%(+1.99)#70 | 4.3%(+1.84)#5,174 |
| 71. | Thoreau | 6.0% | 4.1%(+1.89)#71 | 4.3%(+1.74)#5,329 |
| 72. | Hyde Park | 6.0% | 4.1%(+1.87)#72 | 4.3%(+1.72)#5,364 |
| 73. | Tesuque | 5.8% | 4.1%(+1.69)#73 | 4.3%(+1.54)#5,655 |
| 74. | South River | 5.7% | 4.1%(+1.57)#74 | 4.3%(+1.42)#5,870 |
| 75. | Pinehill | 5.7% | 4.1%(+1.55)#75 | 4.3%(+1.41)#5,902 |
| 76. | Silver City | 5.7% | 4.1%(+1.53)#76 | 4.3%(+1.39)#5,933 |
| 77. | Paa-Ko | 5.6% | 4.1%(+1.42)#77 | 4.3%(+1.27)#6,159 |
| 78. | Hurley | 5.5% | 4.1%(+1.37)#78 | 4.3%(+1.23)#6,243 |
| 79. | Tyrone | 5.4% | 4.1%(+1.31)#79 | 4.3%(+1.16)#6,364 |
| 80. | Cimarron | 5.4% | 4.1%(+1.27)#80 | 4.3%(+1.13)#6,431 |
| 81. | Highland Meadows | 5.4% | 4.1%(+1.27)#81 | 4.3%(+1.12)#6,451 |
| 82. | Skyline Ganipa | 5.3% | 4.1%(+1.19)#82 | 4.3%(+1.05)#6,608 |
| 83. | Farmington | 5.1% | 4.1%(+0.968)#83 | 4.3%(+0.821)#7,118 |
| 84. | Chamisal | 5.1% | 4.1%(+0.956)#84 | 4.3%(+0.810)#7,149 |
| 85. | Albuquerque | 5.1% | 4.1%(+0.949)#85 | 4.3%(+0.802)#7,165 |
| 86. | Grants | 5.0% | 4.1%(+0.910)#86 | 4.3%(+0.763)#7,263 |
| 87. | Los Alamos | 4.8% | 4.1%(+0.612)#87 | 4.3%(+0.465)#7,952 |
| 88. | Vadito | 4.7% | 4.1%(+0.591)#88 | 4.3%(+0.444)#8,008 |
| 89. | Rio Rancho | 4.7% | 4.1%(+0.577)#89 | 4.3%(+0.431)#8,048 |
| 90. | Las Cruces | 4.7% | 4.1%(+0.575)#90 | 4.3%(+0.428)#8,054 |
| 91. | Rio Communities | 4.6% | 4.1%(+0.445)#91 | 4.3%(+0.298)#8,379 |
| 92. | Alcalde | 4.4% | 4.1%(+0.305)#92 | 4.3%(+0.158)#8,777 |
| 93. | La Puebla | 4.3% | 4.1%(+0.197)#93 | 4.3%(+0.050)#9,105 |
| 94. | Cotton City | 4.3% | 4.1%(+0.162)#94 | 4.3%(+0.015)#9,185 |
| 95. | El Cerro | 4.3% | 4.1%(+0.152)#95 | 4.3%(+0.005)#9,209 |
| 96. | Cannon Afb | 4.2% | 4.1%(+0.102)#96 | 4.3%(-0.045)#9,355 |
| 97. | Dulce | 4.1% | 4.1%(-0.006)#97 | 4.3%(-0.153)#9,682 |
| 98. | Holloman Afb | 4.1% | 4.1%(-0.016)#98 | 4.3%(-0.162)#9,711 |
| 99. | Santa Clara Pueblo | 4.1% | 4.1%(-0.058)#99 | 4.3%(-0.204)#9,841 |
| 100. | Church Rock | 4.1% | 4.1%(-0.067)#100 | 4.3%(-0.214)#9,878 |
Common Questions
What are the Top 10 Cities with the Highest Percentage of Population Employed in Health Technologists in New Mexico?
Top 10 Cities with the Highest Percentage of Population Employed in Health Technologists in New Mexico are:
#1
100.0%
#2
55.6%
#3
50.9%
#4
50.0%
#5
33.3%
#6
32.5%
#7
31.3%
#8
30.0%
#9
28.6%
#10
24.2%
What city has the Highest Percentage of Population Employed in Health Technologists in New Mexico?
Mosquero has the Highest Percentage of Population Employed in Health Technologists in New Mexico with 100.0%.
What is the Percentage of Population Employed in Health Technologists in the State of New Mexico?
Percentage of Population Employed in Health Technologists in New Mexico is 4.1%.
What is the Percentage of Population Employed in Health Technologists in the United States?
Percentage of Population Employed in Health Technologists in the United States is 4.3%.