Cities with the Highest Percentage of Population Employed in Health Technologists in Indiana
RELATED REPORTS & OPTIONS
Health Technologists
Indiana
Compare Cities
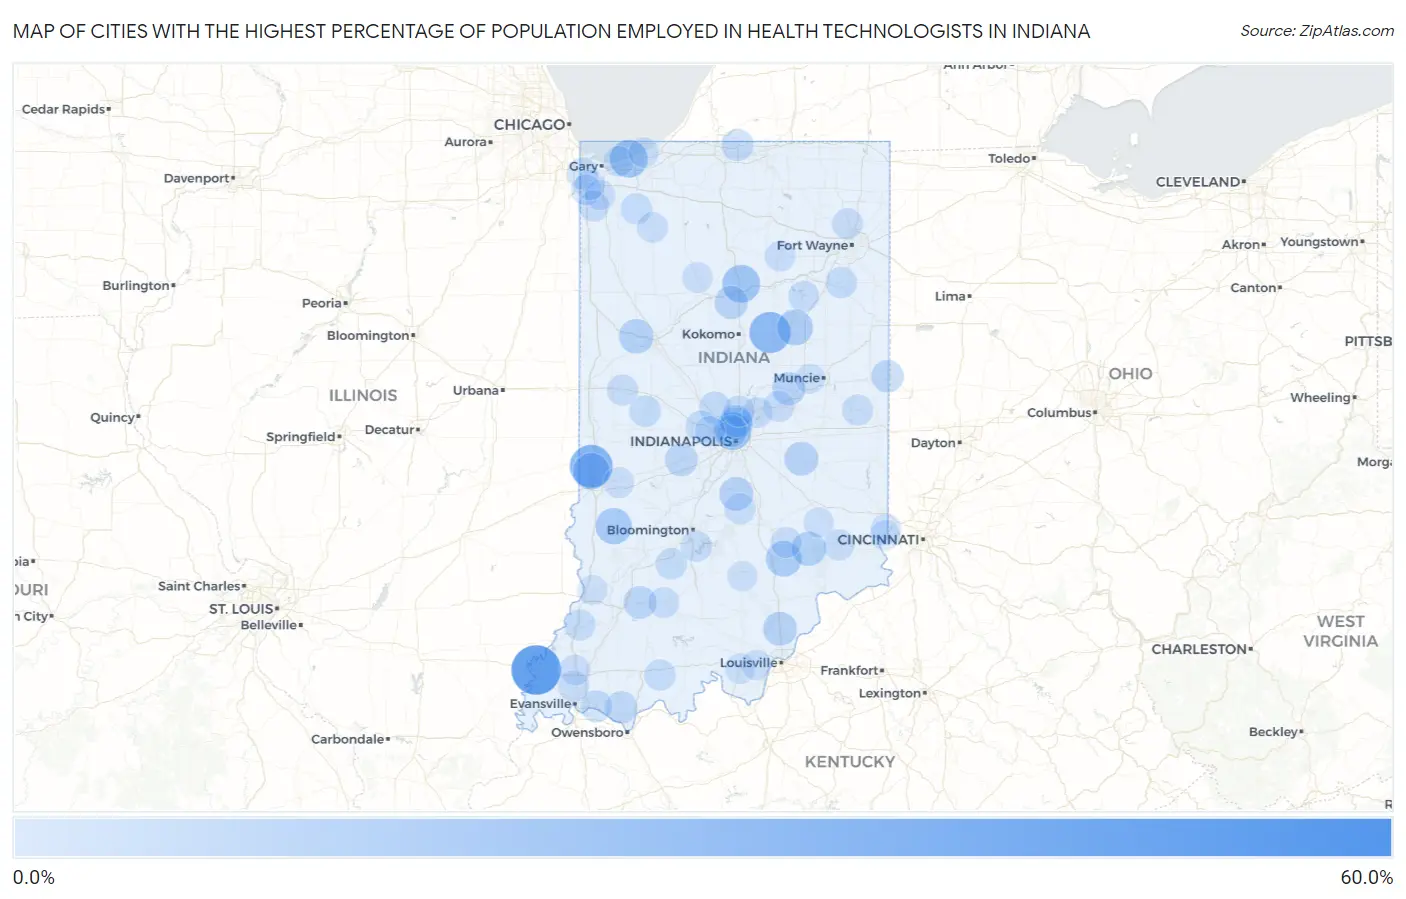
Map of Cities with the Highest Percentage of Population Employed in Health Technologists in Indiana
0.0%
60.0%
Cities with the Highest Percentage of Population Employed in Health Technologists in Indiana
| City | % Employed | vs State | vs National | |
| 1. | Tocsin | 58.4% | 4.5%(+53.9)#1 | 4.3%(+54.1)#24 |
| 2. | Griffin | 50.0% | 4.5%(+45.5)#2 | 4.3%(+45.7)#42 |
| 3. | Paris Crossing | 46.7% | 4.5%(+42.2)#3 | 4.3%(+42.4)#52 |
| 4. | Mariah Hill | 46.0% | 4.5%(+41.6)#4 | 4.3%(+41.7)#54 |
| 5. | Shepardsville | 34.8% | 4.5%(+30.3)#5 | 4.3%(+30.5)#103 |
| 6. | Nyona Lake | 33.3% | 4.5%(+28.9)#6 | 4.3%(+29.0)#113 |
| 7. | Newbern | 31.9% | 4.5%(+27.5)#7 | 4.3%(+27.6)#133 |
| 8. | Sims | 31.0% | 4.5%(+26.6)#8 | 4.3%(+26.7)#148 |
| 9. | St. Anthony | 24.7% | 4.5%(+20.2)#9 | 4.3%(+20.4)#224 |
| 10. | Dune Acres | 23.7% | 4.5%(+19.3)#10 | 4.3%(+19.4)#252 |
| 11. | Spring Hill | 23.3% | 4.5%(+18.9)#11 | 4.3%(+19.0)#259 |
| 12. | Mexico | 23.3% | 4.5%(+18.9)#12 | 4.3%(+19.0)#260 |
| 13. | Tecumseh | 20.5% | 4.5%(+16.1)#13 | 4.3%(+16.2)#344 |
| 14. | Bretzville | 20.5% | 4.5%(+16.0)#14 | 4.3%(+16.2)#345 |
| 15. | Coalmont | 20.1% | 4.5%(+15.7)#15 | 4.3%(+15.8)#359 |
| 16. | Lucerne | 19.7% | 4.5%(+15.3)#16 | 4.3%(+15.4)#375 |
| 17. | Marion | 19.3% | 4.5%(+14.8)#17 | 4.3%(+15.0)#399 |
| 18. | Hayden | 18.9% | 4.5%(+14.4)#18 | 4.3%(+14.6)#420 |
| 19. | Kramer | 17.9% | 4.5%(+13.5)#19 | 4.3%(+13.7)#472 |
| 20. | Oakville | 16.7% | 4.5%(+12.2)#20 | 4.3%(+12.4)#546 |
| 21. | Montmorenci | 16.1% | 4.5%(+11.7)#21 | 4.3%(+11.8)#592 |
| 22. | Butlerville | 16.0% | 4.5%(+11.6)#22 | 4.3%(+11.8)#602 |
| 23. | Bowling Green | 15.7% | 4.5%(+11.3)#23 | 4.3%(+11.4)#623 |
| 24. | Memphis | 15.0% | 4.5%(+10.5)#24 | 4.3%(+10.7)#695 |
| 25. | Arlington | 14.8% | 4.5%(+10.4)#25 | 4.3%(+10.5)#707 |
| 26. | Trafalgar | 14.8% | 4.5%(+10.4)#26 | 4.3%(+10.5)#714 |
| 27. | Bippus | 14.5% | 4.5%(+10.1)#27 | 4.3%(+10.3)#746 |
| 28. | Grammer | 14.2% | 4.5%(+9.75)#28 | 4.3%(+9.92)#785 |
| 29. | Johnson | 14.1% | 4.5%(+9.61)#29 | 4.3%(+9.78)#809 |
| 30. | Onward | 13.7% | 4.5%(+9.24)#30 | 4.3%(+9.41)#863 |
| 31. | Woodlawn Heights | 13.5% | 4.5%(+9.01)#31 | 4.3%(+9.18)#903 |
| 32. | Cannelburg | 12.7% | 4.5%(+8.27)#32 | 4.3%(+8.44)#1,033 |
| 33. | Stilesville | 12.5% | 4.5%(+8.04)#33 | 4.3%(+8.21)#1,077 |
| 34. | Antioch | 12.5% | 4.5%(+8.04)#34 | 4.3%(+8.21)#1,080 |
| 35. | Benton | 12.3% | 4.5%(+7.88)#35 | 4.3%(+8.05)#1,115 |
| 36. | Meridian Hills | 12.0% | 4.5%(+7.55)#36 | 4.3%(+7.72)#1,179 |
| 37. | Union City | 11.8% | 4.5%(+7.37)#37 | 4.3%(+7.54)#1,231 |
| 38. | Richland | 11.7% | 4.5%(+7.27)#38 | 4.3%(+7.44)#1,260 |
| 39. | Arcola | 11.6% | 4.5%(+7.19)#39 | 4.3%(+7.36)#1,277 |
| 40. | Philadelphia | 11.3% | 4.5%(+6.86)#40 | 4.3%(+7.03)#1,372 |
| 41. | Westwood | 11.1% | 4.5%(+6.61)#41 | 4.3%(+6.78)#1,442 |
| 42. | Williams Creek | 10.9% | 4.5%(+6.49)#42 | 4.3%(+6.66)#1,471 |
| 43. | Spencerville | 10.7% | 4.5%(+6.24)#43 | 4.3%(+6.41)#1,545 |
| 44. | Zionsville | 10.7% | 4.5%(+6.22)#44 | 4.3%(+6.39)#1,551 |
| 45. | Granger | 10.7% | 4.5%(+6.21)#45 | 4.3%(+6.38)#1,554 |
| 46. | Wynnedale | 10.4% | 4.5%(+5.98)#46 | 4.3%(+6.15)#1,628 |
| 47. | Newburgh | 10.4% | 4.5%(+5.94)#47 | 4.3%(+6.11)#1,640 |
| 48. | Schnellville | 10.4% | 4.5%(+5.92)#48 | 4.3%(+6.08)#1,649 |
| 49. | Harrison Lake | 10.3% | 4.5%(+5.89)#49 | 4.3%(+6.06)#1,663 |
| 50. | Lake Holiday | 9.9% | 4.5%(+5.41)#50 | 4.3%(+5.58)#1,847 |
| 51. | Pittsboro | 9.8% | 4.5%(+5.35)#51 | 4.3%(+5.52)#1,876 |
| 52. | Munster | 9.6% | 4.5%(+5.16)#52 | 4.3%(+5.33)#1,950 |
| 53. | Owensburg | 9.5% | 4.5%(+5.07)#53 | 4.3%(+5.24)#1,997 |
| 54. | Uniondale | 9.5% | 4.5%(+5.07)#54 | 4.3%(+5.24)#1,998 |
| 55. | Kouts | 9.4% | 4.5%(+4.91)#55 | 4.3%(+5.08)#2,078 |
| 56. | St Meinrad | 9.3% | 4.5%(+4.85)#56 | 4.3%(+5.02)#2,108 |
| 57. | Cory | 9.3% | 4.5%(+4.85)#57 | 4.3%(+5.02)#2,113 |
| 58. | Carmel | 9.2% | 4.5%(+4.78)#58 | 4.3%(+4.95)#2,146 |
| 59. | Versailles | 9.2% | 4.5%(+4.71)#59 | 4.3%(+4.88)#2,177 |
| 60. | Pendleton | 9.1% | 4.5%(+4.66)#60 | 4.3%(+4.83)#2,206 |
| 61. | Cordry Sweetwater Lakes | 9.1% | 4.5%(+4.65)#61 | 4.3%(+4.82)#2,212 |
| 62. | Ramsey | 9.1% | 4.5%(+4.64)#62 | 4.3%(+4.80)#2,219 |
| 63. | Shipshewana Lake | 9.1% | 4.5%(+4.64)#63 | 4.3%(+4.80)#2,225 |
| 64. | Decker | 9.1% | 4.5%(+4.64)#64 | 4.3%(+4.80)#2,230 |
| 65. | Economy | 9.1% | 4.5%(+4.64)#65 | 4.3%(+4.80)#2,233 |
| 66. | Smithville Sanders | 9.1% | 4.5%(+4.62)#66 | 4.3%(+4.79)#2,249 |
| 67. | Huntertown | 9.0% | 4.5%(+4.57)#67 | 4.3%(+4.74)#2,270 |
| 68. | Underwood | 8.8% | 4.5%(+4.38)#68 | 4.3%(+4.55)#2,391 |
| 69. | Bethel | 8.8% | 4.5%(+4.38)#69 | 4.3%(+4.55)#2,392 |
| 70. | Darmstadt | 8.8% | 4.5%(+4.37)#70 | 4.3%(+4.54)#2,393 |
| 71. | Merriam | 8.8% | 4.5%(+4.30)#71 | 4.3%(+4.47)#2,433 |
| 72. | Hillsboro | 8.7% | 4.5%(+4.24)#72 | 4.3%(+4.41)#2,481 |
| 73. | Charlottesville | 8.6% | 4.5%(+4.19)#73 | 4.3%(+4.36)#2,516 |
| 74. | Scipio | 8.5% | 4.5%(+4.02)#74 | 4.3%(+4.19)#2,622 |
| 75. | Mount Etna | 8.4% | 4.5%(+3.98)#75 | 4.3%(+4.15)#2,654 |
| 76. | Lake Dalecarlia | 8.4% | 4.5%(+3.91)#76 | 4.3%(+4.08)#2,696 |
| 77. | Shoals | 8.3% | 4.5%(+3.88)#77 | 4.3%(+4.05)#2,709 |
| 78. | Floyds Knobs | 8.3% | 4.5%(+3.82)#78 | 4.3%(+3.99)#2,749 |
| 79. | St John | 8.2% | 4.5%(+3.75)#79 | 4.3%(+3.92)#2,801 |
| 80. | Haubstadt | 8.2% | 4.5%(+3.73)#80 | 4.3%(+3.90)#2,823 |
| 81. | San Pierre | 8.1% | 4.5%(+3.66)#81 | 4.3%(+3.83)#2,884 |
| 82. | Royal Center | 8.0% | 4.5%(+3.51)#82 | 4.3%(+3.68)#3,002 |
| 83. | North Manchester | 7.9% | 4.5%(+3.43)#83 | 4.3%(+3.60)#3,084 |
| 84. | Staunton | 7.8% | 4.5%(+3.39)#84 | 4.3%(+3.56)#3,113 |
| 85. | Brownsburg | 7.8% | 4.5%(+3.36)#85 | 4.3%(+3.53)#3,142 |
| 86. | Lake Eliza | 7.8% | 4.5%(+3.33)#86 | 4.3%(+3.50)#3,162 |
| 87. | Ogden Dunes | 7.8% | 4.5%(+3.31)#87 | 4.3%(+3.48)#3,180 |
| 88. | Crown Point | 7.8% | 4.5%(+3.31)#88 | 4.3%(+3.48)#3,183 |
| 89. | Fishers | 7.8% | 4.5%(+3.30)#89 | 4.3%(+3.47)#3,187 |
| 90. | Grandview Lake | 7.4% | 4.5%(+2.97)#90 | 4.3%(+3.14)#3,512 |
| 91. | Corydon | 7.3% | 4.5%(+2.86)#91 | 4.3%(+3.03)#3,609 |
| 92. | Vallonia | 7.3% | 4.5%(+2.86)#92 | 4.3%(+3.03)#3,615 |
| 93. | Hidden Valley | 7.3% | 4.5%(+2.85)#93 | 4.3%(+3.01)#3,625 |
| 94. | Millhousen | 7.3% | 4.5%(+2.80)#94 | 4.3%(+2.97)#3,659 |
| 95. | Schererville | 7.3% | 4.5%(+2.80)#95 | 4.3%(+2.97)#3,660 |
| 96. | Bruceville | 7.2% | 4.5%(+2.74)#96 | 4.3%(+2.91)#3,731 |
| 97. | Lanesville | 7.2% | 4.5%(+2.73)#97 | 4.3%(+2.90)#3,739 |
| 98. | Yorktown | 7.2% | 4.5%(+2.71)#98 | 4.3%(+2.88)#3,760 |
| 99. | Beverly Shores | 7.1% | 4.5%(+2.69)#99 | 4.3%(+2.86)#3,787 |
| 100. | Greendale | 7.0% | 4.5%(+2.59)#100 | 4.3%(+2.76)#3,917 |
Common Questions
What are the Top 10 Cities with the Highest Percentage of Population Employed in Health Technologists in Indiana?
Top 10 Cities with the Highest Percentage of Population Employed in Health Technologists in Indiana are:
#1
50.0%
#2
34.8%
#3
31.0%
#4
23.7%
#5
23.3%
#6
23.3%
#7
20.5%
#8
20.1%
#9
19.3%
#10
18.9%
What city has the Highest Percentage of Population Employed in Health Technologists in Indiana?
Griffin has the Highest Percentage of Population Employed in Health Technologists in Indiana with 50.0%.
What is the Percentage of Population Employed in Health Technologists in the State of Indiana?
Percentage of Population Employed in Health Technologists in Indiana is 4.5%.
What is the Percentage of Population Employed in Health Technologists in the United States?
Percentage of Population Employed in Health Technologists in the United States is 4.3%.