Ferndale, CA Map & Demographics
Ferndale Map
Ferndale Overview
$38,203
PER CAPITA INCOME
$77,917
AVG FAMILY INCOME
$64,028
AVG HOUSEHOLD INCOME
37.7%
WAGE / INCOME GAP [ % ]
62.3¢/ $1
WAGE / INCOME GAP [ $ ]
0.44
INEQUALITY / GINI INDEX
1,569
TOTAL POPULATION
748
MALE POPULATION
821
FEMALE POPULATION
91.11
MALES / 100 FEMALES
109.76
FEMALES / 100 MALES
53.1
MEDIAN AGE
3.0
AVG FAMILY SIZE
2.4
AVG HOUSEHOLD SIZE
653
LABOR FORCE [ PEOPLE ]
48.2%
PERCENT IN LABOR FORCE
8.7%
UNEMPLOYMENT RATE
Ferndale Zip Codes
Ferndale Area Codes
Income in Ferndale
Income Overview in Ferndale
Per Capita Income in Ferndale is $38,203, while median incomes of families and households are $77,917 and $64,028 respectively.
| Characteristic | Number | Measure |
| Per Capita Income | 1,569 | $38,203 |
| Median Family Income | 409 | $77,917 |
| Mean Family Income | 409 | $107,046 |
| Median Household Income | 662 | $64,028 |
| Mean Household Income | 662 | $85,632 |
| Income Deficit | 409 | $0 |
| Wage / Income Gap (%) | 1,569 | 37.67% |
| Wage / Income Gap ($) | 1,569 | 62.33¢ per $1 |
| Gini / Inequality Index | 1,569 | 0.44 |
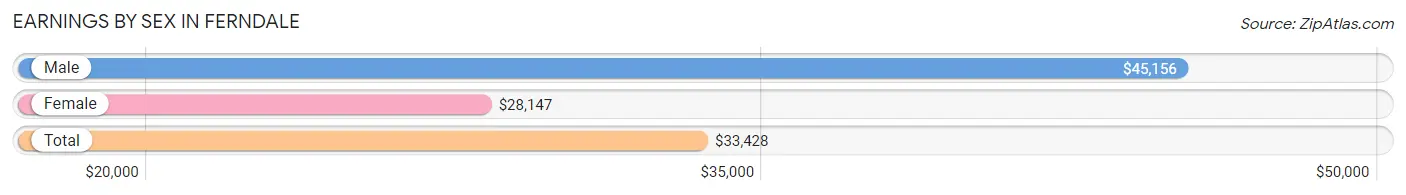
Earnings by Sex in Ferndale
Average Earnings in Ferndale are $33,428, $45,156 for men and $28,147 for women, a difference of 37.7%.
| Sex | Number | Average Earnings |
| Male | 352 (47.8%) | $45,156 |
| Female | 385 (52.2%) | $28,147 |
| Total | 737 (100.0%) | $33,428 |
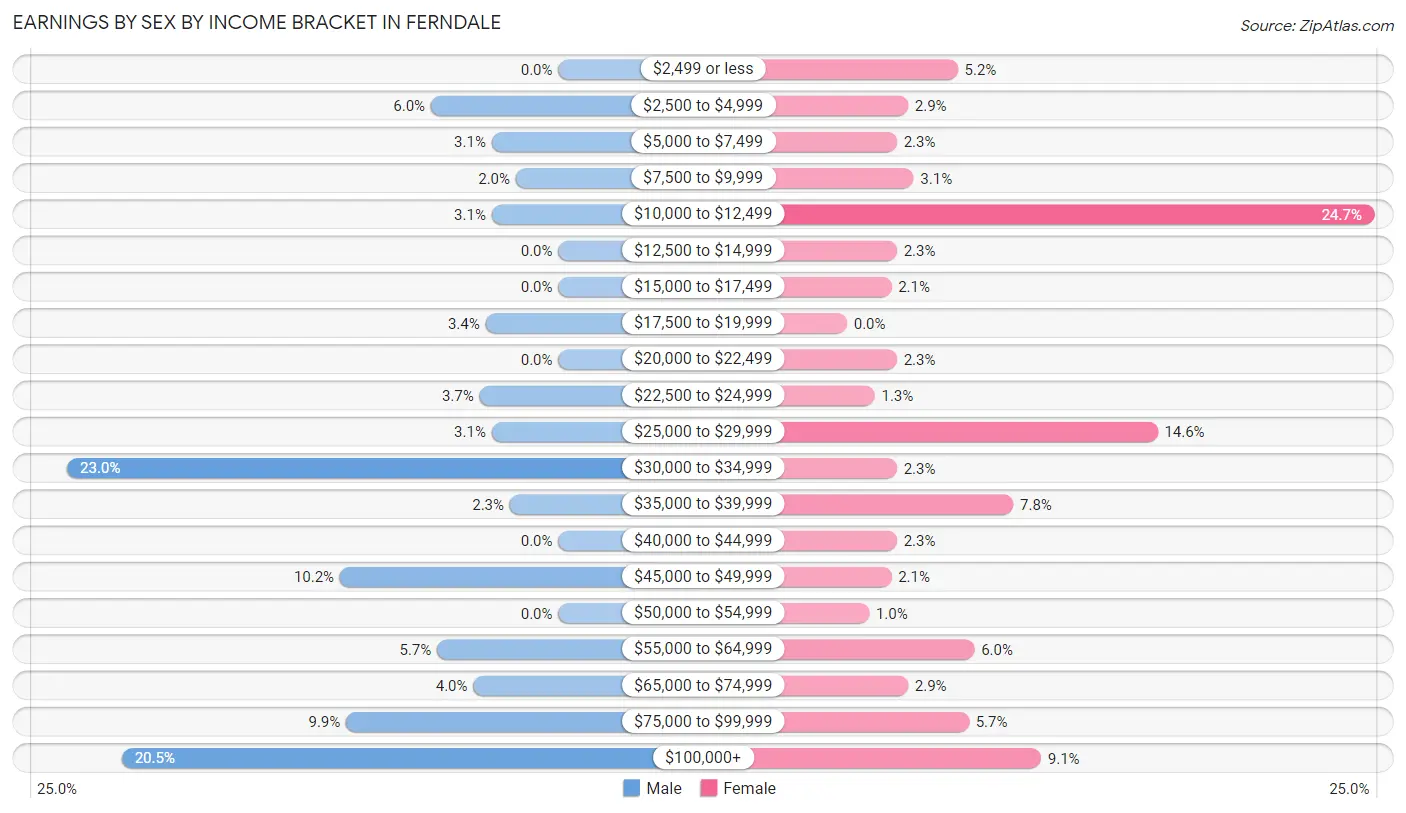
Earnings by Sex by Income Bracket in Ferndale
The most common earnings brackets in Ferndale are $30,000 to $34,999 for men (81 | 23.0%) and $10,000 to $12,499 for women (95 | 24.7%).
| Income | Male | Female |
| $2,499 or less | 0 (0.0%) | 20 (5.2%) |
| $2,500 to $4,999 | 21 (6.0%) | 11 (2.9%) |
| $5,000 to $7,499 | 11 (3.1%) | 9 (2.3%) |
| $7,500 to $9,999 | 7 (2.0%) | 12 (3.1%) |
| $10,000 to $12,499 | 11 (3.1%) | 95 (24.7%) |
| $12,500 to $14,999 | 0 (0.0%) | 9 (2.3%) |
| $15,000 to $17,499 | 0 (0.0%) | 8 (2.1%) |
| $17,500 to $19,999 | 12 (3.4%) | 0 (0.0%) |
| $20,000 to $22,499 | 0 (0.0%) | 9 (2.3%) |
| $22,500 to $24,999 | 13 (3.7%) | 5 (1.3%) |
| $25,000 to $29,999 | 11 (3.1%) | 56 (14.5%) |
| $30,000 to $34,999 | 81 (23.0%) | 9 (2.3%) |
| $35,000 to $39,999 | 8 (2.3%) | 30 (7.8%) |
| $40,000 to $44,999 | 0 (0.0%) | 9 (2.3%) |
| $45,000 to $49,999 | 36 (10.2%) | 8 (2.1%) |
| $50,000 to $54,999 | 0 (0.0%) | 4 (1.0%) |
| $55,000 to $64,999 | 20 (5.7%) | 23 (6.0%) |
| $65,000 to $74,999 | 14 (4.0%) | 11 (2.9%) |
| $75,000 to $99,999 | 35 (9.9%) | 22 (5.7%) |
| $100,000+ | 72 (20.4%) | 35 (9.1%) |
| Total | 352 (100.0%) | 385 (100.0%) |
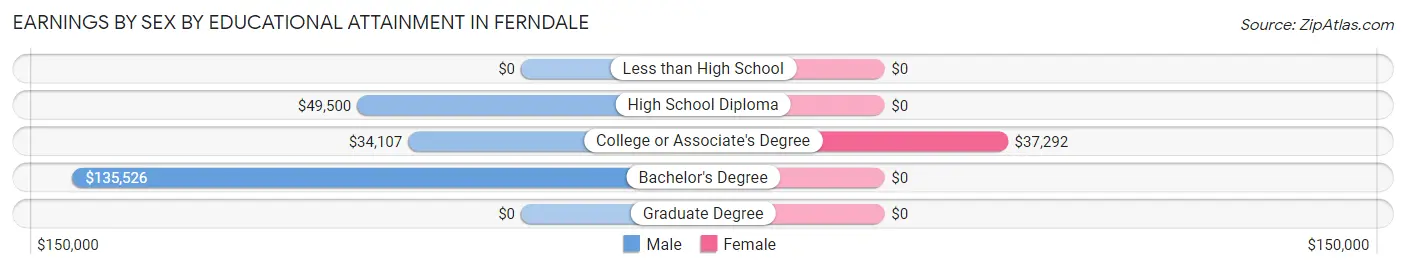
Earnings by Sex by Educational Attainment in Ferndale
Average earnings in Ferndale are $48,750 for men and $33,889 for women, a difference of 30.5%. Men with an educational attainment of bachelor's degree enjoy the highest average annual earnings of $135,526, while those with college or associate's degree education earn the least with $34,107. Women with an educational attainment of college or associate's degree earn the most with the average annual earnings of $37,292, while those with college or associate's degree education have the smallest earnings of $37,292.
| Educational Attainment | Male Income | Female Income |
| Less than High School | - | - |
| High School Diploma | $49,500 | $0 |
| College or Associate's Degree | $34,107 | $37,292 |
| Bachelor's Degree | $135,526 | $0 |
| Graduate Degree | - | - |
| Total | $48,750 | $33,889 |
Family Income in Ferndale
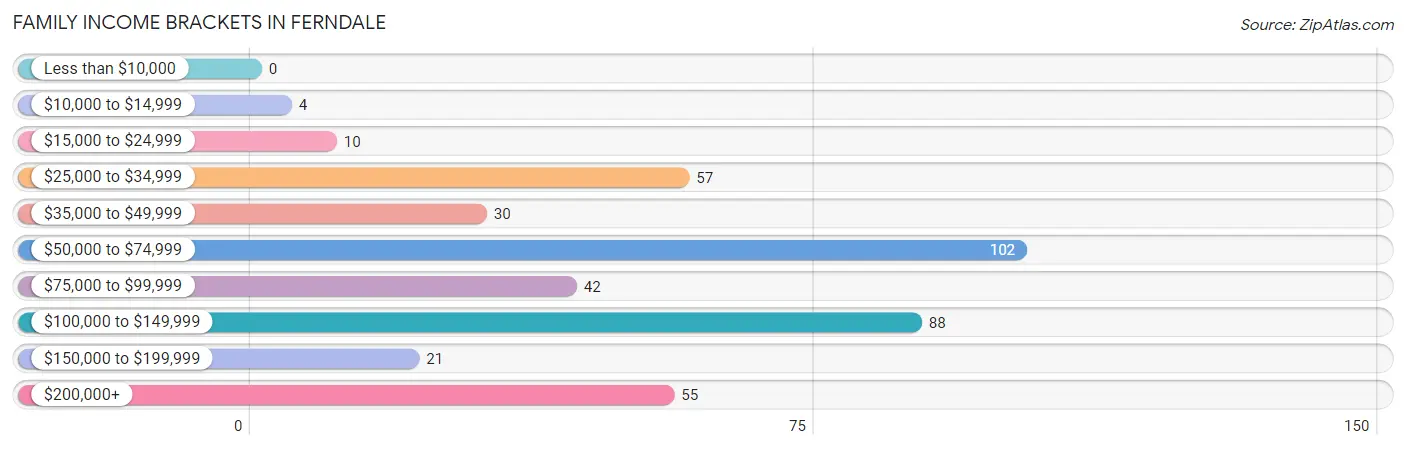
Family Income Brackets in Ferndale
According to the Ferndale family income data, there are 102 families falling into the $50,000 to $74,999 income range, which is the most common income bracket and makes up 24.9% of all families.
| Income Bracket | # Families | % Families |
| Less than $10,000 | 0 | 0.0% |
| $10,000 to $14,999 | 4 | 1.0% |
| $15,000 to $24,999 | 10 | 2.4% |
| $25,000 to $34,999 | 57 | 13.9% |
| $35,000 to $49,999 | 30 | 7.3% |
| $50,000 to $74,999 | 102 | 24.9% |
| $75,000 to $99,999 | 42 | 10.3% |
| $100,000 to $149,999 | 88 | 21.5% |
| $150,000 to $199,999 | 21 | 5.1% |
| $200,000+ | 55 | 13.4% |
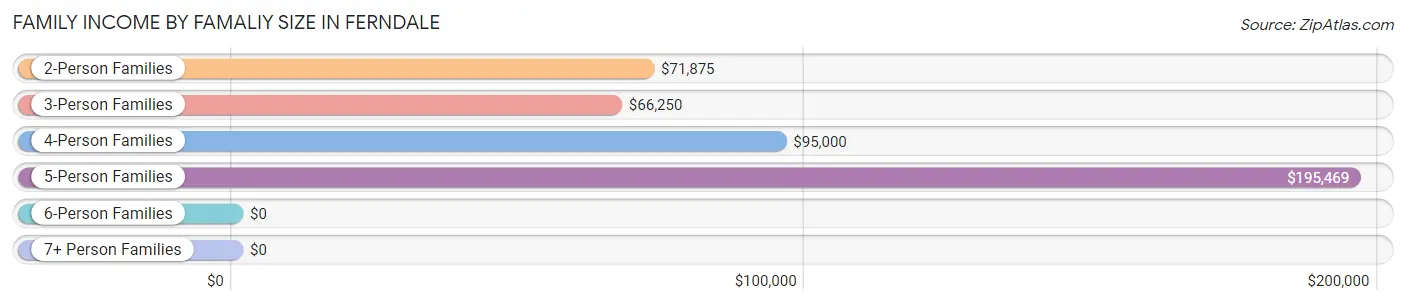
Family Income by Famaliy Size in Ferndale
5-person families (55 | 13.5%) account for the highest median family income in Ferndale with $195,469 per family, while 5-person families (55 | 13.5%) have the highest median income of $39,094 per family member.
| Income Bracket | # Families | Median Income |
| 2-Person Families | 269 (65.8%) | $71,875 |
| 3-Person Families | 32 (7.8%) | $66,250 |
| 4-Person Families | 40 (9.8%) | $95,000 |
| 5-Person Families | 55 (13.5%) | $195,469 |
| 6-Person Families | 13 (3.2%) | $0 |
| 7+ Person Families | 0 (0.0%) | $0 |
| Total | 409 (100.0%) | $77,917 |
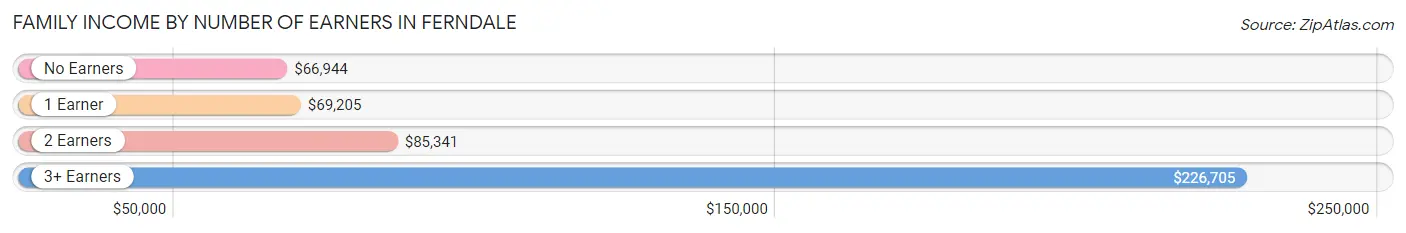
Family Income by Number of Earners in Ferndale
The median family income in Ferndale is $77,917, with families comprising 3+ earners (27) having the highest median family income of $226,705, while families with no earners (126) have the lowest median family income of $66,944, accounting for 6.6% and 30.8% of families, respectively.
| Number of Earners | # Families | Median Income |
| No Earners | 126 (30.8%) | $66,944 |
| 1 Earner | 123 (30.1%) | $69,205 |
| 2 Earners | 133 (32.5%) | $85,341 |
| 3+ Earners | 27 (6.6%) | $226,705 |
| Total | 409 (100.0%) | $77,917 |
Household Income in Ferndale
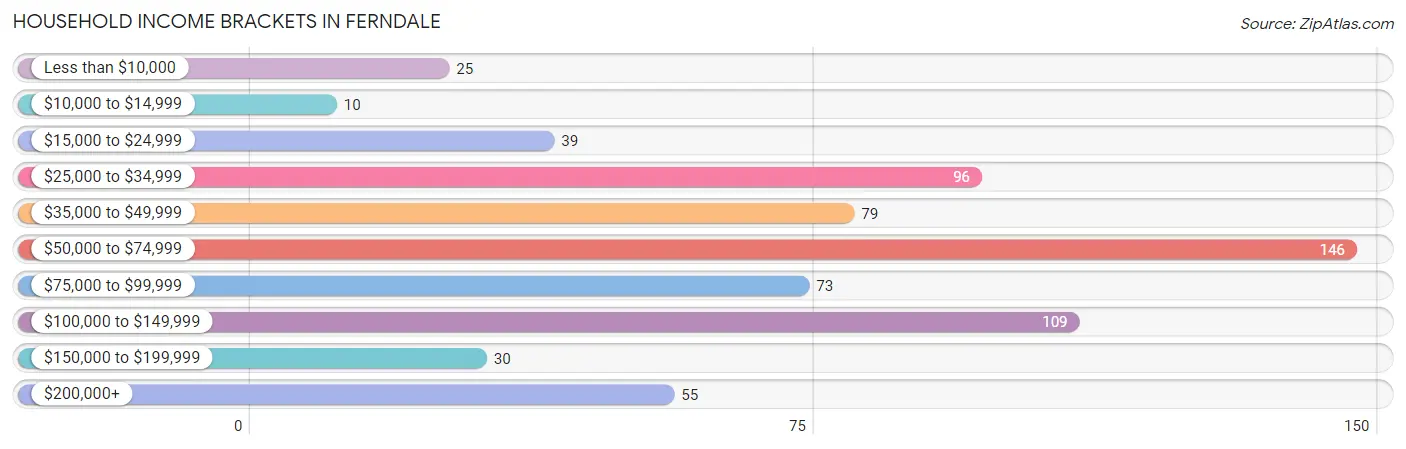
Household Income Brackets in Ferndale
With 146 households falling in the category, the $50,000 to $74,999 income range is the most frequent in Ferndale, accounting for 22.1% of all households. In contrast, only 10 households (1.5%) fall into the $10,000 to $14,999 income bracket, making it the least populous group.
| Income Bracket | # Households | % Households |
| Less than $10,000 | 25 | 3.8% |
| $10,000 to $14,999 | 10 | 1.5% |
| $15,000 to $24,999 | 39 | 5.9% |
| $25,000 to $34,999 | 96 | 14.5% |
| $35,000 to $49,999 | 79 | 11.9% |
| $50,000 to $74,999 | 146 | 22.1% |
| $75,000 to $99,999 | 73 | 11.0% |
| $100,000 to $149,999 | 109 | 16.5% |
| $150,000 to $199,999 | 30 | 4.5% |
| $200,000+ | 55 | 8.3% |
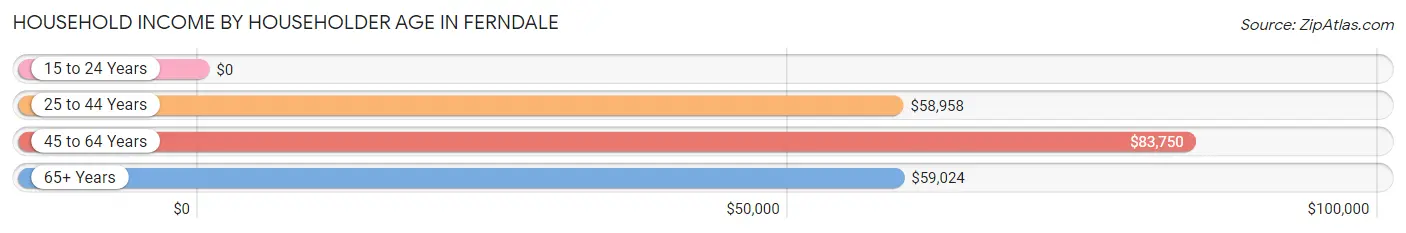
Household Income by Householder Age in Ferndale
The median household income in Ferndale is $64,028, with the highest median household income of $83,750 found in the 45 to 64 years age bracket for the primary householder. A total of 190 households (28.7%) fall into this category. Meanwhile, the 15 to 24 years age bracket for the primary householder has the lowest median household income of $0, with 15 households (2.3%) in this group.
| Income Bracket | # Households | Median Income |
| 15 to 24 Years | 15 (2.3%) | $0 |
| 25 to 44 Years | 139 (21.0%) | $58,958 |
| 45 to 64 Years | 190 (28.7%) | $83,750 |
| 65+ Years | 318 (48.0%) | $59,024 |
| Total | 662 (100.0%) | $64,028 |
Poverty in Ferndale
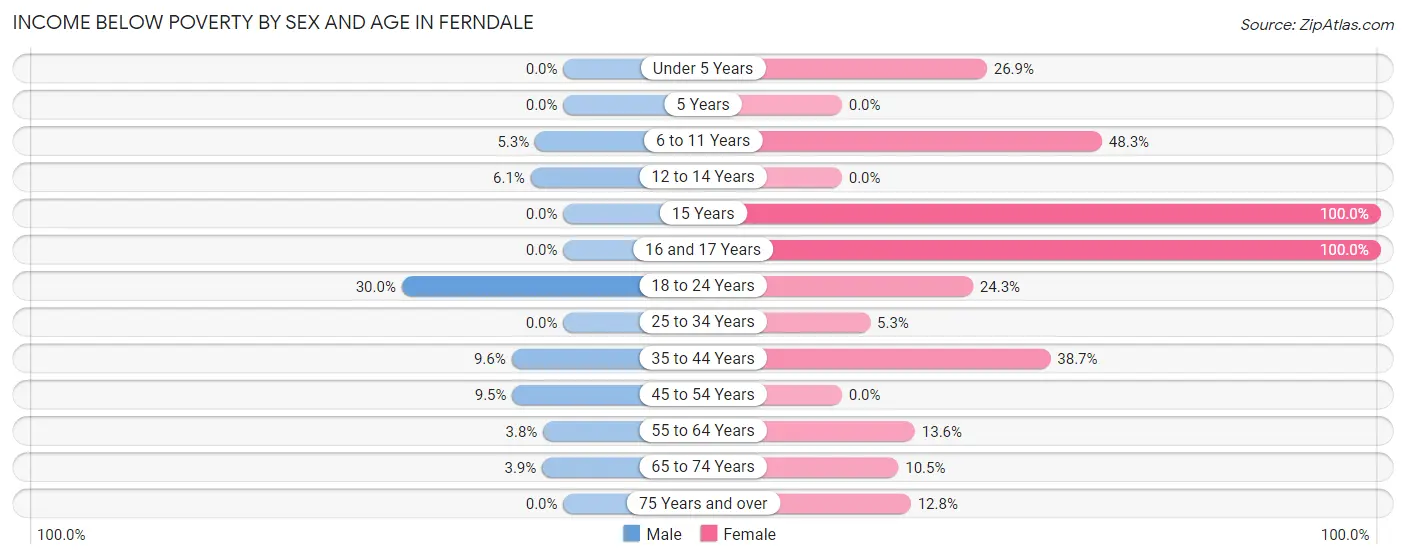
Income Below Poverty by Sex and Age in Ferndale
With 5.7% poverty level for males and 17.7% for females among the residents of Ferndale, 18 to 24 year old males and 15 year old females are the most vulnerable to poverty, with 15 males (30.0%) and 10 females (100.0%) in their respective age groups living below the poverty level.
| Age Bracket | Male | Female |
| Under 5 Years | 0 (0.0%) | 7 (26.9%) |
| 5 Years | 0 (0.0%) | 0 (0.0%) |
| 6 to 11 Years | 2 (5.3%) | 14 (48.3%) |
| 12 to 14 Years | 2 (6.1%) | 0 (0.0%) |
| 15 Years | 0 (0.0%) | 10 (100.0%) |
| 16 and 17 Years | 0 (0.0%) | 2 (100.0%) |
| 18 to 24 Years | 15 (30.0%) | 37 (24.3%) |
| 25 to 34 Years | 0 (0.0%) | 4 (5.3%) |
| 35 to 44 Years | 5 (9.6%) | 24 (38.7%) |
| 45 to 54 Years | 7 (9.5%) | 0 (0.0%) |
| 55 to 64 Years | 6 (3.7%) | 16 (13.6%) |
| 65 to 74 Years | 5 (3.9%) | 15 (10.5%) |
| 75 Years and over | 0 (0.0%) | 16 (12.8%) |
| Total | 42 (5.7%) | 145 (17.7%) |
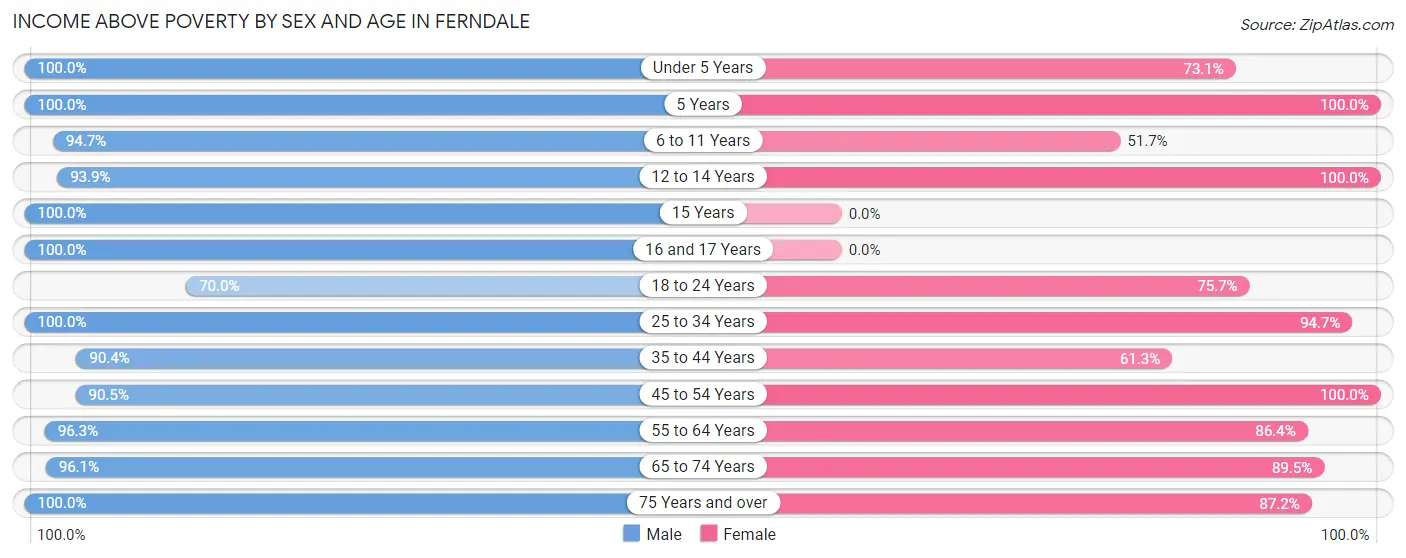
Income Above Poverty by Sex and Age in Ferndale
According to the poverty statistics in Ferndale, males aged under 5 years and females aged 5 years are the age groups that are most secure financially, with 100.0% of males and 100.0% of females in these age groups living above the poverty line.
| Age Bracket | Male | Female |
| Under 5 Years | 22 (100.0%) | 19 (73.1%) |
| 5 Years | 7 (100.0%) | 9 (100.0%) |
| 6 to 11 Years | 36 (94.7%) | 15 (51.7%) |
| 12 to 14 Years | 31 (93.9%) | 17 (100.0%) |
| 15 Years | 9 (100.0%) | 0 (0.0%) |
| 16 and 17 Years | 23 (100.0%) | 0 (0.0%) |
| 18 to 24 Years | 35 (70.0%) | 115 (75.7%) |
| 25 to 34 Years | 44 (100.0%) | 72 (94.7%) |
| 35 to 44 Years | 47 (90.4%) | 38 (61.3%) |
| 45 to 54 Years | 67 (90.5%) | 52 (100.0%) |
| 55 to 64 Years | 154 (96.3%) | 102 (86.4%) |
| 65 to 74 Years | 122 (96.1%) | 128 (89.5%) |
| 75 Years and over | 94 (100.0%) | 109 (87.2%) |
| Total | 691 (94.3%) | 676 (82.3%) |
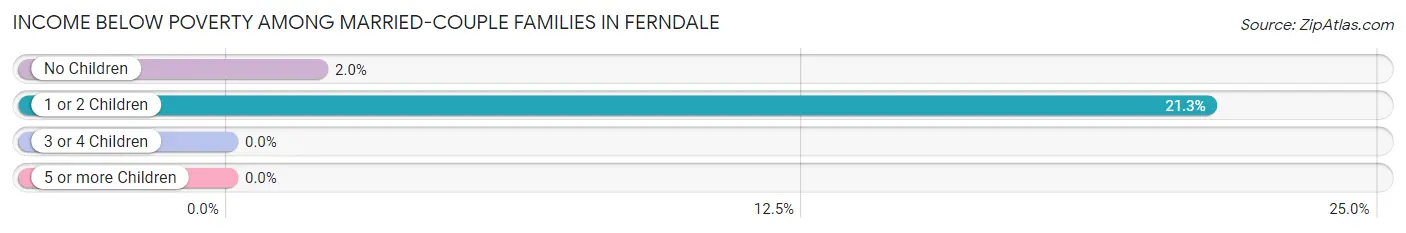
Income Below Poverty Among Married-Couple Families in Ferndale
The poverty statistics for married-couple families in Ferndale show that 5.9% or 17 of the total 288 families live below the poverty line. Families with 1 or 2 children have the highest poverty rate of 21.3%, comprising of 13 families. On the other hand, families with 3 or 4 children have the lowest poverty rate of 0.0%, which includes 0 families.
| Children | Above Poverty | Below Poverty |
| No Children | 200 (98.0%) | 4 (2.0%) |
| 1 or 2 Children | 48 (78.7%) | 13 (21.3%) |
| 3 or 4 Children | 23 (100.0%) | 0 (0.0%) |
| 5 or more Children | 0 (0.0%) | 0 (0.0%) |
| Total | 271 (94.1%) | 17 (5.9%) |
Income Below Poverty Among Single-Parent Households in Ferndale
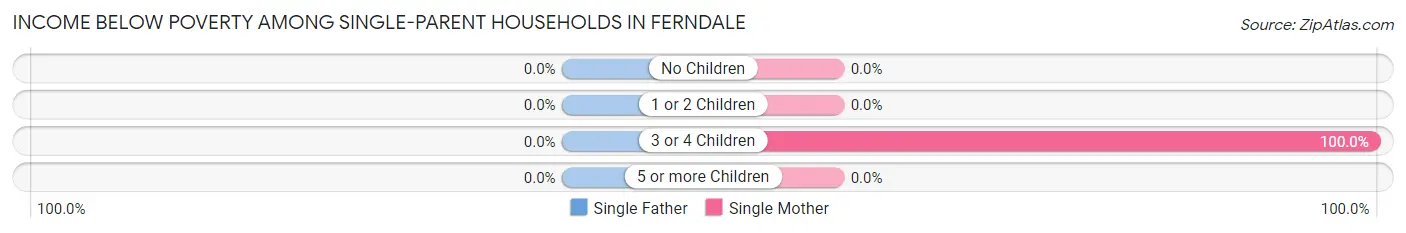
| Children | Single Father | Single Mother |
| No Children | 0 (0.0%) | 0 (0.0%) |
| 1 or 2 Children | 0 (0.0%) | 0 (0.0%) |
| 3 or 4 Children | 0 (0.0%) | 3 (100.0%) |
| 5 or more Children | 0 (0.0%) | 0 (0.0%) |
| Total | 0 (0.0%) | 3 (3.7%) |
Income Below Poverty Among Married-Couple vs Single-Parent Households in Ferndale
The poverty data for Ferndale shows that 17 of the married-couple family households (5.9%) and 3 of the single-parent households (2.5%) are living below the poverty level. Within the married-couple family households, those with 1 or 2 children have the highest poverty rate, with 13 households (21.3%) falling below the poverty line. Among the single-parent households, those with 3 or 4 children have the highest poverty rate, with 3 household (100.0%) living below poverty.
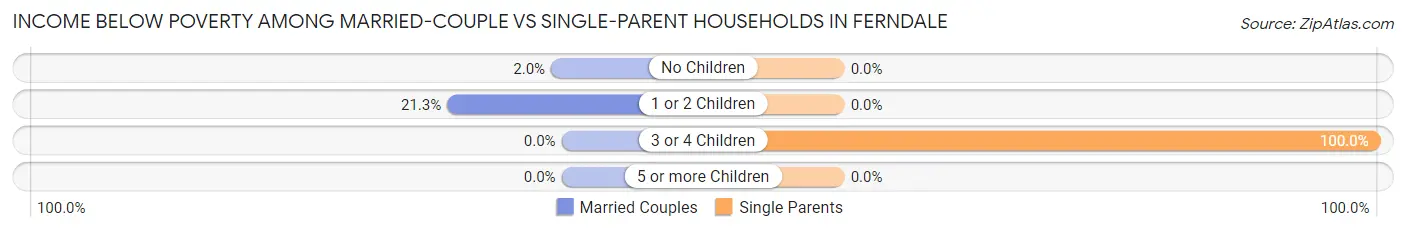
| Children | Married-Couple Families | Single-Parent Households |
| No Children | 4 (2.0%) | 0 (0.0%) |
| 1 or 2 Children | 13 (21.3%) | 0 (0.0%) |
| 3 or 4 Children | 0 (0.0%) | 3 (100.0%) |
| 5 or more Children | 0 (0.0%) | 0 (0.0%) |
| Total | 17 (5.9%) | 3 (2.5%) |
Race in Ferndale
The most populous races in Ferndale are White / Caucasian (1,233 | 78.6%), Hispanic or Latino (231 | 14.7%), and Two or more Races (197 | 12.6%).
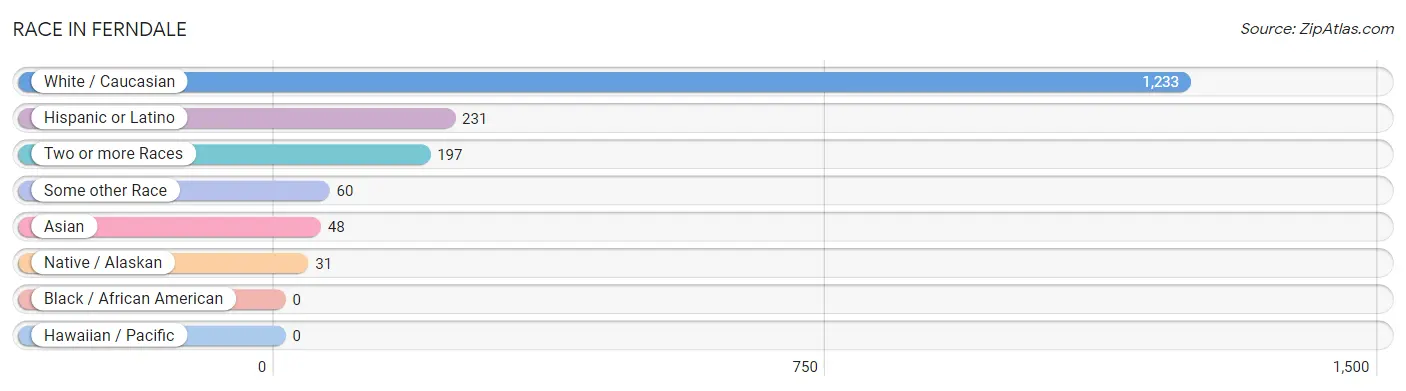
| Race | # Population | % Population |
| Asian | 48 | 3.1% |
| Black / African American | 0 | 0.0% |
| Hawaiian / Pacific | 0 | 0.0% |
| Hispanic or Latino | 231 | 14.7% |
| Native / Alaskan | 31 | 2.0% |
| White / Caucasian | 1,233 | 78.6% |
| Two or more Races | 197 | 12.6% |
| Some other Race | 60 | 3.8% |
| Total | 1,569 | 100.0% |
Ancestry in Ferndale
The most populous ancestries reported in Ferndale are English (284 | 18.1%), German (267 | 17.0%), Mexican (221 | 14.1%), Danish (187 | 11.9%), and Irish (97 | 6.2%), together accounting for 67.3% of all Ferndale residents.
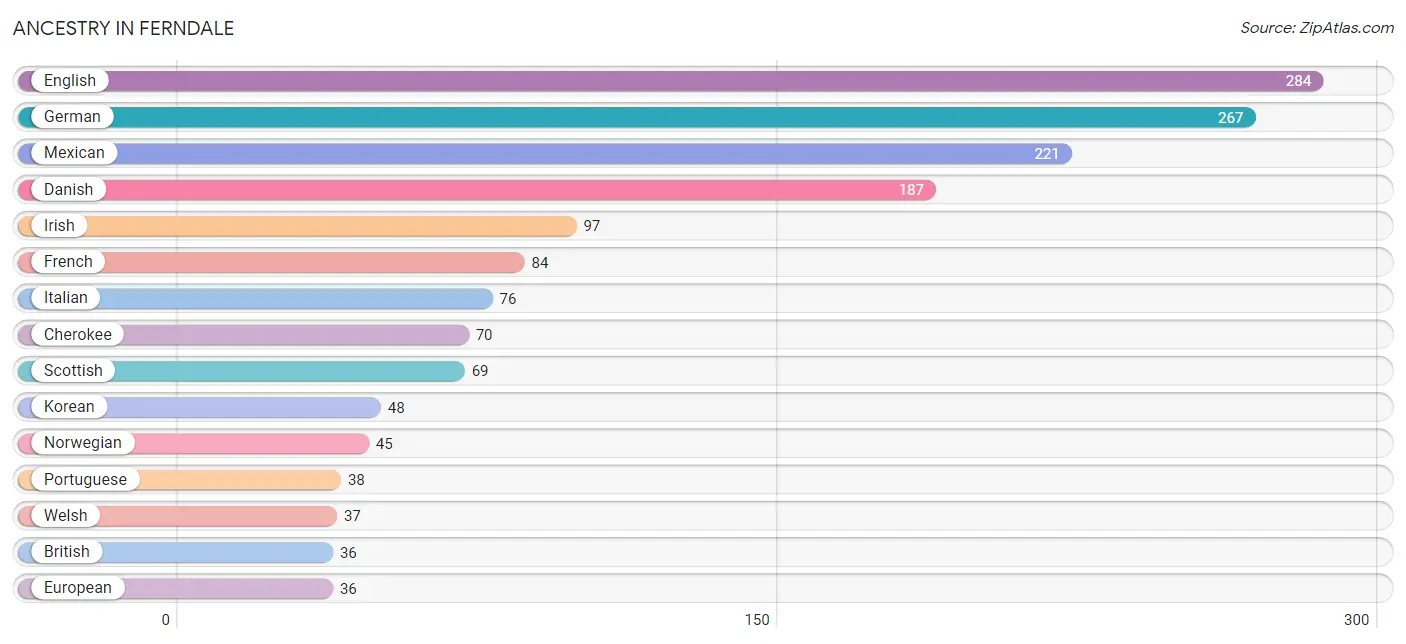
| Ancestry | # Population | % Population |
| American | 9 | 0.6% |
| Blackfeet | 6 | 0.4% |
| British | 36 | 2.3% |
| Cherokee | 70 | 4.5% |
| Creek | 8 | 0.5% |
| Croatian | 8 | 0.5% |
| Cuban | 10 | 0.6% |
| Danish | 187 | 11.9% |
| Dutch | 16 | 1.0% |
| English | 284 | 18.1% |
| European | 36 | 2.3% |
| French | 84 | 5.3% |
| German | 267 | 17.0% |
| Greek | 15 | 1.0% |
| Irish | 97 | 6.2% |
| Italian | 76 | 4.8% |
| Korean | 48 | 3.1% |
| Mexican | 221 | 14.1% |
| Mexican American Indian | 27 | 1.7% |
| Norwegian | 45 | 2.9% |
| Pennsylvania German | 7 | 0.4% |
| Portuguese | 38 | 2.4% |
| Scotch-Irish | 25 | 1.6% |
| Scottish | 69 | 4.4% |
| Swedish | 33 | 2.1% |
| Swiss | 29 | 1.8% |
| Welsh | 37 | 2.4% | View All 27 Rows |
Immigrants in Ferndale
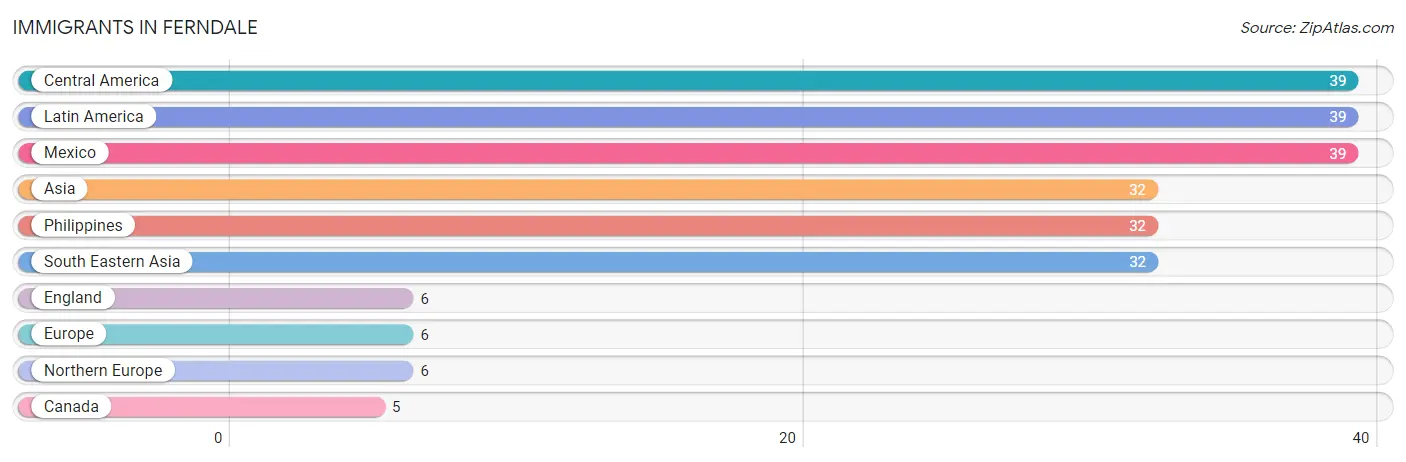
The most numerous immigrant groups reported in Ferndale came from Central America (39 | 2.5%), Latin America (39 | 2.5%), Mexico (39 | 2.5%), Asia (32 | 2.0%), and Philippines (32 | 2.0%), together accounting for 11.5% of all Ferndale residents.
| Immigration Origin | # Population | % Population |
| Asia | 32 | 2.0% |
| Canada | 5 | 0.3% |
| Central America | 39 | 2.5% |
| England | 6 | 0.4% |
| Europe | 6 | 0.4% |
| Latin America | 39 | 2.5% |
| Mexico | 39 | 2.5% |
| Northern Europe | 6 | 0.4% |
| Philippines | 32 | 2.0% |
| South Eastern Asia | 32 | 2.0% | View All 10 Rows |
Sex and Age in Ferndale
Sex and Age in Ferndale
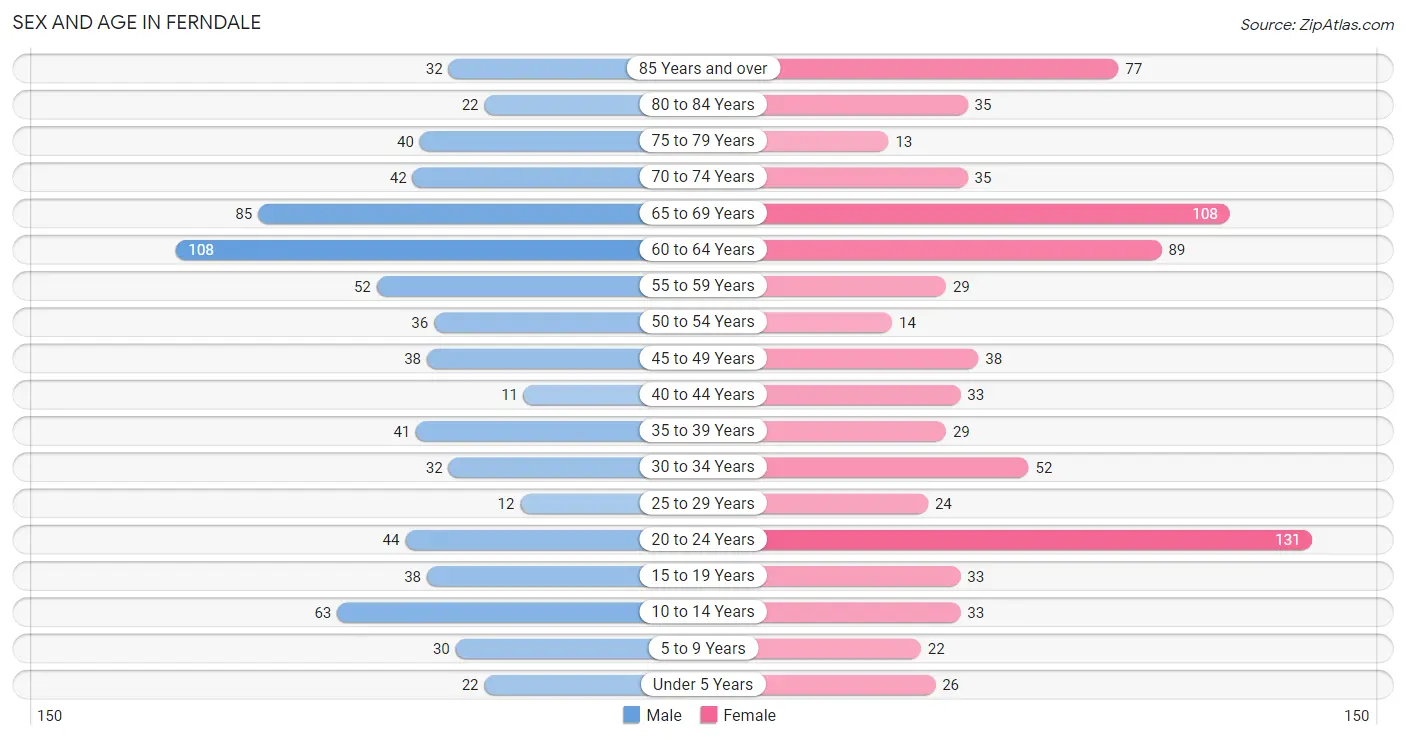
The most populous age groups in Ferndale are 60 to 64 Years (108 | 14.4%) for men and 20 to 24 Years (131 | 16.0%) for women.
| Age Bracket | Male | Female |
| Under 5 Years | 22 (2.9%) | 26 (3.2%) |
| 5 to 9 Years | 30 (4.0%) | 22 (2.7%) |
| 10 to 14 Years | 63 (8.4%) | 33 (4.0%) |
| 15 to 19 Years | 38 (5.1%) | 33 (4.0%) |
| 20 to 24 Years | 44 (5.9%) | 131 (16.0%) |
| 25 to 29 Years | 12 (1.6%) | 24 (2.9%) |
| 30 to 34 Years | 32 (4.3%) | 52 (6.3%) |
| 35 to 39 Years | 41 (5.5%) | 29 (3.5%) |
| 40 to 44 Years | 11 (1.5%) | 33 (4.0%) |
| 45 to 49 Years | 38 (5.1%) | 38 (4.6%) |
| 50 to 54 Years | 36 (4.8%) | 14 (1.7%) |
| 55 to 59 Years | 52 (7.0%) | 29 (3.5%) |
| 60 to 64 Years | 108 (14.4%) | 89 (10.8%) |
| 65 to 69 Years | 85 (11.4%) | 108 (13.2%) |
| 70 to 74 Years | 42 (5.6%) | 35 (4.3%) |
| 75 to 79 Years | 40 (5.3%) | 13 (1.6%) |
| 80 to 84 Years | 22 (2.9%) | 35 (4.3%) |
| 85 Years and over | 32 (4.3%) | 77 (9.4%) |
| Total | 748 (100.0%) | 821 (100.0%) |
Families and Households in Ferndale
Median Family Size in Ferndale
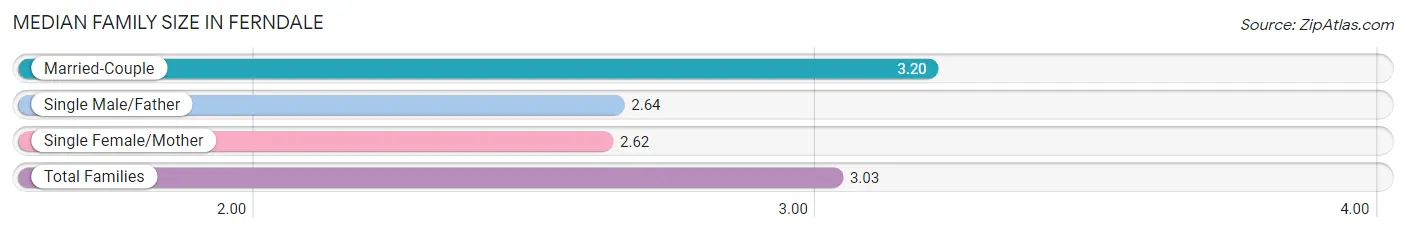
The median family size in Ferndale is 3.03 persons per family, with married-couple families (288 | 70.4%) accounting for the largest median family size of 3.2 persons per family. On the other hand, single female/mother families (82 | 20.1%) represent the smallest median family size with 2.62 persons per family.
| Family Type | # Families | Family Size |
| Married-Couple | 288 (70.4%) | 3.20 |
| Single Male/Father | 39 (9.5%) | 2.64 |
| Single Female/Mother | 82 (20.1%) | 2.62 |
| Total Families | 409 (100.0%) | 3.03 |
Median Household Size in Ferndale
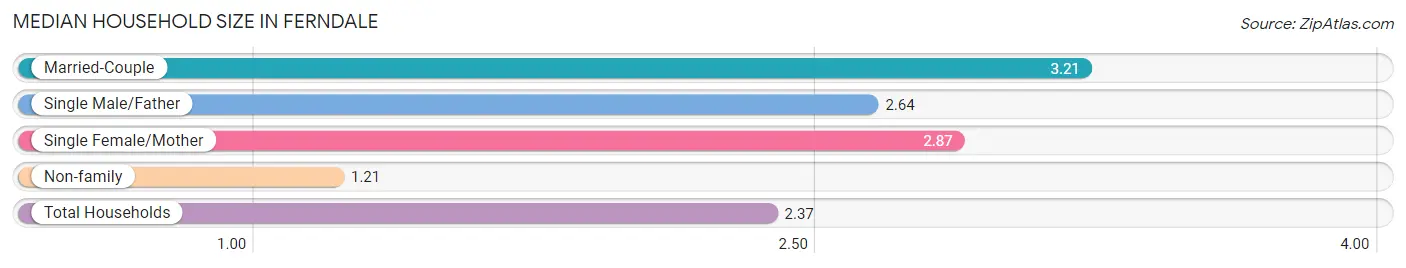
The median household size in Ferndale is 2.37 persons per household, with married-couple households (288 | 43.5%) accounting for the largest median household size of 3.21 persons per household. non-family households (253 | 38.2%) represent the smallest median household size with 1.21 persons per household.
| Household Type | # Households | Household Size |
| Married-Couple | 288 (43.5%) | 3.21 |
| Single Male/Father | 39 (5.9%) | 2.64 |
| Single Female/Mother | 82 (12.4%) | 2.87 |
| Non-family | 253 (38.2%) | 1.21 |
| Total Households | 662 (100.0%) | 2.37 |
Household Size by Marriage Status in Ferndale
Out of a total of 662 households in Ferndale, 409 (61.8%) are family households, while 253 (38.2%) are nonfamily households. The most numerous type of family households are 2-person households, comprising 246, and the most common type of nonfamily households are 1-person households, comprising 232.
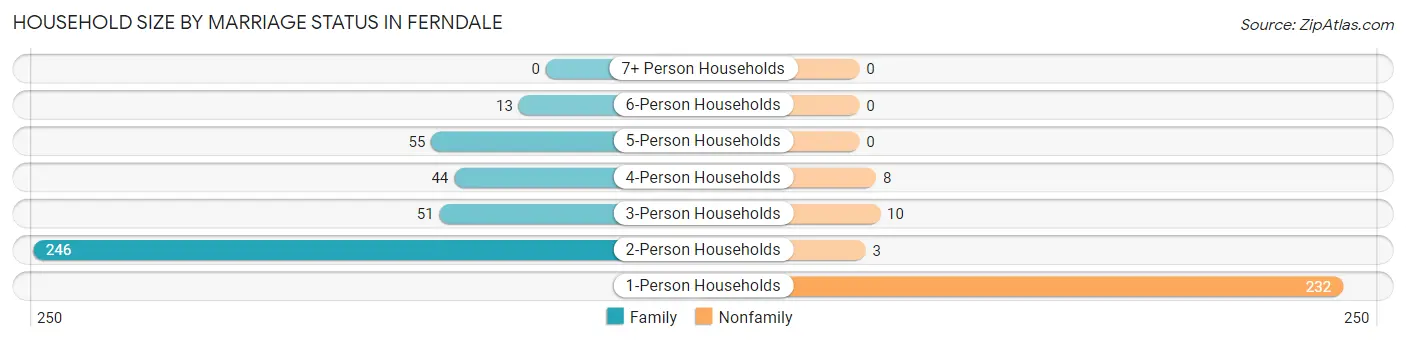
| Household Size | Family Households | Nonfamily Households |
| 1-Person Households | - | 232 (35.0%) |
| 2-Person Households | 246 (37.2%) | 3 (0.4%) |
| 3-Person Households | 51 (7.7%) | 10 (1.5%) |
| 4-Person Households | 44 (6.7%) | 8 (1.2%) |
| 5-Person Households | 55 (8.3%) | 0 (0.0%) |
| 6-Person Households | 13 (2.0%) | 0 (0.0%) |
| 7+ Person Households | 0 (0.0%) | 0 (0.0%) |
| Total | 409 (61.8%) | 253 (38.2%) |
Female Fertility in Ferndale
Fertility by Age in Ferndale
Average fertility rate in Ferndale is 24.0 births per 1,000 women. Women in the age bracket of 35 to 50 years have the highest fertility rate with 80.0 births per 1,000 women. Women in the age bracket of 35 to 50 years acount for 100.0% of all women with births.
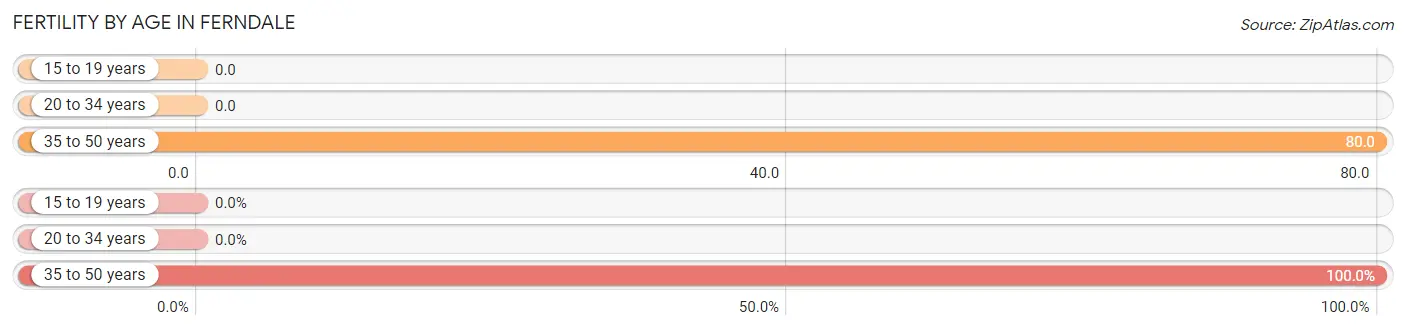
| Age Bracket | Women with Births | Births / 1,000 Women |
| 15 to 19 years | 0 (0.0%) | 0.0 |
| 20 to 34 years | 0 (0.0%) | 0.0 |
| 35 to 50 years | 8 (100.0%) | 80.0 |
| Total | 8 (100.0%) | 24.0 |
Fertility by Age by Marriage Status in Ferndale
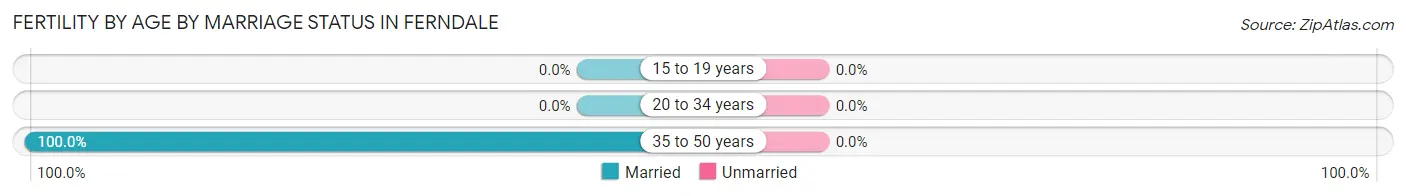
| Age Bracket | Married | Unmarried |
| 15 to 19 years | 0 (0.0%) | 0 (0.0%) |
| 20 to 34 years | 0 (0.0%) | 0 (0.0%) |
| 35 to 50 years | 8 (100.0%) | 0 (0.0%) |
| Total | 8 (100.0%) | 0 (0.0%) |
Fertility by Education in Ferndale
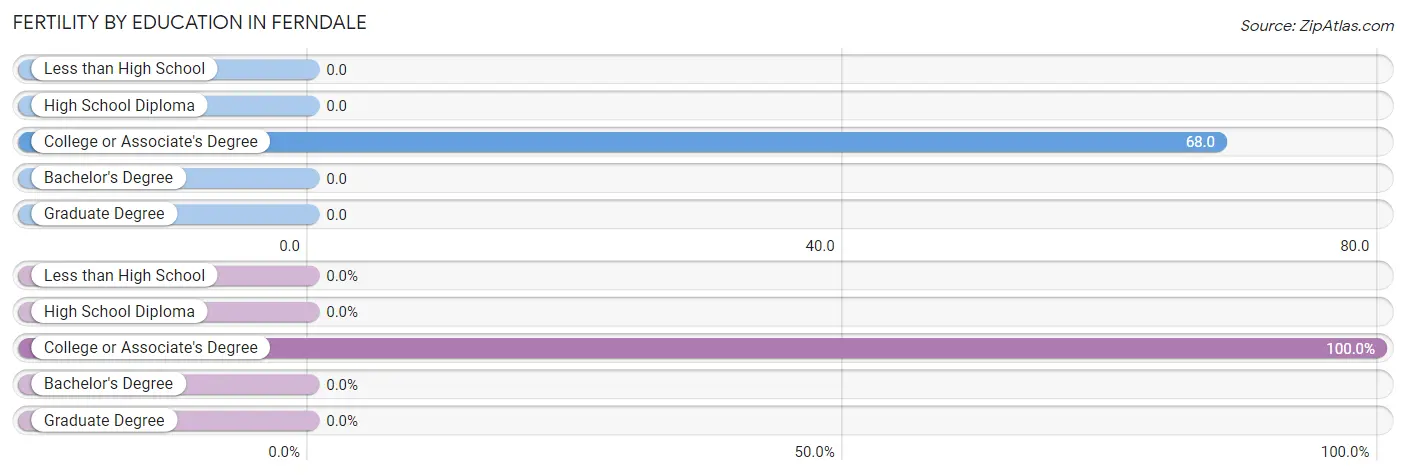
| Educational Attainment | Women with Births | Births / 1,000 Women |
| Less than High School | 0 (0.0%) | 0.0 |
| High School Diploma | 0 (0.0%) | 0.0 |
| College or Associate's Degree | 8 (100.0%) | 68.0 |
| Bachelor's Degree | 0 (0.0%) | 0.0 |
| Graduate Degree | 0 (0.0%) | 0.0 |
| Total | 8 (100.0%) | 24.0 |
Fertility by Education by Marriage Status in Ferndale
| Educational Attainment | Married | Unmarried |
| Less than High School | 0 (0.0%) | 0 (0.0%) |
| High School Diploma | 0 (0.0%) | 0 (0.0%) |
| College or Associate's Degree | 8 (100.0%) | 0 (0.0%) |
| Bachelor's Degree | 0 (0.0%) | 0 (0.0%) |
| Graduate Degree | 0 (0.0%) | 0 (0.0%) |
| Total | 8 (100.0%) | 0 (0.0%) |
Employment Characteristics in Ferndale
Employment by Class of Employer in Ferndale
Among the 574 employed individuals in Ferndale, private company employees (272 | 47.4%), local government employees (102 | 17.8%), and not-for-profit organizations (75 | 13.1%) make up the most common classes of employment.
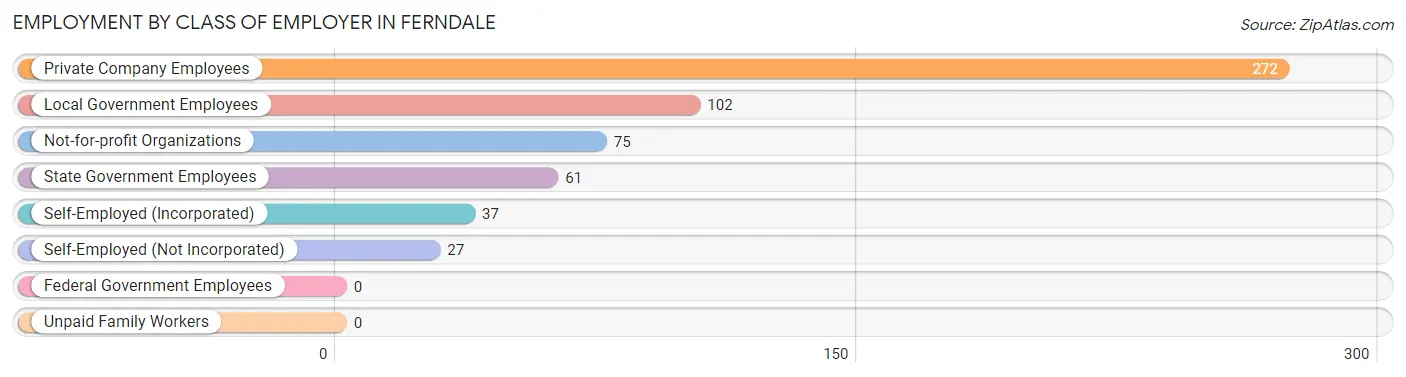
| Employer Class | # Employees | % Employees |
| Private Company Employees | 272 | 47.4% |
| Self-Employed (Incorporated) | 37 | 6.5% |
| Self-Employed (Not Incorporated) | 27 | 4.7% |
| Not-for-profit Organizations | 75 | 13.1% |
| Local Government Employees | 102 | 17.8% |
| State Government Employees | 61 | 10.6% |
| Federal Government Employees | 0 | 0.0% |
| Unpaid Family Workers | 0 | 0.0% |
| Total | 574 | 100.0% |
Employment Status by Age in Ferndale
According to the labor force statistics for Ferndale, out of the total population over 16 years of age (1,354), 48.2% or 653 individuals are in the labor force, with 8.7% or 57 of them unemployed. The age group with the highest labor force participation rate is 25 to 29 years, with 100.0% or 36 individuals in the labor force. Within the labor force, the 16 to 19 years age range has the highest percentage of unemployed individuals, with 77.8% or 21 of them being unemployed.
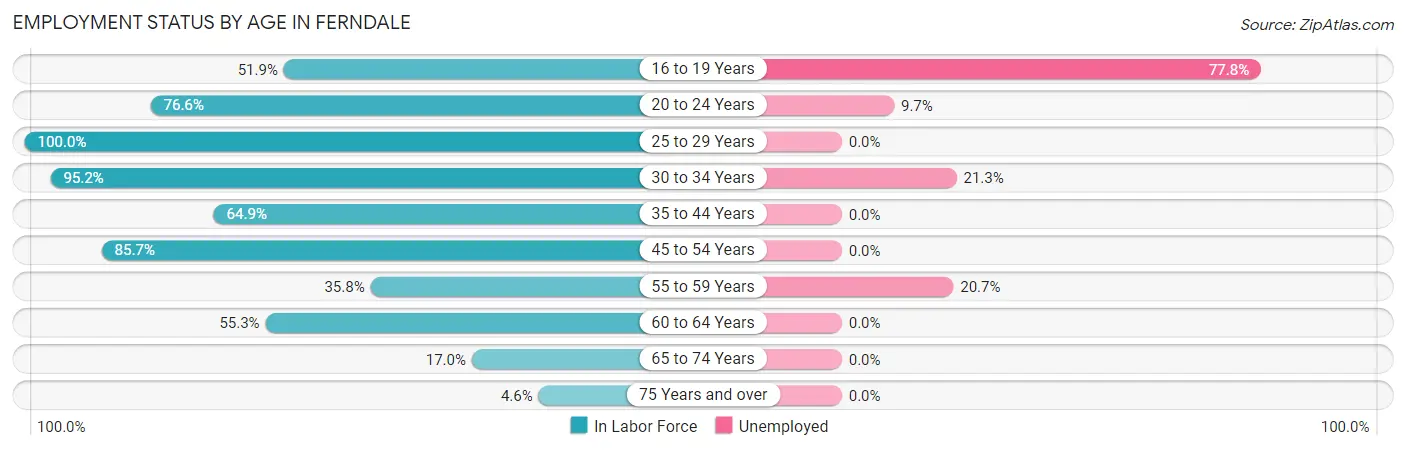
| Age Bracket | In Labor Force | Unemployed |
| 16 to 19 Years | 27 (51.9%) | 21 (77.8%) |
| 20 to 24 Years | 134 (76.6%) | 13 (9.7%) |
| 25 to 29 Years | 36 (100.0%) | 0 (0.0%) |
| 30 to 34 Years | 80 (95.2%) | 17 (21.3%) |
| 35 to 44 Years | 74 (64.9%) | 0 (0.0%) |
| 45 to 54 Years | 108 (85.7%) | 0 (0.0%) |
| 55 to 59 Years | 29 (35.8%) | 6 (20.7%) |
| 60 to 64 Years | 109 (55.3%) | 0 (0.0%) |
| 65 to 74 Years | 46 (17.0%) | 0 (0.0%) |
| 75 Years and over | 10 (4.6%) | 0 (0.0%) |
| Total | 653 (48.2%) | 57 (8.7%) |
Employment Status by Educational Attainment in Ferndale
According to labor force statistics for Ferndale, 68.3% of individuals (436) out of the total population between 25 and 64 years of age (638) are in the labor force, with 5.3% or 23 of them being unemployed. The group with the highest labor force participation rate are those with the educational attainment of bachelor's degree or higher, with 80.3% or 179 individuals in the labor force. Within the labor force, individuals with college / associate degree education have the highest percentage of unemployment, with 9.4% or 17 of them being unemployed.
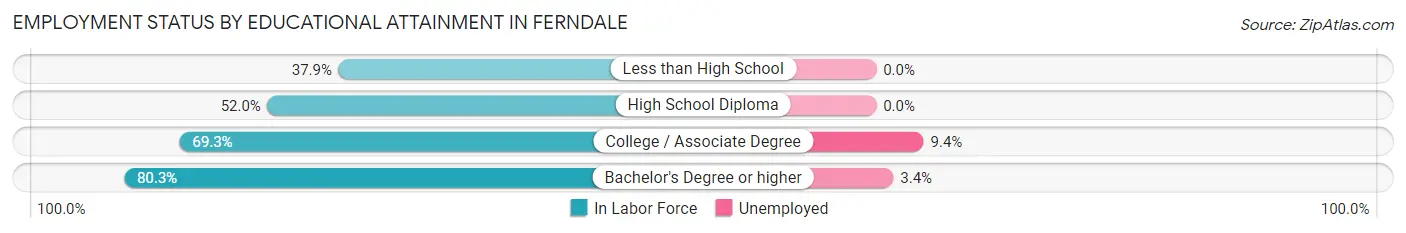
| Educational Attainment | In Labor Force | Unemployed |
| Less than High School | 11 (37.9%) | 0 (0.0%) |
| High School Diploma | 65 (52.0%) | 0 (0.0%) |
| College / Associate Degree | 181 (69.3%) | 25 (9.4%) |
| Bachelor's Degree or higher | 179 (80.3%) | 8 (3.4%) |
| Total | 436 (68.3%) | 34 (5.3%) |
Employment Occupations by Sex in Ferndale
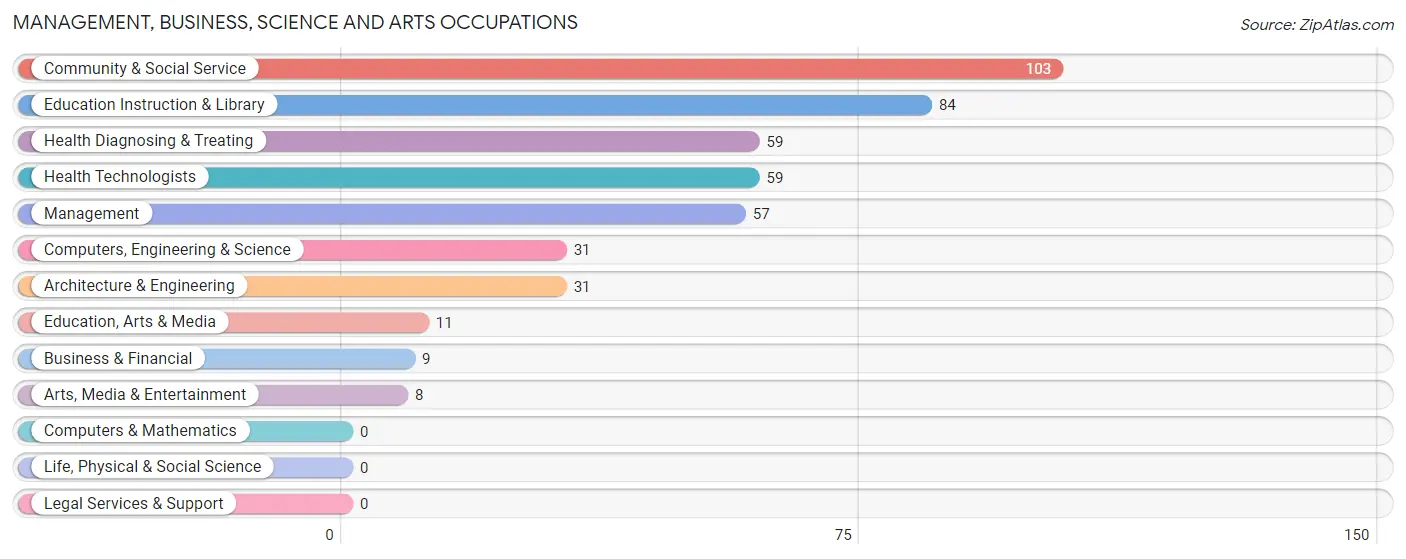
Management, Business, Science and Arts Occupations
The most common Management, Business, Science and Arts occupations in Ferndale are Community & Social Service (103 | 17.3%), Education Instruction & Library (84 | 14.1%), Health Diagnosing & Treating (59 | 9.9%), Health Technologists (59 | 9.9%), and Management (57 | 9.6%).
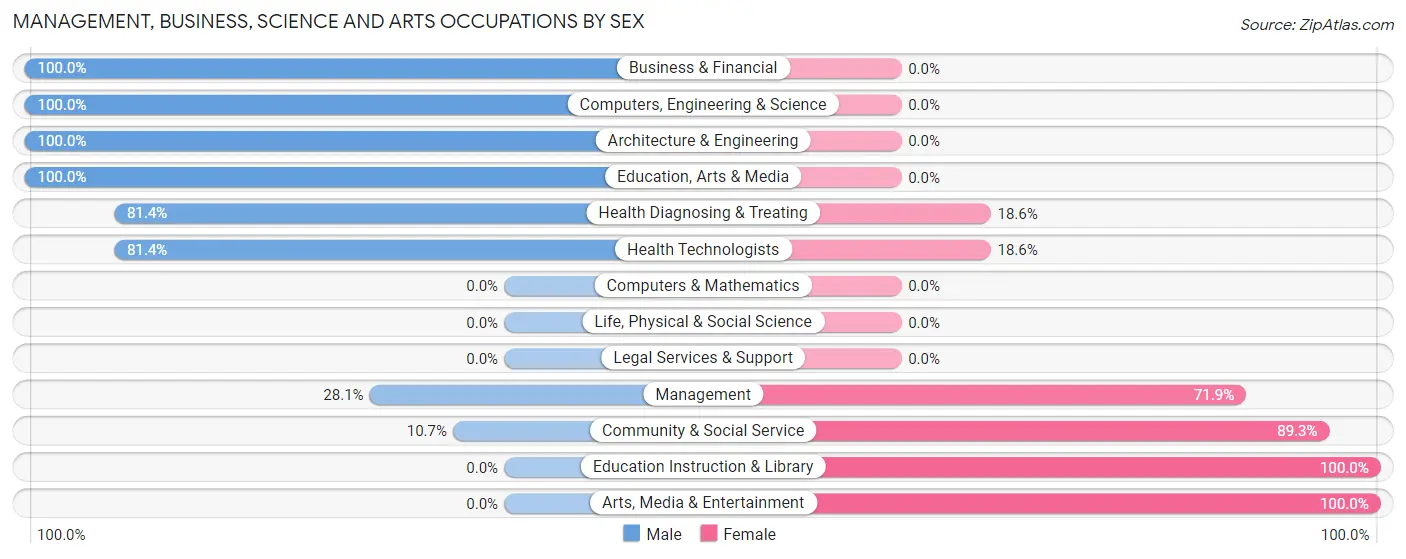
Management, Business, Science and Arts Occupations by Sex
Within the Management, Business, Science and Arts occupations in Ferndale, the most male-oriented occupations are Business & Financial (100.0%), Computers, Engineering & Science (100.0%), and Architecture & Engineering (100.0%), while the most female-oriented occupations are Education Instruction & Library (100.0%), Arts, Media & Entertainment (100.0%), and Community & Social Service (89.3%).
| Occupation | Male | Female |
| Management | 16 (28.1%) | 41 (71.9%) |
| Business & Financial | 9 (100.0%) | 0 (0.0%) |
| Computers, Engineering & Science | 31 (100.0%) | 0 (0.0%) |
| Computers & Mathematics | 0 (0.0%) | 0 (0.0%) |
| Architecture & Engineering | 31 (100.0%) | 0 (0.0%) |
| Life, Physical & Social Science | 0 (0.0%) | 0 (0.0%) |
| Community & Social Service | 11 (10.7%) | 92 (89.3%) |
| Education, Arts & Media | 11 (100.0%) | 0 (0.0%) |
| Legal Services & Support | 0 (0.0%) | 0 (0.0%) |
| Education Instruction & Library | 0 (0.0%) | 84 (100.0%) |
| Arts, Media & Entertainment | 0 (0.0%) | 8 (100.0%) |
| Health Diagnosing & Treating | 48 (81.4%) | 11 (18.6%) |
| Health Technologists | 48 (81.4%) | 11 (18.6%) |
| Total (Category) | 115 (44.4%) | 144 (55.6%) |
| Total (Overall) | 302 (50.7%) | 294 (49.3%) |
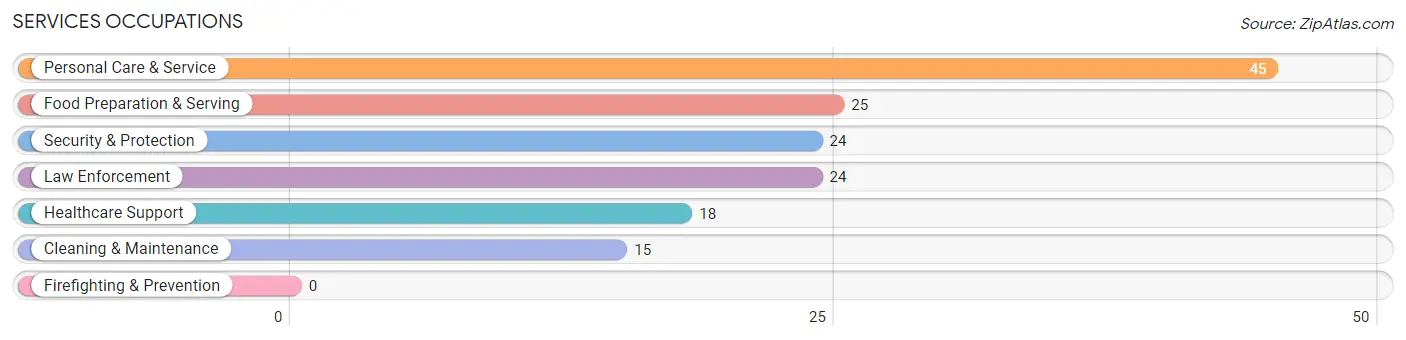
Services Occupations
The most common Services occupations in Ferndale are Personal Care & Service (45 | 7.5%), Food Preparation & Serving (25 | 4.2%), Security & Protection (24 | 4.0%), Law Enforcement (24 | 4.0%), and Healthcare Support (18 | 3.0%).
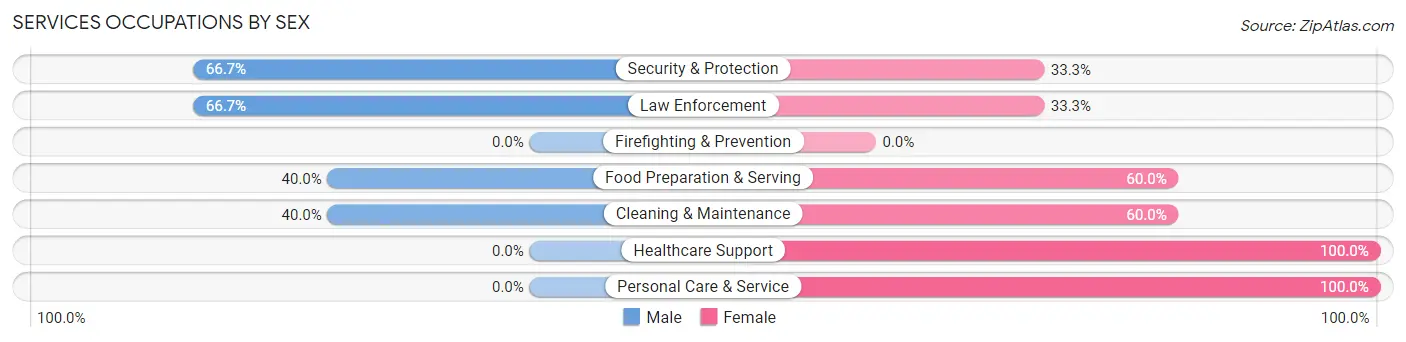
Services Occupations by Sex
Within the Services occupations in Ferndale, the most male-oriented occupations are Security & Protection (66.7%), Law Enforcement (66.7%), and Food Preparation & Serving (40.0%), while the most female-oriented occupations are Healthcare Support (100.0%), Personal Care & Service (100.0%), and Food Preparation & Serving (60.0%).
| Occupation | Male | Female |
| Healthcare Support | 0 (0.0%) | 18 (100.0%) |
| Security & Protection | 16 (66.7%) | 8 (33.3%) |
| Firefighting & Prevention | 0 (0.0%) | 0 (0.0%) |
| Law Enforcement | 16 (66.7%) | 8 (33.3%) |
| Food Preparation & Serving | 10 (40.0%) | 15 (60.0%) |
| Cleaning & Maintenance | 6 (40.0%) | 9 (60.0%) |
| Personal Care & Service | 0 (0.0%) | 45 (100.0%) |
| Total (Category) | 32 (25.2%) | 95 (74.8%) |
| Total (Overall) | 302 (50.7%) | 294 (49.3%) |
Sales and Office Occupations
The most common Sales and Office occupations in Ferndale are Sales & Related (44 | 7.4%), and Office & Administration (32 | 5.4%).
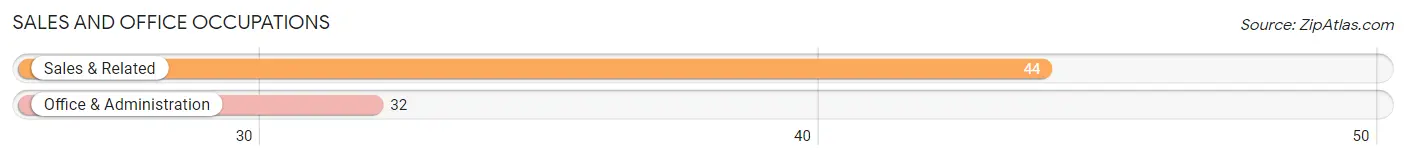
Sales and Office Occupations by Sex
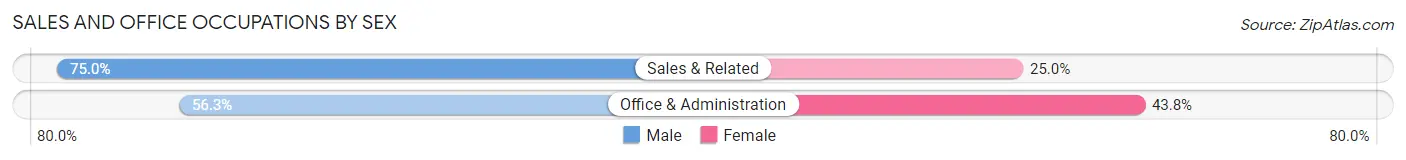
| Occupation | Male | Female |
| Sales & Related | 33 (75.0%) | 11 (25.0%) |
| Office & Administration | 18 (56.2%) | 14 (43.8%) |
| Total (Category) | 51 (67.1%) | 25 (32.9%) |
| Total (Overall) | 302 (50.7%) | 294 (49.3%) |
Natural Resources, Construction and Maintenance Occupations
The most common Natural Resources, Construction and Maintenance occupations in Ferndale are Installation, Maintenance & Repair (40 | 6.7%), Farming, Fishing & Forestry (22 | 3.7%), and Construction & Extraction (11 | 1.8%).
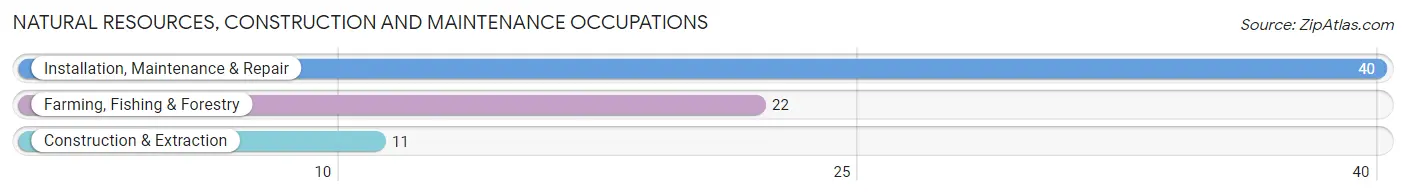
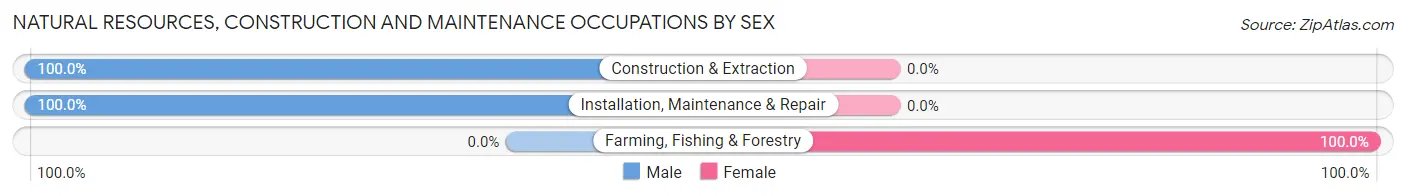
Natural Resources, Construction and Maintenance Occupations by Sex
| Occupation | Male | Female |
| Farming, Fishing & Forestry | 0 (0.0%) | 22 (100.0%) |
| Construction & Extraction | 11 (100.0%) | 0 (0.0%) |
| Installation, Maintenance & Repair | 40 (100.0%) | 0 (0.0%) |
| Total (Category) | 51 (69.9%) | 22 (30.1%) |
| Total (Overall) | 302 (50.7%) | 294 (49.3%) |
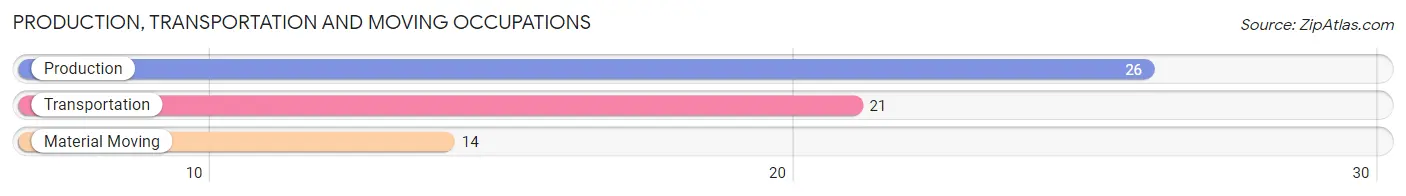
Production, Transportation and Moving Occupations
The most common Production, Transportation and Moving occupations in Ferndale are Production (26 | 4.4%), Transportation (21 | 3.5%), and Material Moving (14 | 2.4%).
Production, Transportation and Moving Occupations by Sex
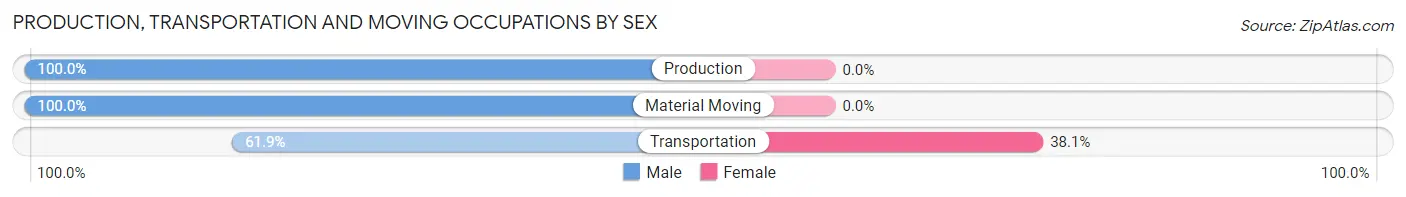
| Occupation | Male | Female |
| Production | 26 (100.0%) | 0 (0.0%) |
| Transportation | 13 (61.9%) | 8 (38.1%) |
| Material Moving | 14 (100.0%) | 0 (0.0%) |
| Total (Category) | 53 (86.9%) | 8 (13.1%) |
| Total (Overall) | 302 (50.7%) | 294 (49.3%) |
Employment Industries by Sex in Ferndale
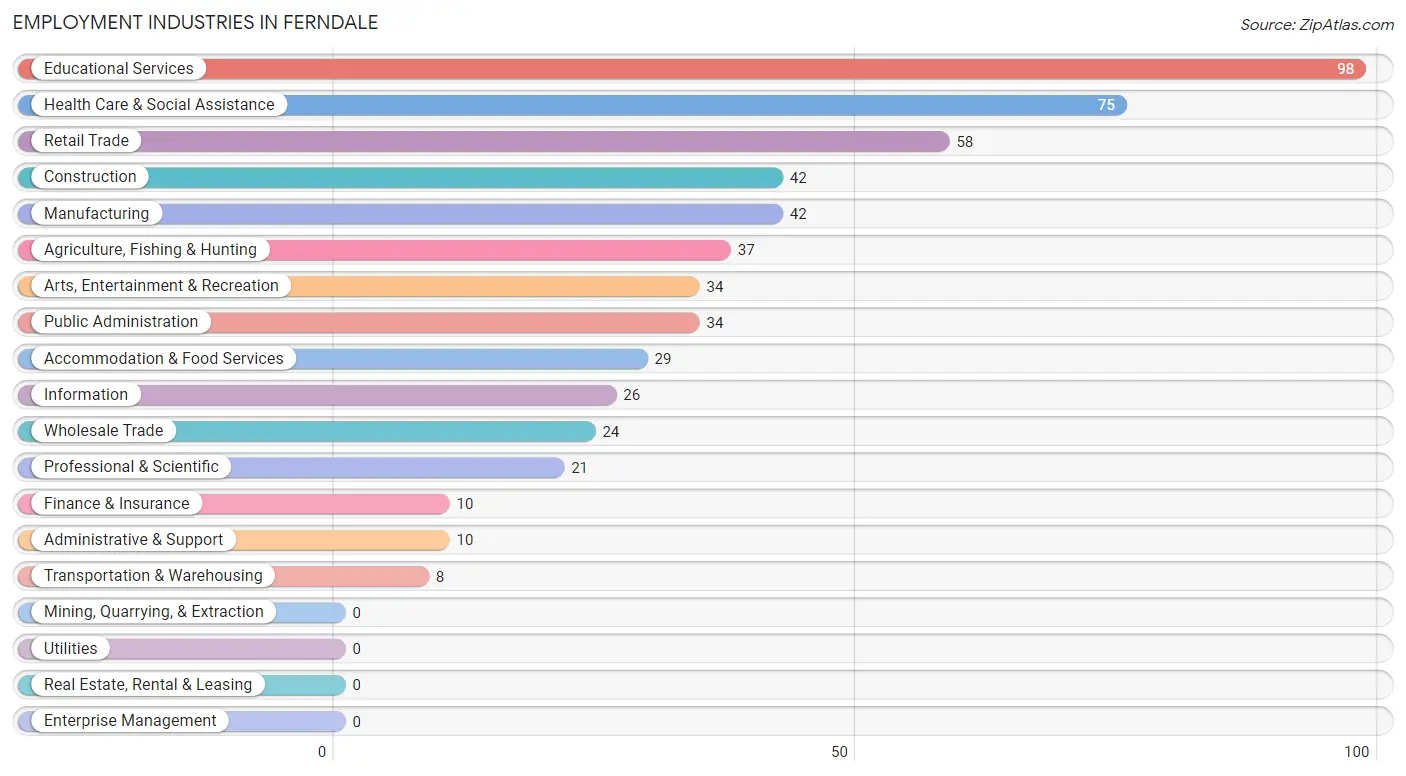
Employment Industries in Ferndale
The major employment industries in Ferndale include Educational Services (98 | 16.4%), Health Care & Social Assistance (75 | 12.6%), Retail Trade (58 | 9.7%), Construction (42 | 7.0%), and Manufacturing (42 | 7.0%).
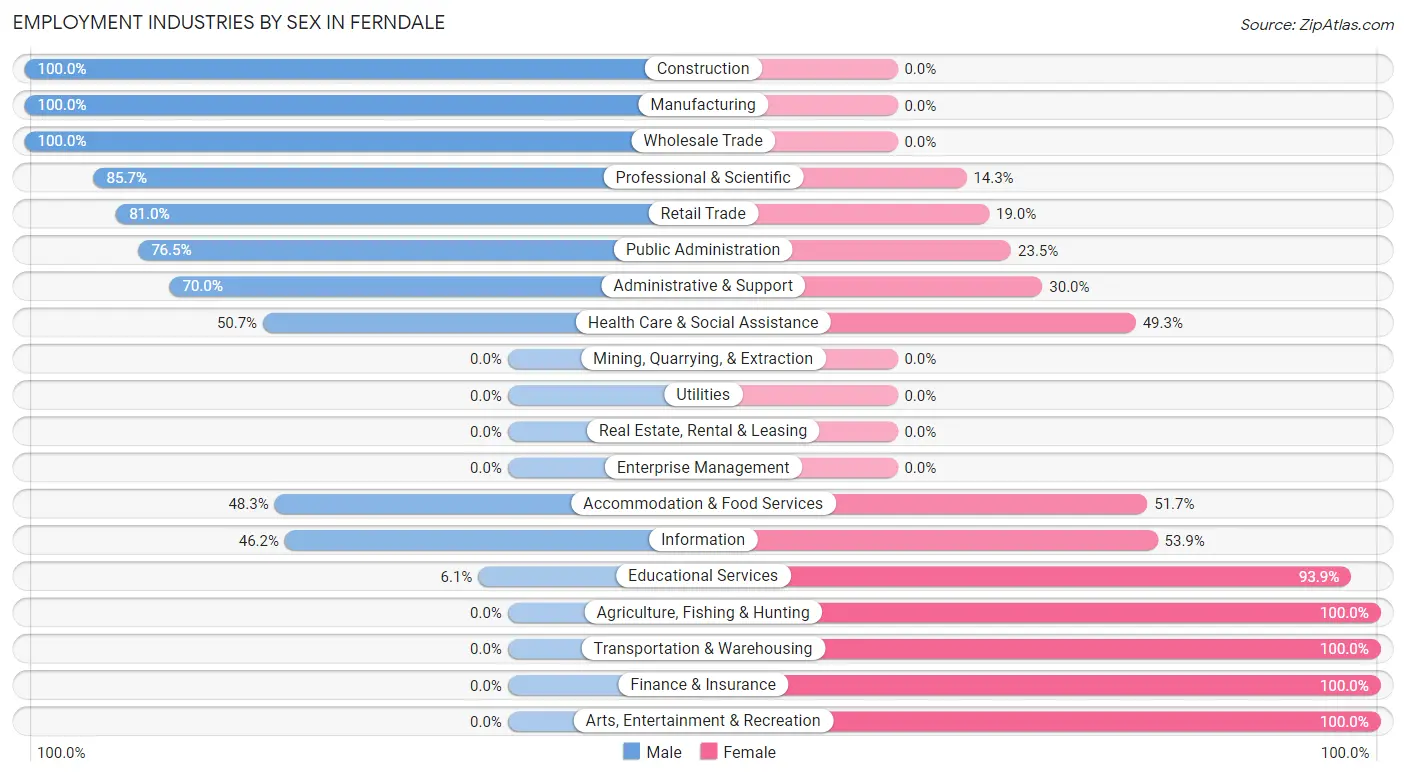
Employment Industries by Sex in Ferndale
The Ferndale industries that see more men than women are Construction (100.0%), Manufacturing (100.0%), and Wholesale Trade (100.0%), whereas the industries that tend to have a higher number of women are Agriculture, Fishing & Hunting (100.0%), Transportation & Warehousing (100.0%), and Finance & Insurance (100.0%).
| Industry | Male | Female |
| Agriculture, Fishing & Hunting | 0 (0.0%) | 37 (100.0%) |
| Mining, Quarrying, & Extraction | 0 (0.0%) | 0 (0.0%) |
| Construction | 42 (100.0%) | 0 (0.0%) |
| Manufacturing | 42 (100.0%) | 0 (0.0%) |
| Wholesale Trade | 24 (100.0%) | 0 (0.0%) |
| Retail Trade | 47 (81.0%) | 11 (19.0%) |
| Transportation & Warehousing | 0 (0.0%) | 8 (100.0%) |
| Utilities | 0 (0.0%) | 0 (0.0%) |
| Information | 12 (46.2%) | 14 (53.8%) |
| Finance & Insurance | 0 (0.0%) | 10 (100.0%) |
| Real Estate, Rental & Leasing | 0 (0.0%) | 0 (0.0%) |
| Professional & Scientific | 18 (85.7%) | 3 (14.3%) |
| Enterprise Management | 0 (0.0%) | 0 (0.0%) |
| Administrative & Support | 7 (70.0%) | 3 (30.0%) |
| Educational Services | 6 (6.1%) | 92 (93.9%) |
| Health Care & Social Assistance | 38 (50.7%) | 37 (49.3%) |
| Arts, Entertainment & Recreation | 0 (0.0%) | 34 (100.0%) |
| Accommodation & Food Services | 14 (48.3%) | 15 (51.7%) |
| Public Administration | 26 (76.5%) | 8 (23.5%) |
| Total | 302 (50.7%) | 294 (49.3%) |
Education in Ferndale
School Enrollment in Ferndale
The most common levels of schooling among the 264 students in Ferndale are college / undergraduate (75 | 28.4%), middle school (57 | 21.6%), and high school (53 | 20.1%).
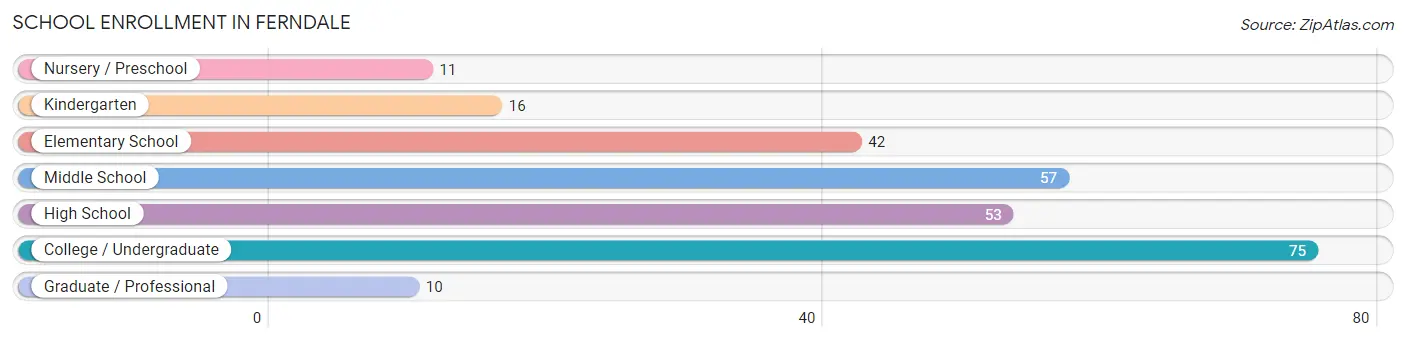
| School Level | # Students | % Students |
| Nursery / Preschool | 11 | 4.2% |
| Kindergarten | 16 | 6.1% |
| Elementary School | 42 | 15.9% |
| Middle School | 57 | 21.6% |
| High School | 53 | 20.1% |
| College / Undergraduate | 75 | 28.4% |
| Graduate / Professional | 10 | 3.8% |
| Total | 264 | 100.0% |
School Enrollment by Age by Funding Source in Ferndale
Out of a total of 264 students who are enrolled in schools in Ferndale, 10 (3.8%) attend a private institution, while the remaining 254 (96.2%) are enrolled in public schools. The age group of 35 years and over has the highest likelihood of being enrolled in private schools, with 10 (62.5% in the age bracket) enrolled. Conversely, the age group of 3 to 4 year olds has the lowest likelihood of being enrolled in a private school, with 11 (100.0% in the age bracket) attending a public institution.
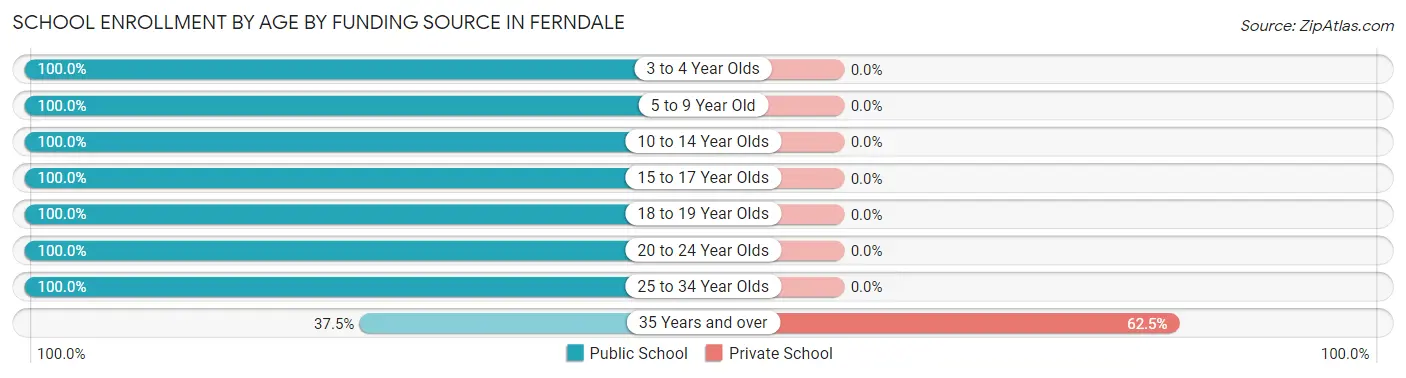
| Age Bracket | Public School | Private School |
| 3 to 4 Year Olds | 11 (100.0%) | 0 (0.0%) |
| 5 to 9 Year Old | 46 (100.0%) | 0 (0.0%) |
| 10 to 14 Year Olds | 88 (100.0%) | 0 (0.0%) |
| 15 to 17 Year Olds | 34 (100.0%) | 0 (0.0%) |
| 18 to 19 Year Olds | 15 (100.0%) | 0 (0.0%) |
| 20 to 24 Year Olds | 39 (100.0%) | 0 (0.0%) |
| 25 to 34 Year Olds | 15 (100.0%) | 0 (0.0%) |
| 35 Years and over | 6 (37.5%) | 10 (62.5%) |
| Total | 254 (96.2%) | 10 (3.8%) |
Educational Attainment by Field of Study in Ferndale
Liberal arts & history (56 | 15.3%), science & technology (47 | 12.9%), engineering (46 | 12.6%), education (41 | 11.2%), and social sciences (34 | 9.3%) are the most common fields of study among 365 individuals in Ferndale who have obtained a bachelor's degree or higher.
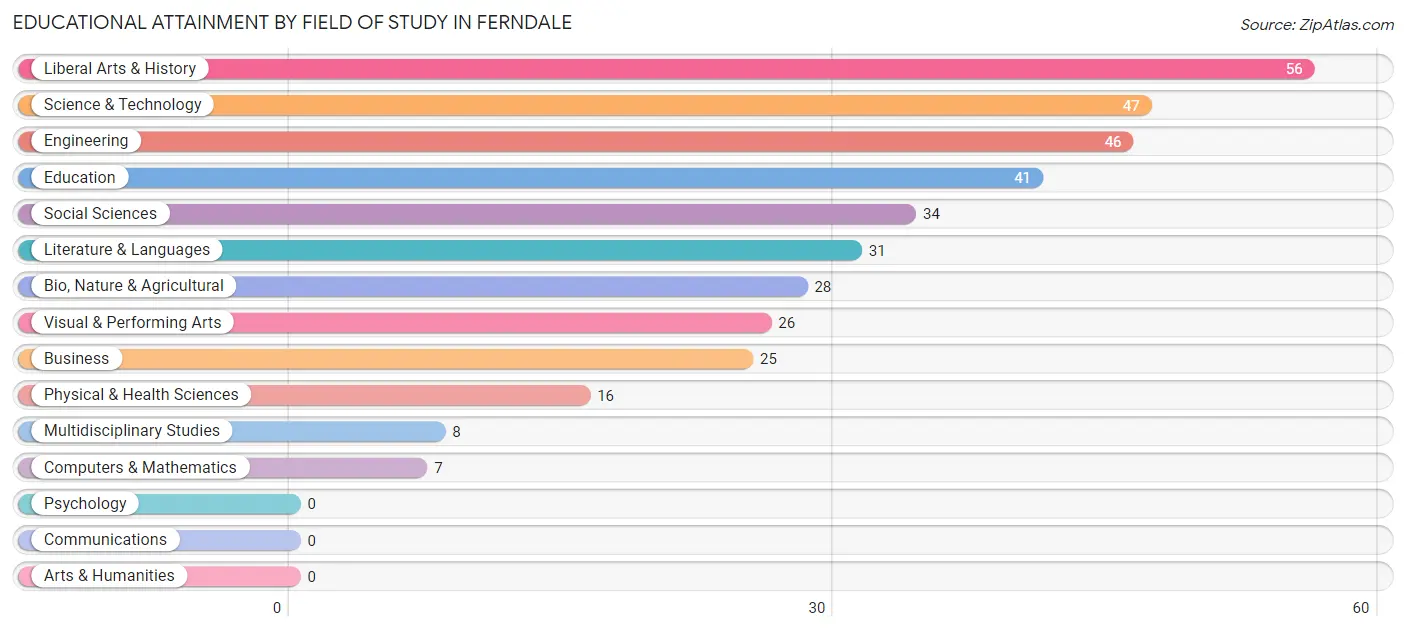
| Field of Study | # Graduates | % Graduates |
| Computers & Mathematics | 7 | 1.9% |
| Bio, Nature & Agricultural | 28 | 7.7% |
| Physical & Health Sciences | 16 | 4.4% |
| Psychology | 0 | 0.0% |
| Social Sciences | 34 | 9.3% |
| Engineering | 46 | 12.6% |
| Multidisciplinary Studies | 8 | 2.2% |
| Science & Technology | 47 | 12.9% |
| Business | 25 | 6.9% |
| Education | 41 | 11.2% |
| Literature & Languages | 31 | 8.5% |
| Liberal Arts & History | 56 | 15.3% |
| Visual & Performing Arts | 26 | 7.1% |
| Communications | 0 | 0.0% |
| Arts & Humanities | 0 | 0.0% |
| Total | 365 | 100.0% |
Transportation & Commute in Ferndale
Vehicle Availability by Sex in Ferndale
The most prevalent vehicle ownership categories in Ferndale are males with 2 vehicles (183, accounting for 62.2%) and females with 2 vehicles (76, making up 65.4%).
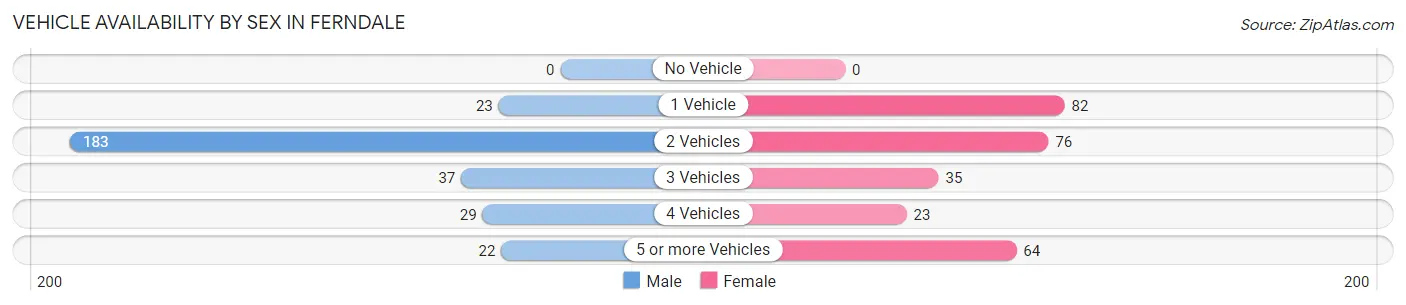
| Vehicles Available | Male | Female |
| No Vehicle | 0 (0.0%) | 0 (0.0%) |
| 1 Vehicle | 23 (7.8%) | 82 (29.3%) |
| 2 Vehicles | 183 (62.2%) | 76 (27.1%) |
| 3 Vehicles | 37 (12.6%) | 35 (12.5%) |
| 4 Vehicles | 29 (9.9%) | 23 (8.2%) |
| 5 or more Vehicles | 22 (7.5%) | 64 (22.9%) |
| Total | 294 (100.0%) | 280 (100.0%) |
Commute Time in Ferndale
The most frequently occuring commute durations in Ferndale are 15 to 19 minutes (104 commuters, 20.9%), less than 5 minutes (82 commuters, 16.5%), and 25 to 29 minutes (78 commuters, 15.7%).
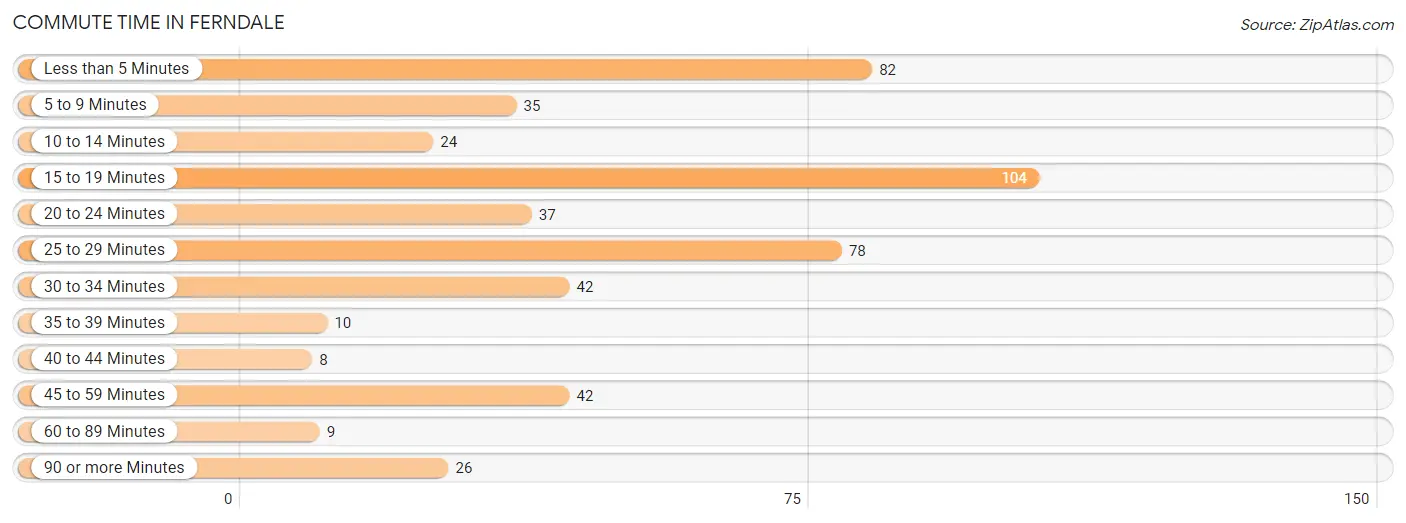
| Commute Time | # Commuters | % Commuters |
| Less than 5 Minutes | 82 | 16.5% |
| 5 to 9 Minutes | 35 | 7.0% |
| 10 to 14 Minutes | 24 | 4.8% |
| 15 to 19 Minutes | 104 | 20.9% |
| 20 to 24 Minutes | 37 | 7.4% |
| 25 to 29 Minutes | 78 | 15.7% |
| 30 to 34 Minutes | 42 | 8.5% |
| 35 to 39 Minutes | 10 | 2.0% |
| 40 to 44 Minutes | 8 | 1.6% |
| 45 to 59 Minutes | 42 | 8.5% |
| 60 to 89 Minutes | 9 | 1.8% |
| 90 or more Minutes | 26 | 5.2% |
Commute Time by Sex in Ferndale
The most common commute times in Ferndale are 25 to 29 minutes (65 commuters, 28.3%) for males and 15 to 19 minutes (92 commuters, 34.5%) for females.
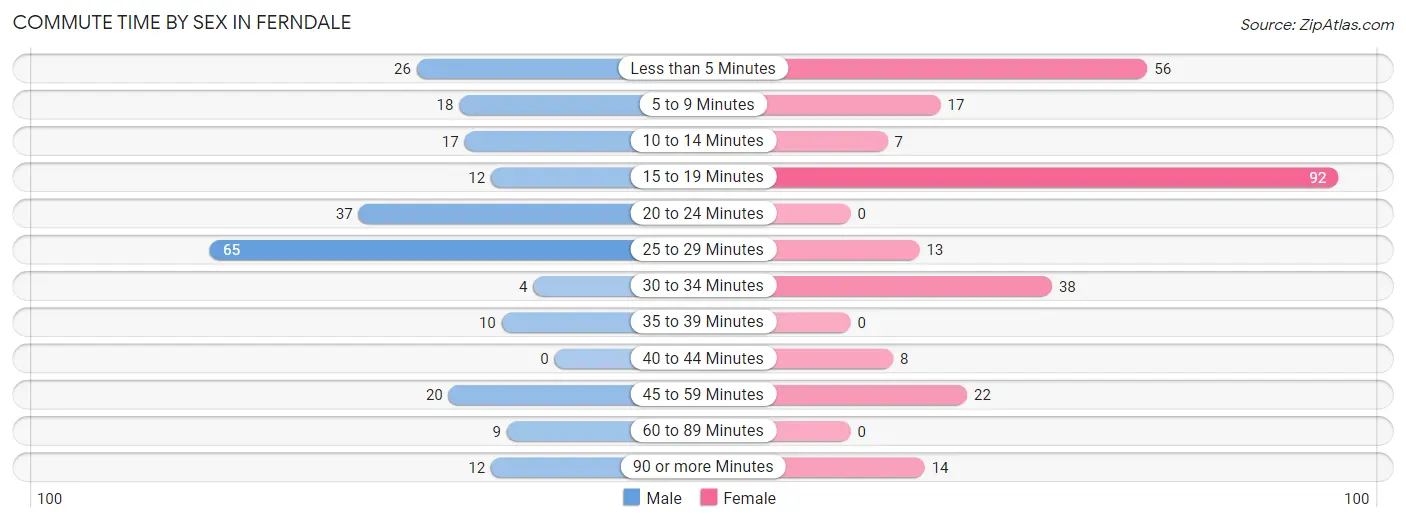
| Commute Time | Male | Female |
| Less than 5 Minutes | 26 (11.3%) | 56 (21.0%) |
| 5 to 9 Minutes | 18 (7.8%) | 17 (6.4%) |
| 10 to 14 Minutes | 17 (7.4%) | 7 (2.6%) |
| 15 to 19 Minutes | 12 (5.2%) | 92 (34.5%) |
| 20 to 24 Minutes | 37 (16.1%) | 0 (0.0%) |
| 25 to 29 Minutes | 65 (28.3%) | 13 (4.9%) |
| 30 to 34 Minutes | 4 (1.7%) | 38 (14.2%) |
| 35 to 39 Minutes | 10 (4.3%) | 0 (0.0%) |
| 40 to 44 Minutes | 0 (0.0%) | 8 (3.0%) |
| 45 to 59 Minutes | 20 (8.7%) | 22 (8.2%) |
| 60 to 89 Minutes | 9 (3.9%) | 0 (0.0%) |
| 90 or more Minutes | 12 (5.2%) | 14 (5.2%) |
Time of Departure to Work by Sex in Ferndale
The most frequent times of departure to work in Ferndale are 8:00 AM to 8:29 AM (47, 20.4%) for males and 12:00 PM to 3:59 PM (61, 22.9%) for females.
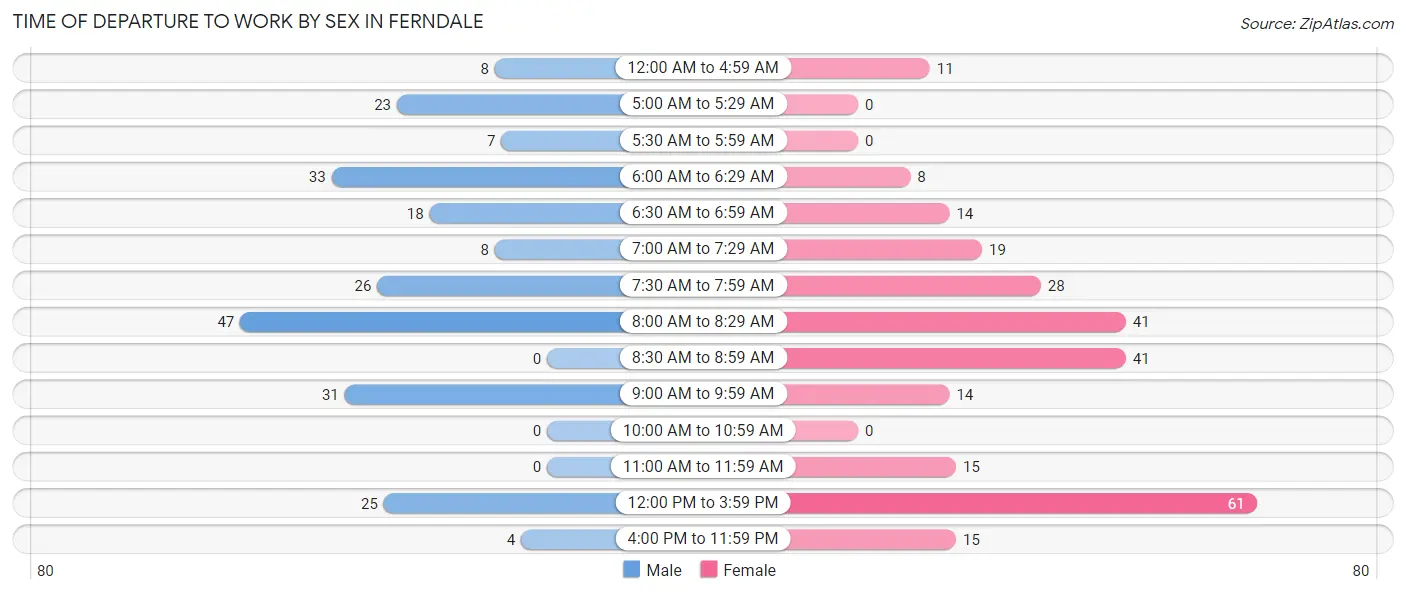
| Time of Departure | Male | Female |
| 12:00 AM to 4:59 AM | 8 (3.5%) | 11 (4.1%) |
| 5:00 AM to 5:29 AM | 23 (10.0%) | 0 (0.0%) |
| 5:30 AM to 5:59 AM | 7 (3.0%) | 0 (0.0%) |
| 6:00 AM to 6:29 AM | 33 (14.3%) | 8 (3.0%) |
| 6:30 AM to 6:59 AM | 18 (7.8%) | 14 (5.2%) |
| 7:00 AM to 7:29 AM | 8 (3.5%) | 19 (7.1%) |
| 7:30 AM to 7:59 AM | 26 (11.3%) | 28 (10.5%) |
| 8:00 AM to 8:29 AM | 47 (20.4%) | 41 (15.4%) |
| 8:30 AM to 8:59 AM | 0 (0.0%) | 41 (15.4%) |
| 9:00 AM to 9:59 AM | 31 (13.5%) | 14 (5.2%) |
| 10:00 AM to 10:59 AM | 0 (0.0%) | 0 (0.0%) |
| 11:00 AM to 11:59 AM | 0 (0.0%) | 15 (5.6%) |
| 12:00 PM to 3:59 PM | 25 (10.9%) | 61 (22.9%) |
| 4:00 PM to 11:59 PM | 4 (1.7%) | 15 (5.6%) |
| Total | 230 (100.0%) | 267 (100.0%) |
Housing Occupancy in Ferndale
Occupancy by Ownership in Ferndale
Of the total 662 dwellings in Ferndale, owner-occupied units account for 388 (58.6%), while renter-occupied units make up 274 (41.4%).
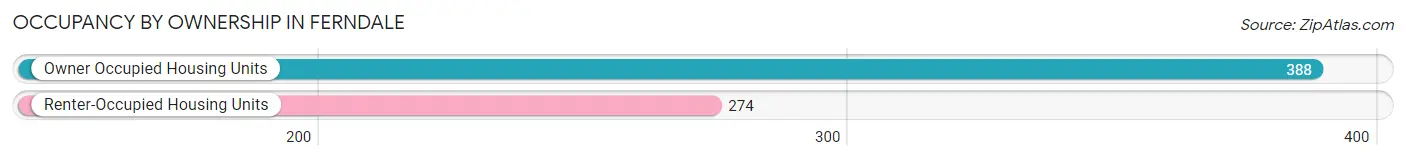
| Occupancy | # Housing Units | % Housing Units |
| Owner Occupied Housing Units | 388 | 58.6% |
| Renter-Occupied Housing Units | 274 | 41.4% |
| Total Occupied Housing Units | 662 | 100.0% |
Occupancy by Household Size in Ferndale
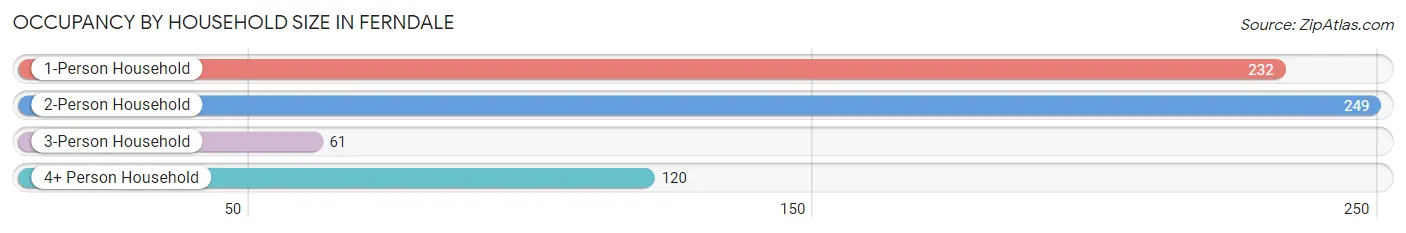
| Household Size | # Housing Units | % Housing Units |
| 1-Person Household | 232 | 35.0% |
| 2-Person Household | 249 | 37.6% |
| 3-Person Household | 61 | 9.2% |
| 4+ Person Household | 120 | 18.1% |
| Total Housing Units | 662 | 100.0% |
Occupancy by Ownership by Household Size in Ferndale
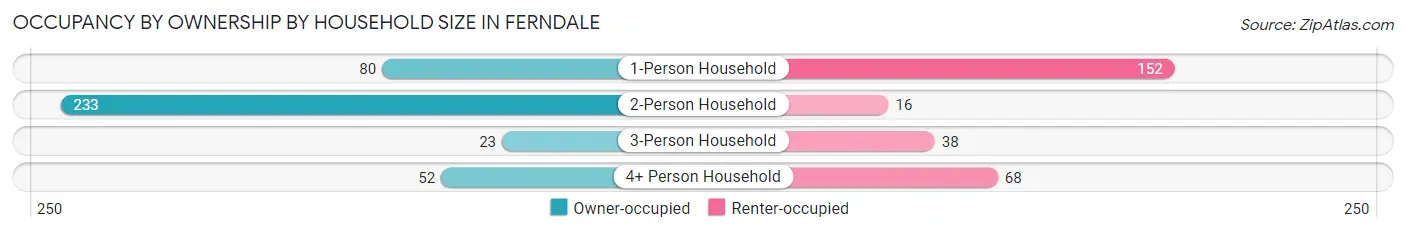
| Household Size | Owner-occupied | Renter-occupied |
| 1-Person Household | 80 (34.5%) | 152 (65.5%) |
| 2-Person Household | 233 (93.6%) | 16 (6.4%) |
| 3-Person Household | 23 (37.7%) | 38 (62.3%) |
| 4+ Person Household | 52 (43.3%) | 68 (56.7%) |
| Total Housing Units | 388 (58.6%) | 274 (41.4%) |
Occupancy by Educational Attainment in Ferndale
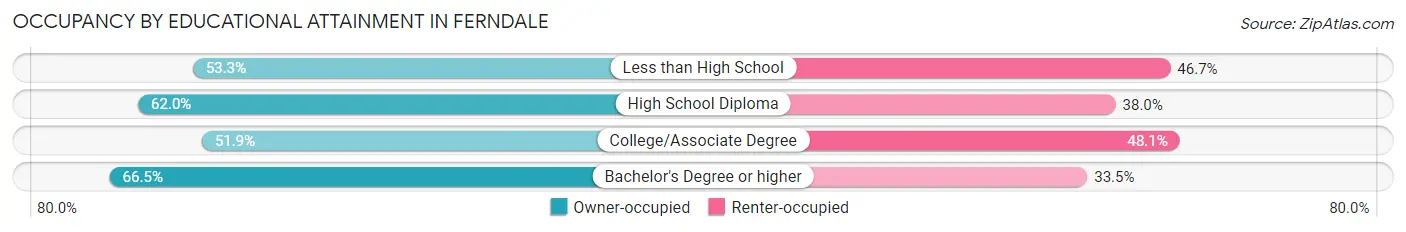
| Household Size | Owner-occupied | Renter-occupied |
| Less than High School | 16 (53.3%) | 14 (46.7%) |
| High School Diploma | 80 (62.0%) | 49 (38.0%) |
| College/Associate Degree | 151 (51.9%) | 140 (48.1%) |
| Bachelor's Degree or higher | 141 (66.5%) | 71 (33.5%) |
Occupancy by Age of Householder in Ferndale
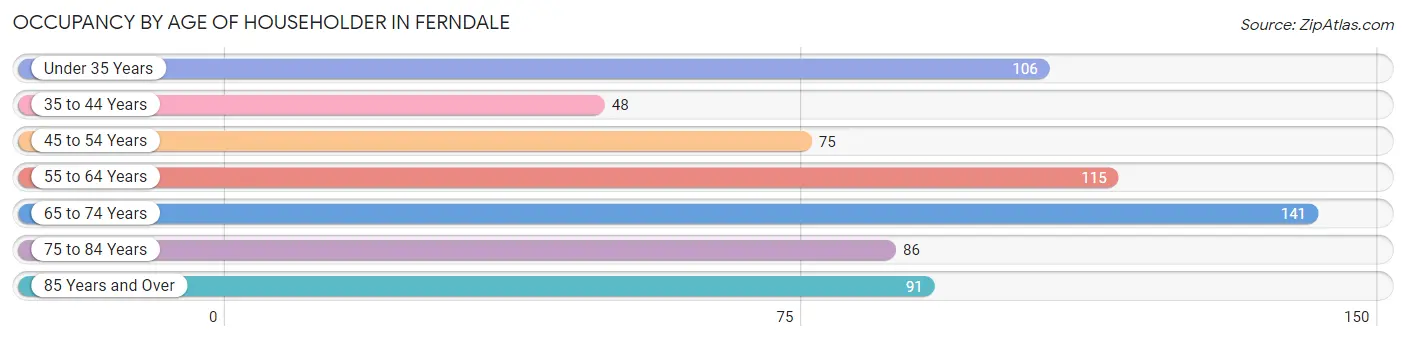
| Age Bracket | # Households | % Households |
| Under 35 Years | 106 | 16.0% |
| 35 to 44 Years | 48 | 7.2% |
| 45 to 54 Years | 75 | 11.3% |
| 55 to 64 Years | 115 | 17.4% |
| 65 to 74 Years | 141 | 21.3% |
| 75 to 84 Years | 86 | 13.0% |
| 85 Years and Over | 91 | 13.8% |
| Total | 662 | 100.0% |
Housing Finances in Ferndale
Median Income by Occupancy in Ferndale
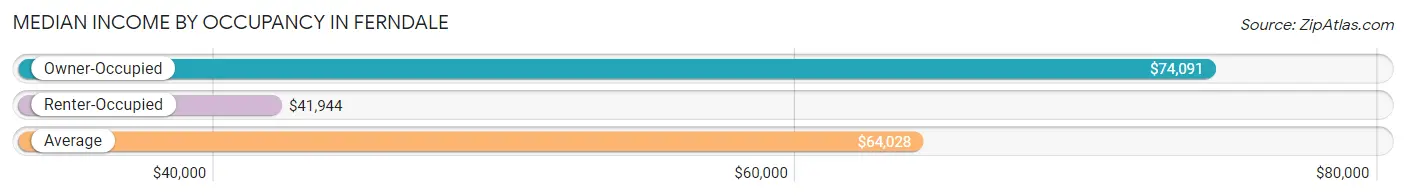
| Occupancy Type | # Households | Median Income |
| Owner-Occupied | 388 (58.6%) | $74,091 |
| Renter-Occupied | 274 (41.4%) | $41,944 |
| Average | 662 (100.0%) | $64,028 |
Occupancy by Householder Income Bracket in Ferndale
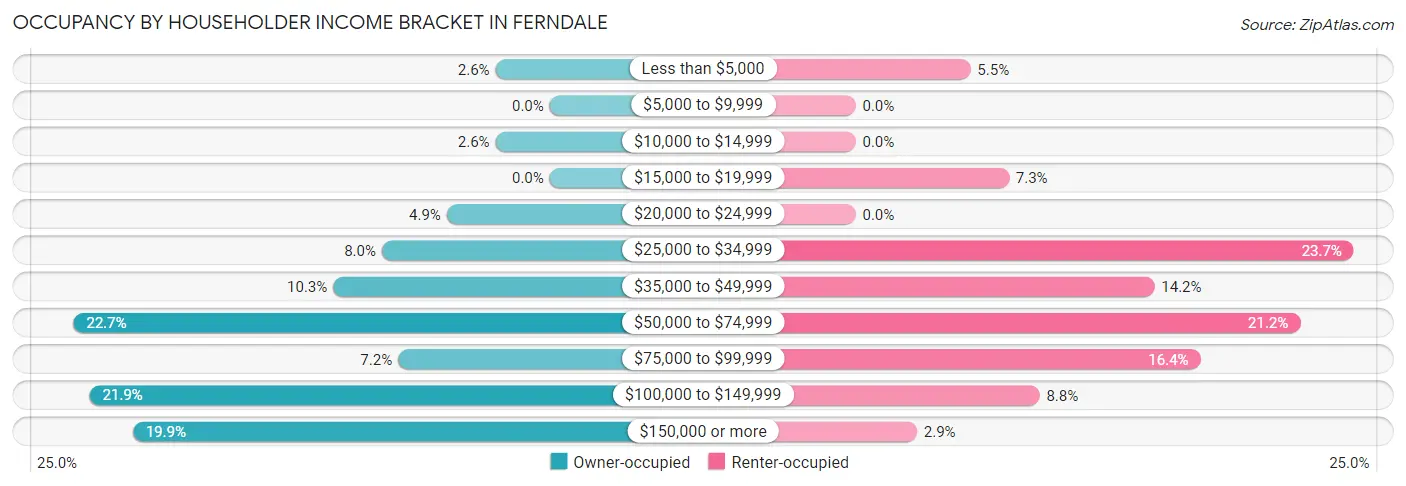
| Income Bracket | Owner-occupied | Renter-occupied |
| Less than $5,000 | 10 (2.6%) | 15 (5.5%) |
| $5,000 to $9,999 | 0 (0.0%) | 0 (0.0%) |
| $10,000 to $14,999 | 10 (2.6%) | 0 (0.0%) |
| $15,000 to $19,999 | 0 (0.0%) | 20 (7.3%) |
| $20,000 to $24,999 | 19 (4.9%) | 0 (0.0%) |
| $25,000 to $34,999 | 31 (8.0%) | 65 (23.7%) |
| $35,000 to $49,999 | 40 (10.3%) | 39 (14.2%) |
| $50,000 to $74,999 | 88 (22.7%) | 58 (21.2%) |
| $75,000 to $99,999 | 28 (7.2%) | 45 (16.4%) |
| $100,000 to $149,999 | 85 (21.9%) | 24 (8.8%) |
| $150,000 or more | 77 (19.9%) | 8 (2.9%) |
| Total | 388 (100.0%) | 274 (100.0%) |
Monthly Housing Cost Tiers in Ferndale
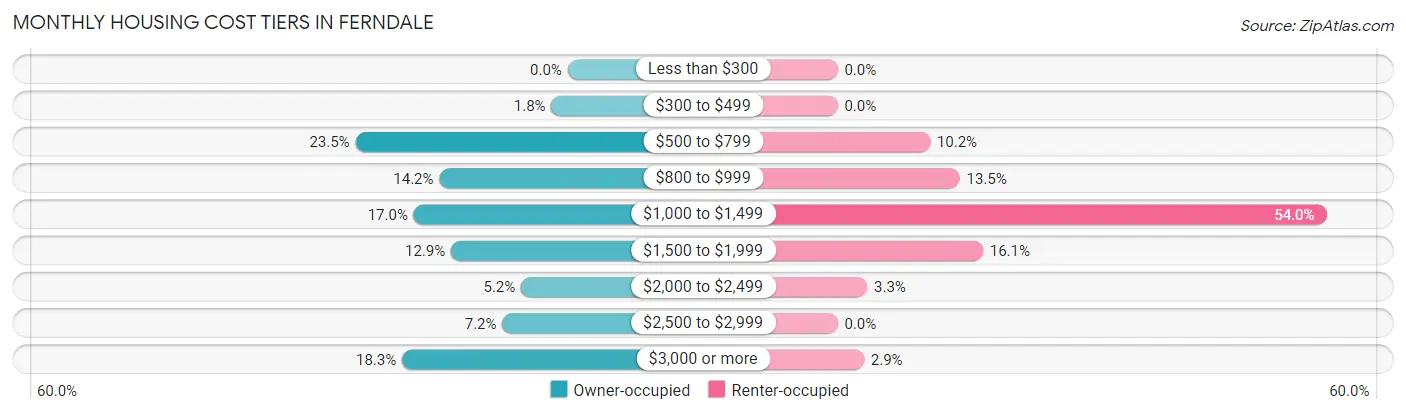
| Monthly Cost | Owner-occupied | Renter-occupied |
| Less than $300 | 0 (0.0%) | 0 (0.0%) |
| $300 to $499 | 7 (1.8%) | 0 (0.0%) |
| $500 to $799 | 91 (23.4%) | 28 (10.2%) |
| $800 to $999 | 55 (14.2%) | 37 (13.5%) |
| $1,000 to $1,499 | 66 (17.0%) | 148 (54.0%) |
| $1,500 to $1,999 | 50 (12.9%) | 44 (16.1%) |
| $2,000 to $2,499 | 20 (5.1%) | 9 (3.3%) |
| $2,500 to $2,999 | 28 (7.2%) | 0 (0.0%) |
| $3,000 or more | 71 (18.3%) | 8 (2.9%) |
| Total | 388 (100.0%) | 274 (100.0%) |
Physical Housing Characteristics in Ferndale
Housing Structures in Ferndale
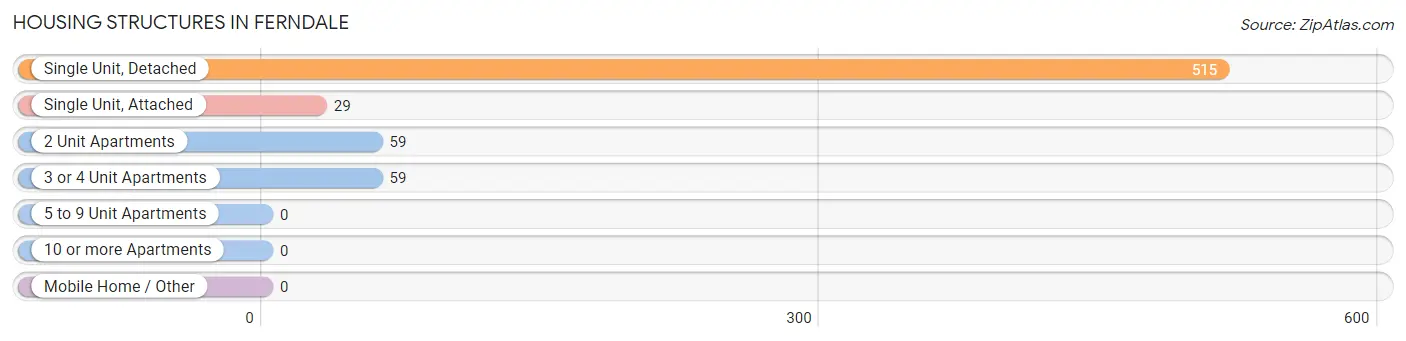
| Structure Type | # Housing Units | % Housing Units |
| Single Unit, Detached | 515 | 77.8% |
| Single Unit, Attached | 29 | 4.4% |
| 2 Unit Apartments | 59 | 8.9% |
| 3 or 4 Unit Apartments | 59 | 8.9% |
| 5 to 9 Unit Apartments | 0 | 0.0% |
| 10 or more Apartments | 0 | 0.0% |
| Mobile Home / Other | 0 | 0.0% |
| Total | 662 | 100.0% |
Housing Structures by Occupancy in Ferndale
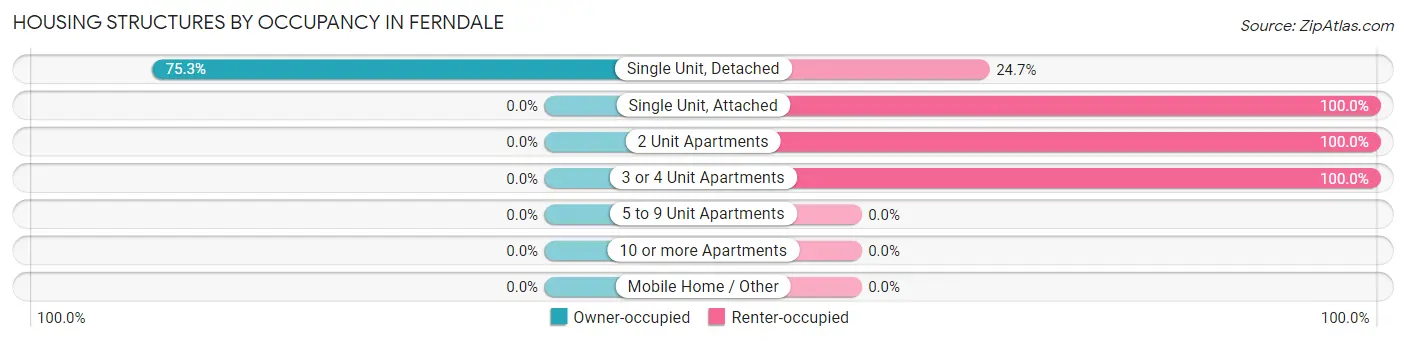
| Structure Type | Owner-occupied | Renter-occupied |
| Single Unit, Detached | 388 (75.3%) | 127 (24.7%) |
| Single Unit, Attached | 0 (0.0%) | 29 (100.0%) |
| 2 Unit Apartments | 0 (0.0%) | 59 (100.0%) |
| 3 or 4 Unit Apartments | 0 (0.0%) | 59 (100.0%) |
| 5 to 9 Unit Apartments | 0 (0.0%) | 0 (0.0%) |
| 10 or more Apartments | 0 (0.0%) | 0 (0.0%) |
| Mobile Home / Other | 0 (0.0%) | 0 (0.0%) |
| Total | 388 (58.6%) | 274 (41.4%) |
Housing Structures by Number of Rooms in Ferndale
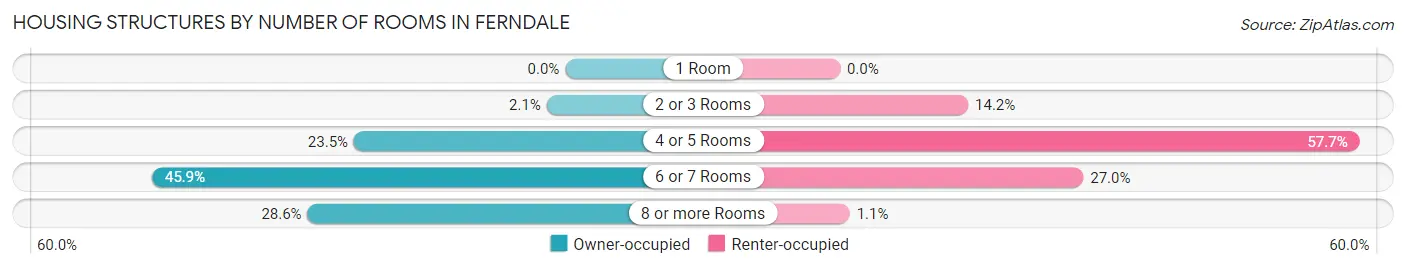
| Number of Rooms | Owner-occupied | Renter-occupied |
| 1 Room | 0 (0.0%) | 0 (0.0%) |
| 2 or 3 Rooms | 8 (2.1%) | 39 (14.2%) |
| 4 or 5 Rooms | 91 (23.4%) | 158 (57.7%) |
| 6 or 7 Rooms | 178 (45.9%) | 74 (27.0%) |
| 8 or more Rooms | 111 (28.6%) | 3 (1.1%) |
| Total | 388 (100.0%) | 274 (100.0%) |
Housing Structure by Heating Type in Ferndale
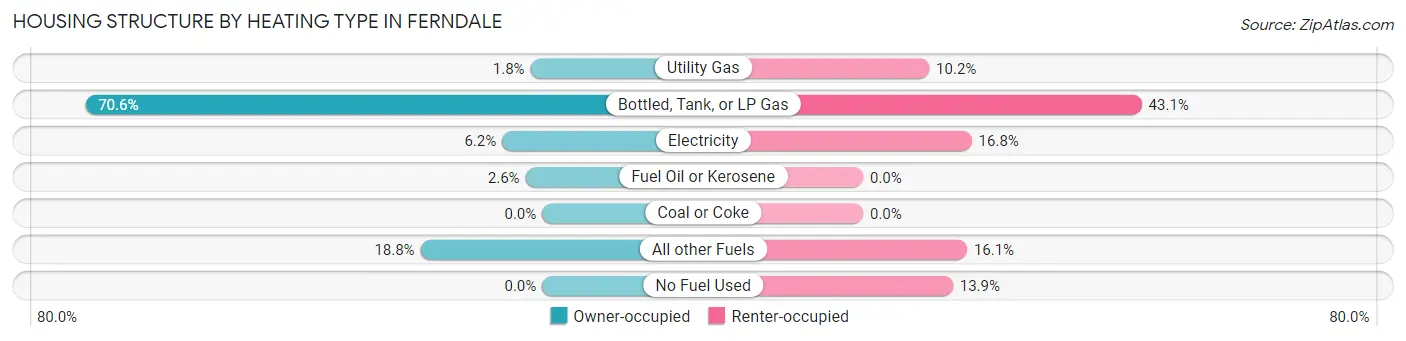
| Heating Type | Owner-occupied | Renter-occupied |
| Utility Gas | 7 (1.8%) | 28 (10.2%) |
| Bottled, Tank, or LP Gas | 274 (70.6%) | 118 (43.1%) |
| Electricity | 24 (6.2%) | 46 (16.8%) |
| Fuel Oil or Kerosene | 10 (2.6%) | 0 (0.0%) |
| Coal or Coke | 0 (0.0%) | 0 (0.0%) |
| All other Fuels | 73 (18.8%) | 44 (16.1%) |
| No Fuel Used | 0 (0.0%) | 38 (13.9%) |
| Total | 388 (100.0%) | 274 (100.0%) |
Household Vehicle Usage in Ferndale
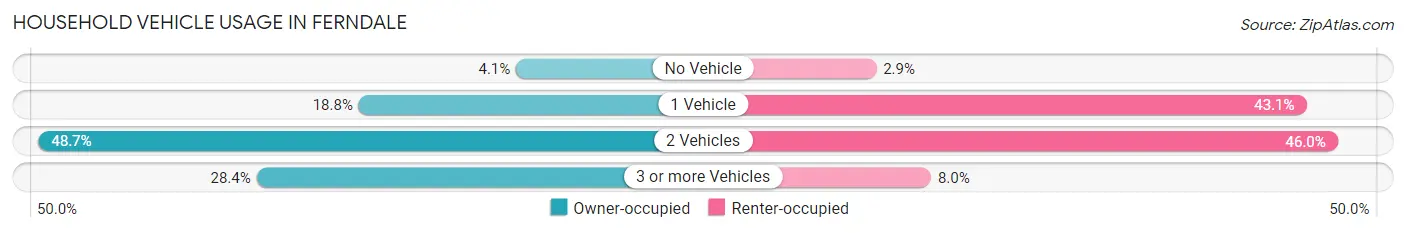
| Vehicles per Household | Owner-occupied | Renter-occupied |
| No Vehicle | 16 (4.1%) | 8 (2.9%) |
| 1 Vehicle | 73 (18.8%) | 118 (43.1%) |
| 2 Vehicles | 189 (48.7%) | 126 (46.0%) |
| 3 or more Vehicles | 110 (28.3%) | 22 (8.0%) |
| Total | 388 (100.0%) | 274 (100.0%) |
Real Estate & Mortgages in Ferndale
Real Estate and Mortgage Overview in Ferndale
| Characteristic | Without Mortgage | With Mortgage |
| Housing Units | 154 | 234 |
| Median Property Value | $487,100 | $457,400 |
| Median Household Income | $102,845 | $54 |
| Monthly Housing Costs | $700 | $71 |
| Real Estate Taxes | $2,841 | $0 |
Property Value by Mortgage Status in Ferndale
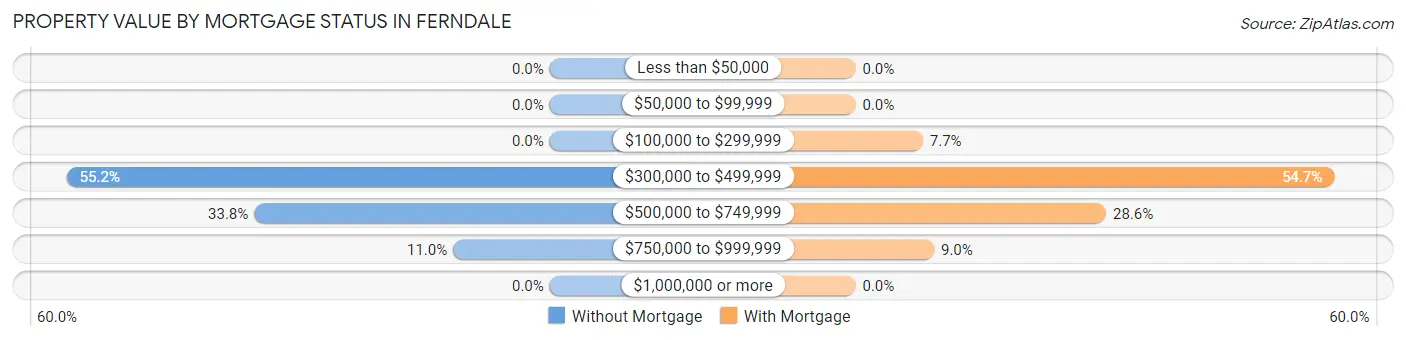
| Property Value | Without Mortgage | With Mortgage |
| Less than $50,000 | 0 (0.0%) | 0 (0.0%) |
| $50,000 to $99,999 | 0 (0.0%) | 0 (0.0%) |
| $100,000 to $299,999 | 0 (0.0%) | 18 (7.7%) |
| $300,000 to $499,999 | 85 (55.2%) | 128 (54.7%) |
| $500,000 to $749,999 | 52 (33.8%) | 67 (28.6%) |
| $750,000 to $999,999 | 17 (11.0%) | 21 (9.0%) |
| $1,000,000 or more | 0 (0.0%) | 0 (0.0%) |
| Total | 154 (100.0%) | 234 (100.0%) |
Household Income by Mortgage Status in Ferndale
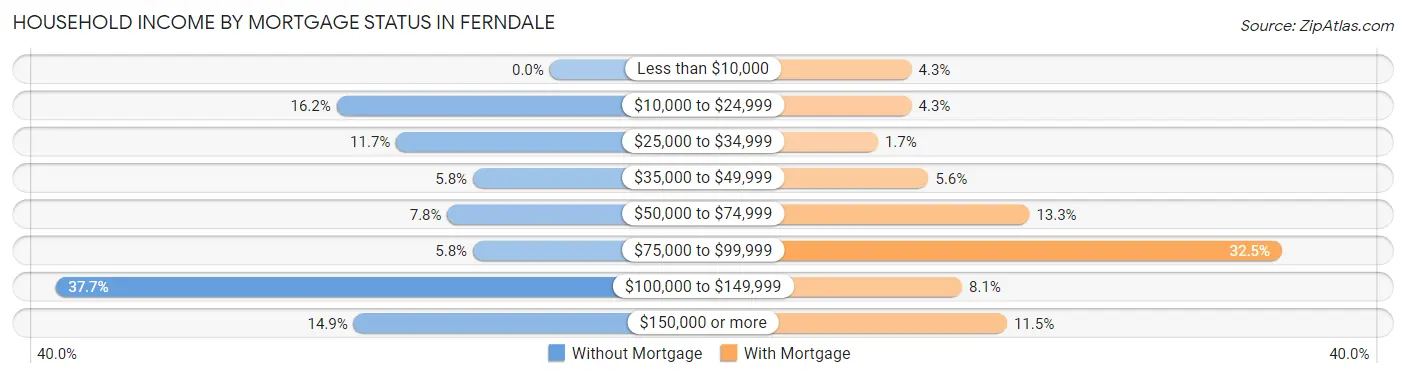
| Household Income | Without Mortgage | With Mortgage |
| Less than $10,000 | 0 (0.0%) | 10 (4.3%) |
| $10,000 to $24,999 | 25 (16.2%) | 10 (4.3%) |
| $25,000 to $34,999 | 18 (11.7%) | 4 (1.7%) |
| $35,000 to $49,999 | 9 (5.8%) | 13 (5.6%) |
| $50,000 to $74,999 | 12 (7.8%) | 31 (13.3%) |
| $75,000 to $99,999 | 9 (5.8%) | 76 (32.5%) |
| $100,000 to $149,999 | 58 (37.7%) | 19 (8.1%) |
| $150,000 or more | 23 (14.9%) | 27 (11.5%) |
| Total | 154 (100.0%) | 234 (100.0%) |
Property Value to Household Income Ratio in Ferndale
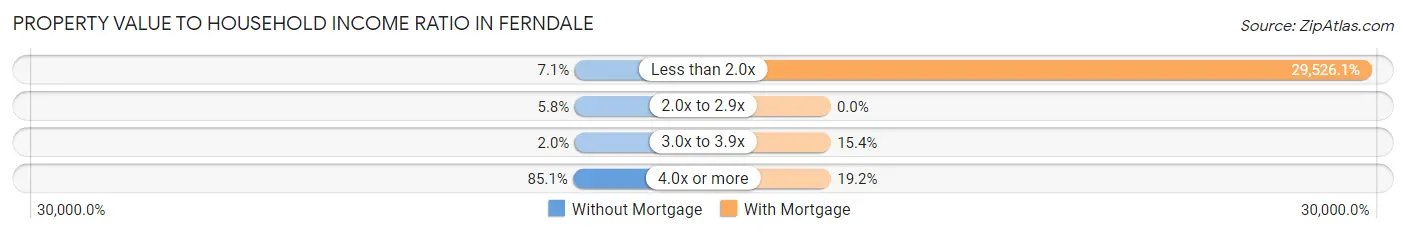
| Value-to-Income Ratio | Without Mortgage | With Mortgage |
| Less than 2.0x | 11 (7.1%) | 69,091 (29,526.1%) |
| 2.0x to 2.9x | 9 (5.8%) | 0 (0.0%) |
| 3.0x to 3.9x | 3 (1.9%) | 36 (15.4%) |
| 4.0x or more | 131 (85.1%) | 45 (19.2%) |
| Total | 154 (100.0%) | 234 (100.0%) |
Real Estate Taxes by Mortgage Status in Ferndale
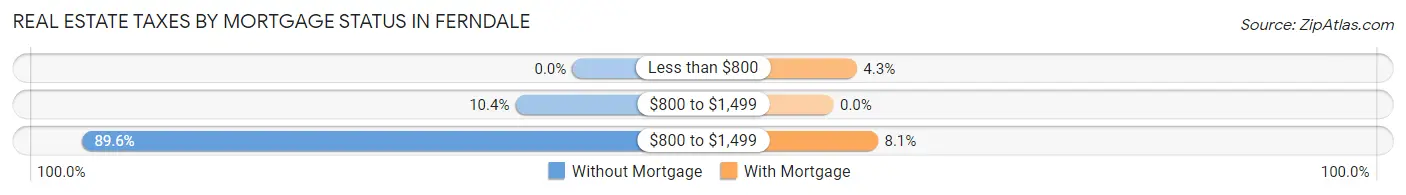
| Property Taxes | Without Mortgage | With Mortgage |
| Less than $800 | 0 (0.0%) | 10 (4.3%) |
| $800 to $1,499 | 16 (10.4%) | 0 (0.0%) |
| $800 to $1,499 | 138 (89.6%) | 19 (8.1%) |
| Total | 154 (100.0%) | 234 (100.0%) |
Health & Disability in Ferndale
Health Insurance Coverage by Age in Ferndale
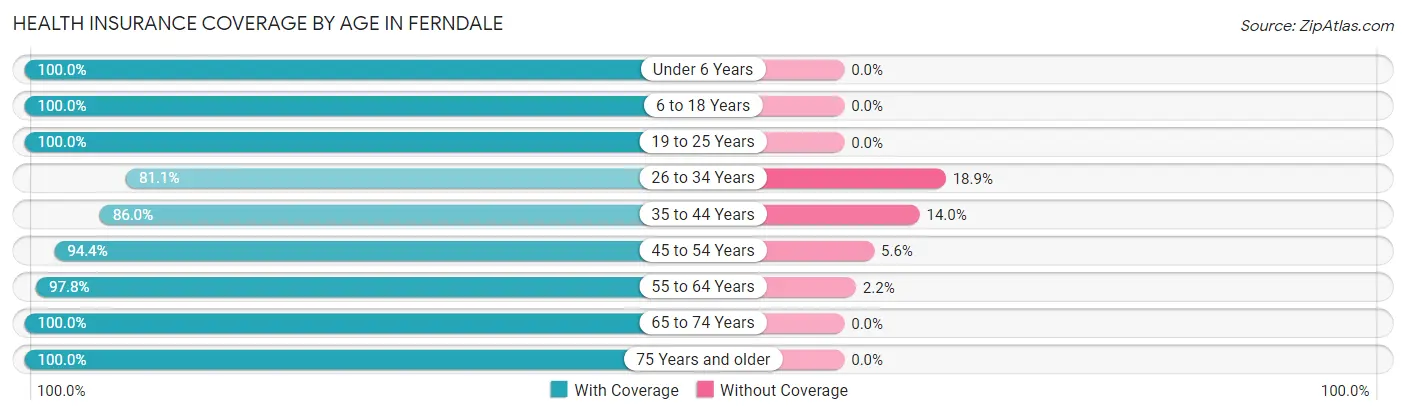
| Age Bracket | With Coverage | Without Coverage |
| Under 6 Years | 64 (100.0%) | 0 (0.0%) |
| 6 to 18 Years | 182 (100.0%) | 0 (0.0%) |
| 19 to 25 Years | 205 (100.0%) | 0 (0.0%) |
| 26 to 34 Years | 90 (81.1%) | 21 (18.9%) |
| 35 to 44 Years | 98 (86.0%) | 16 (14.0%) |
| 45 to 54 Years | 119 (94.4%) | 7 (5.6%) |
| 55 to 64 Years | 272 (97.8%) | 6 (2.2%) |
| 65 to 74 Years | 270 (100.0%) | 0 (0.0%) |
| 75 Years and older | 219 (100.0%) | 0 (0.0%) |
| Total | 1,519 (96.8%) | 50 (3.2%) |
Health Insurance Coverage by Citizenship Status in Ferndale
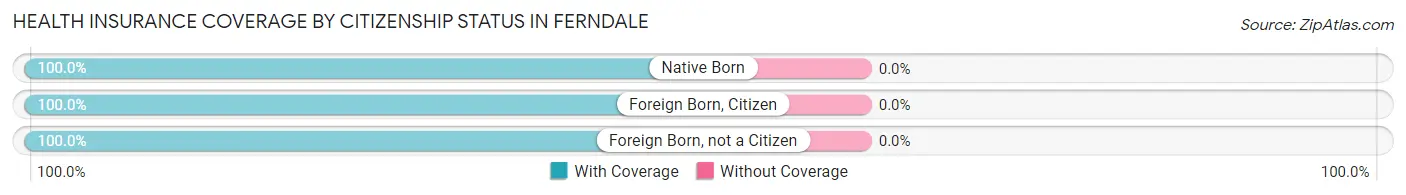
| Citizenship Status | With Coverage | Without Coverage |
| Native Born | 64 (100.0%) | 0 (0.0%) |
| Foreign Born, Citizen | 182 (100.0%) | 0 (0.0%) |
| Foreign Born, not a Citizen | 205 (100.0%) | 0 (0.0%) |
Health Insurance Coverage by Household Income in Ferndale
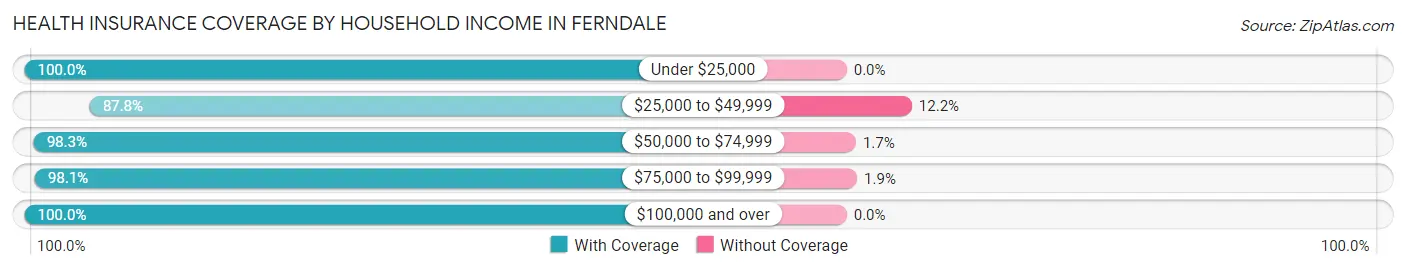
| Household Income | With Coverage | Without Coverage |
| Under $25,000 | 96 (100.0%) | 0 (0.0%) |
| $25,000 to $49,999 | 288 (87.8%) | 40 (12.2%) |
| $50,000 to $74,999 | 342 (98.3%) | 6 (1.7%) |
| $75,000 to $99,999 | 202 (98.1%) | 4 (1.9%) |
| $100,000 and over | 591 (100.0%) | 0 (0.0%) |
Public vs Private Health Insurance Coverage by Age in Ferndale
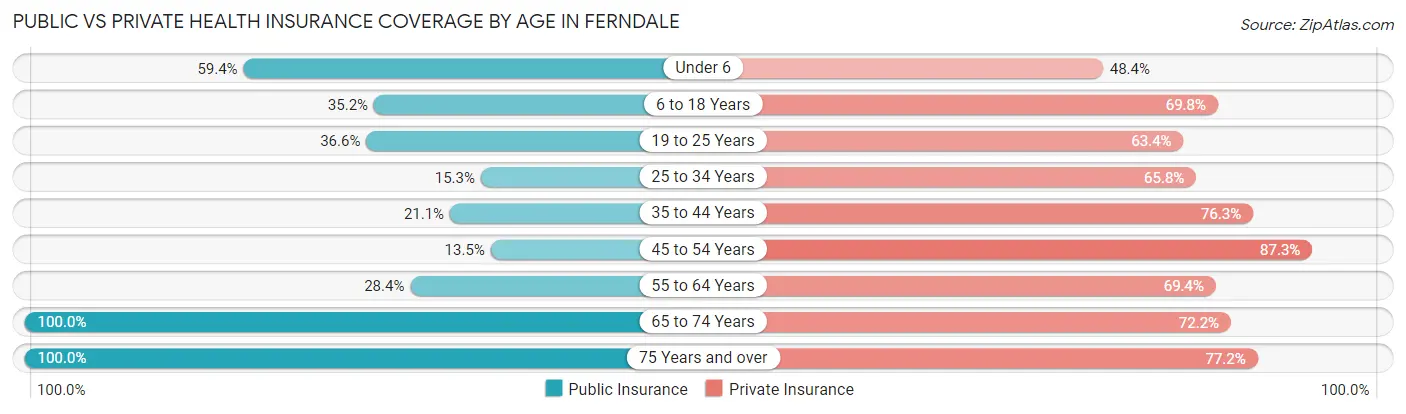
| Age Bracket | Public Insurance | Private Insurance |
| Under 6 | 38 (59.4%) | 31 (48.4%) |
| 6 to 18 Years | 64 (35.2%) | 127 (69.8%) |
| 19 to 25 Years | 75 (36.6%) | 130 (63.4%) |
| 25 to 34 Years | 17 (15.3%) | 73 (65.8%) |
| 35 to 44 Years | 24 (21.0%) | 87 (76.3%) |
| 45 to 54 Years | 17 (13.5%) | 110 (87.3%) |
| 55 to 64 Years | 79 (28.4%) | 193 (69.4%) |
| 65 to 74 Years | 270 (100.0%) | 195 (72.2%) |
| 75 Years and over | 219 (100.0%) | 169 (77.2%) |
| Total | 803 (51.2%) | 1,115 (71.1%) |
Disability Status by Sex by Age in Ferndale
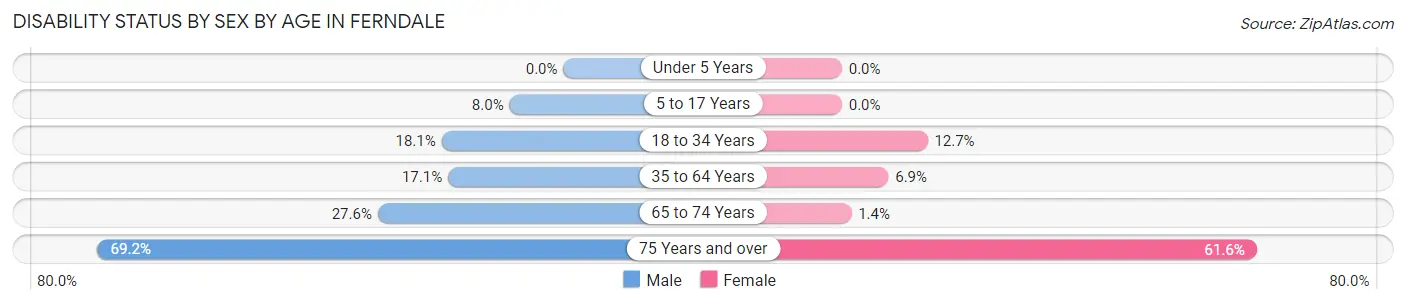
| Age Bracket | Male | Female |
| Under 5 Years | 0 (0.0%) | 0 (0.0%) |
| 5 to 17 Years | 10 (8.0%) | 0 (0.0%) |
| 18 to 34 Years | 17 (18.1%) | 29 (12.7%) |
| 35 to 64 Years | 49 (17.1%) | 16 (6.9%) |
| 65 to 74 Years | 35 (27.6%) | 2 (1.4%) |
| 75 Years and over | 65 (69.2%) | 77 (61.6%) |
Disability Class by Sex by Age in Ferndale
Disability Class: Hearing Difficulty
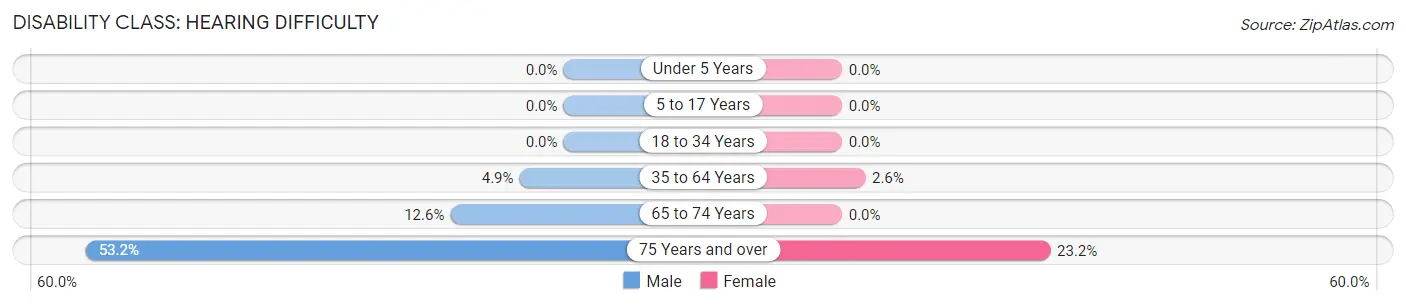
| Age Bracket | Male | Female |
| Under 5 Years | 0 (0.0%) | 0 (0.0%) |
| 5 to 17 Years | 0 (0.0%) | 0 (0.0%) |
| 18 to 34 Years | 0 (0.0%) | 0 (0.0%) |
| 35 to 64 Years | 14 (4.9%) | 6 (2.6%) |
| 65 to 74 Years | 16 (12.6%) | 0 (0.0%) |
| 75 Years and over | 50 (53.2%) | 29 (23.2%) |
Disability Class: Vision Difficulty
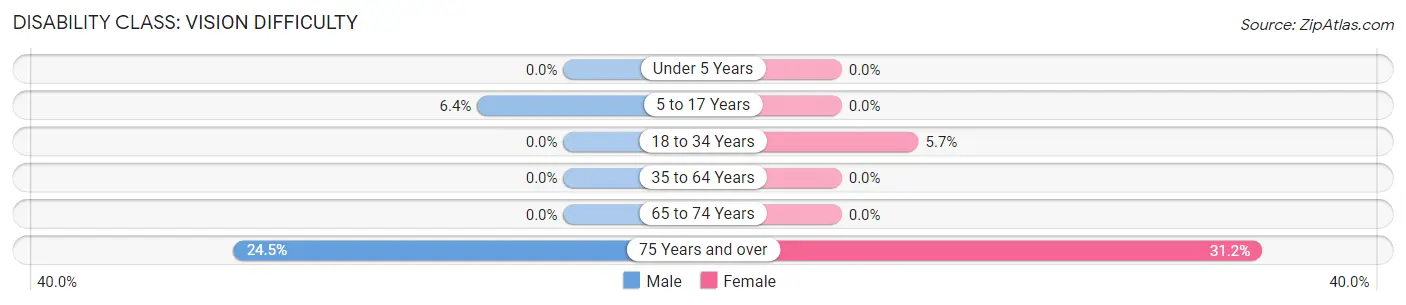
| Age Bracket | Male | Female |
| Under 5 Years | 0 (0.0%) | 0 (0.0%) |
| 5 to 17 Years | 8 (6.4%) | 0 (0.0%) |
| 18 to 34 Years | 0 (0.0%) | 13 (5.7%) |
| 35 to 64 Years | 0 (0.0%) | 0 (0.0%) |
| 65 to 74 Years | 0 (0.0%) | 0 (0.0%) |
| 75 Years and over | 23 (24.5%) | 39 (31.2%) |
Disability Class: Cognitive Difficulty
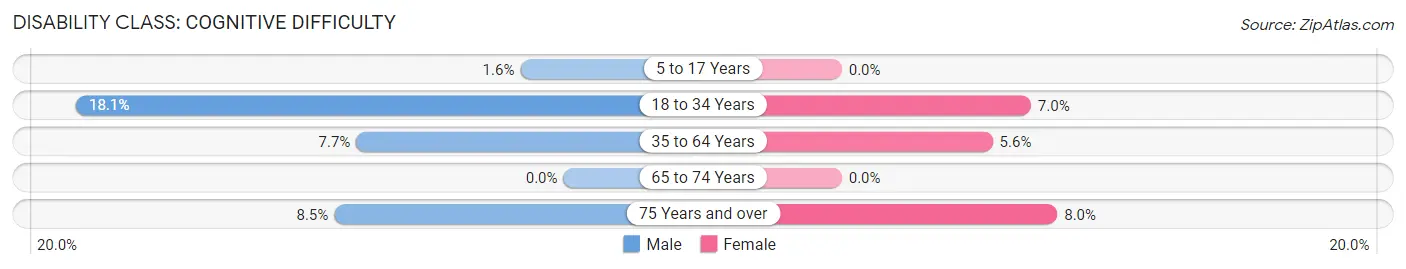
| Age Bracket | Male | Female |
| 5 to 17 Years | 2 (1.6%) | 0 (0.0%) |
| 18 to 34 Years | 17 (18.1%) | 16 (7.0%) |
| 35 to 64 Years | 22 (7.7%) | 13 (5.6%) |
| 65 to 74 Years | 0 (0.0%) | 0 (0.0%) |
| 75 Years and over | 8 (8.5%) | 10 (8.0%) |
Disability Class: Ambulatory Difficulty
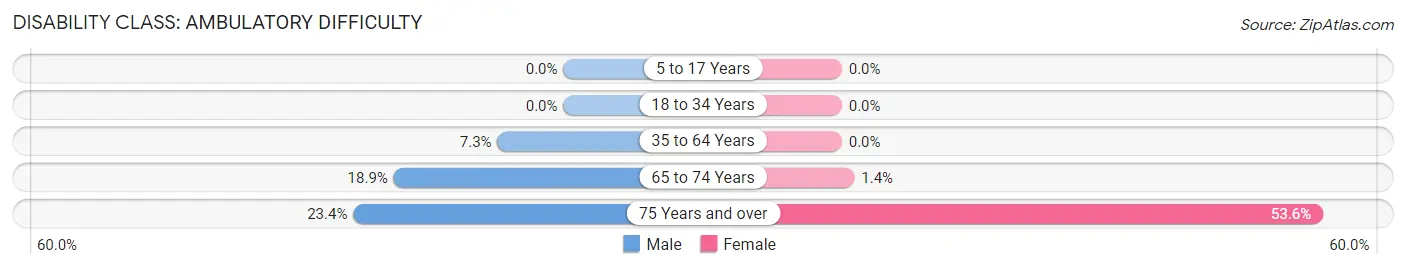
| Age Bracket | Male | Female |
| 5 to 17 Years | 0 (0.0%) | 0 (0.0%) |
| 18 to 34 Years | 0 (0.0%) | 0 (0.0%) |
| 35 to 64 Years | 21 (7.3%) | 0 (0.0%) |
| 65 to 74 Years | 24 (18.9%) | 2 (1.4%) |
| 75 Years and over | 22 (23.4%) | 67 (53.6%) |
Disability Class: Self-Care Difficulty
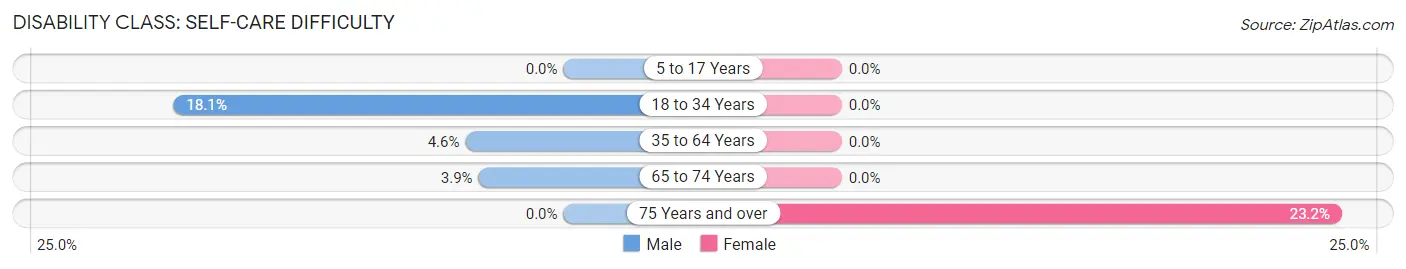
| Age Bracket | Male | Female |
| 5 to 17 Years | 0 (0.0%) | 0 (0.0%) |
| 18 to 34 Years | 17 (18.1%) | 0 (0.0%) |
| 35 to 64 Years | 13 (4.5%) | 0 (0.0%) |
| 65 to 74 Years | 5 (3.9%) | 0 (0.0%) |
| 75 Years and over | 0 (0.0%) | 29 (23.2%) |
Technology Access in Ferndale
Computing Device Access in Ferndale
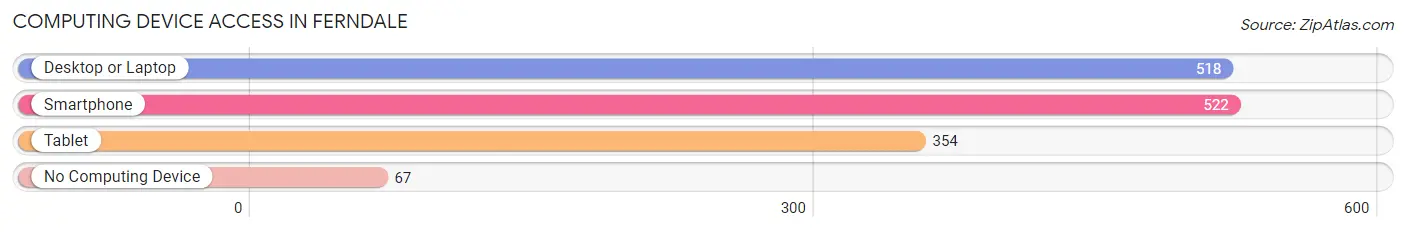
| Device Type | # Households | % Households |
| Desktop or Laptop | 518 | 78.2% |
| Smartphone | 522 | 78.8% |
| Tablet | 354 | 53.5% |
| No Computing Device | 67 | 10.1% |
| Total | 662 | 100.0% |
Internet Access in Ferndale
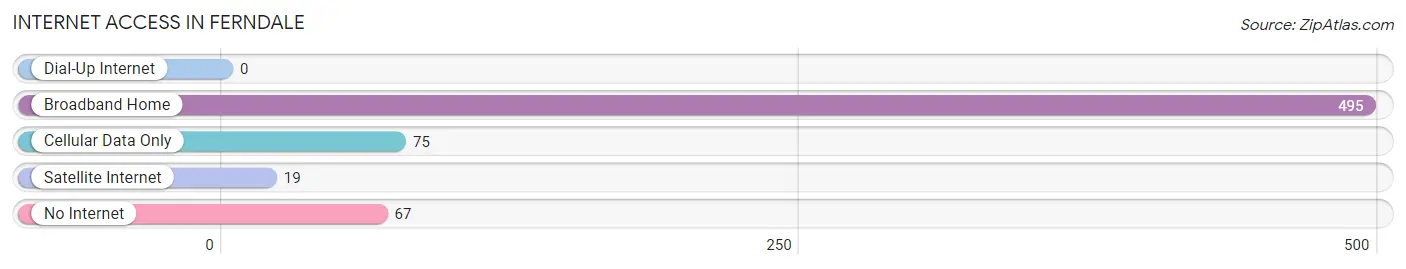
| Internet Type | # Households | % Households |
| Dial-Up Internet | 0 | 0.0% |
| Broadband Home | 495 | 74.8% |
| Cellular Data Only | 75 | 11.3% |
| Satellite Internet | 19 | 2.9% |
| No Internet | 67 | 10.1% |
| Total | 662 | 100.0% |
Ferndale Summary
Ferndale is a small town located in Humboldt County, California, United States. It is situated on the Pacific Coast, about 20 miles south of Eureka, the county seat. The population of Ferndale was 1,371 at the 2010 census, down from its peak of 1,382 in the 2000 census.
History
Ferndale was founded in 1852 by William Carson, a Scottish immigrant who had come to California during the Gold Rush. He purchased the land from the local Wiyot tribe and named the town after the ferns that grew in abundance in the area. The town quickly grew and became a center of commerce for the surrounding area.
In the late 19th century, Ferndale was a popular tourist destination, with many visitors coming to see the Victorian-style homes and buildings. The town was also known for its dairy farms and cheese production.
In the early 20th century, Ferndale was the site of a major lumber mill, which provided jobs for many of the town's residents. The mill closed in the 1950s, but the town remains a center of the local timber industry.
Geography
Ferndale is located at 40°45'25" North, 124°14'17" West (40.756944, -124.238333). It is situated on the Pacific Coast, about 20 miles south of Eureka, the county seat. The town is surrounded by rolling hills and is located near the Eel River.
The climate in Ferndale is mild, with temperatures rarely reaching above 80 degrees Fahrenheit in the summer and rarely dropping below 40 degrees Fahrenheit in the winter. The area receives an average of 40 inches of rain per year.
Economy
Ferndale's economy is largely based on the timber industry. The town is home to several lumber mills, which provide jobs for many of the town's residents. The town is also home to several small businesses, including restaurants, shops, and galleries.
The town is also a popular tourist destination, with many visitors coming to see the Victorian-style homes and buildings. The town is also known for its dairy farms and cheese production.
Demographics
As of the 2010 census, there were 1,371 people, 590 households, and 355 families residing in Ferndale. The population density was 1,092.3 people per square mile (421.7/km2). The racial makeup of Ferndale was 94.2% White, 0.2% African American, 0.7% Native American, 0.7% Asian, 0.1% Pacific Islander, 1.2% from other races, and 2.9% from two or more races. Hispanic or Latino of any race were 4.2% of the population.
The median income for a household in Ferndale was $41,250, and the median income for a family was $50,000. Males had a median income of $41,250 versus $30,000 for females. The per capita income for the town was $20,945. About 8.2% of families and 11.2% of the population were below the poverty line, including 16.2% of those under age 18 and 5.2% of those age 65 or over.
Common Questions
What is Per Capita Income in Ferndale?
Per Capita income in Ferndale is $38,203.
What is the Median Family Income in Ferndale?
Median Family Income in Ferndale is $77,917.
What is the Median Household income in Ferndale?
Median Household Income in Ferndale is $64,028.
What is Income or Wage Gap in Ferndale?
Income or Wage Gap in Ferndale is 37.7%.
Women in Ferndale earn 62.3 cents for every dollar earned by a man.
What is Inequality or Gini Index in Ferndale?
Inequality or Gini Index in Ferndale is 0.44.
What is the Total Population of Ferndale?
Total Population of Ferndale is 1,569.
What is the Total Male Population of Ferndale?
Total Male Population of Ferndale is 748.
What is the Total Female Population of Ferndale?
Total Female Population of Ferndale is 821.
What is the Ratio of Males per 100 Females in Ferndale?
There are 91.11 Males per 100 Females in Ferndale.
What is the Ratio of Females per 100 Males in Ferndale?
There are 109.76 Females per 100 Males in Ferndale.
What is the Median Population Age in Ferndale?
Median Population Age in Ferndale is 53.1 Years.
What is the Average Family Size in Ferndale
Average Family Size in Ferndale is 3.0 People.
What is the Average Household Size in Ferndale
Average Household Size in Ferndale is 2.4 People.
How Large is the Labor Force in Ferndale?
There are 653 People in the Labor Forcein in Ferndale.
What is the Percentage of People in the Labor Force in Ferndale?
48.2% of People are in the Labor Force in Ferndale.
What is the Unemployment Rate in Ferndale?
Unemployment Rate in Ferndale is 8.7%.