Cities with the Highest Percentage of Population Employed in Finance & Insurance in Kentucky
RELATED REPORTS & OPTIONS
Finance & Insurance
Kentucky
Compare Cities
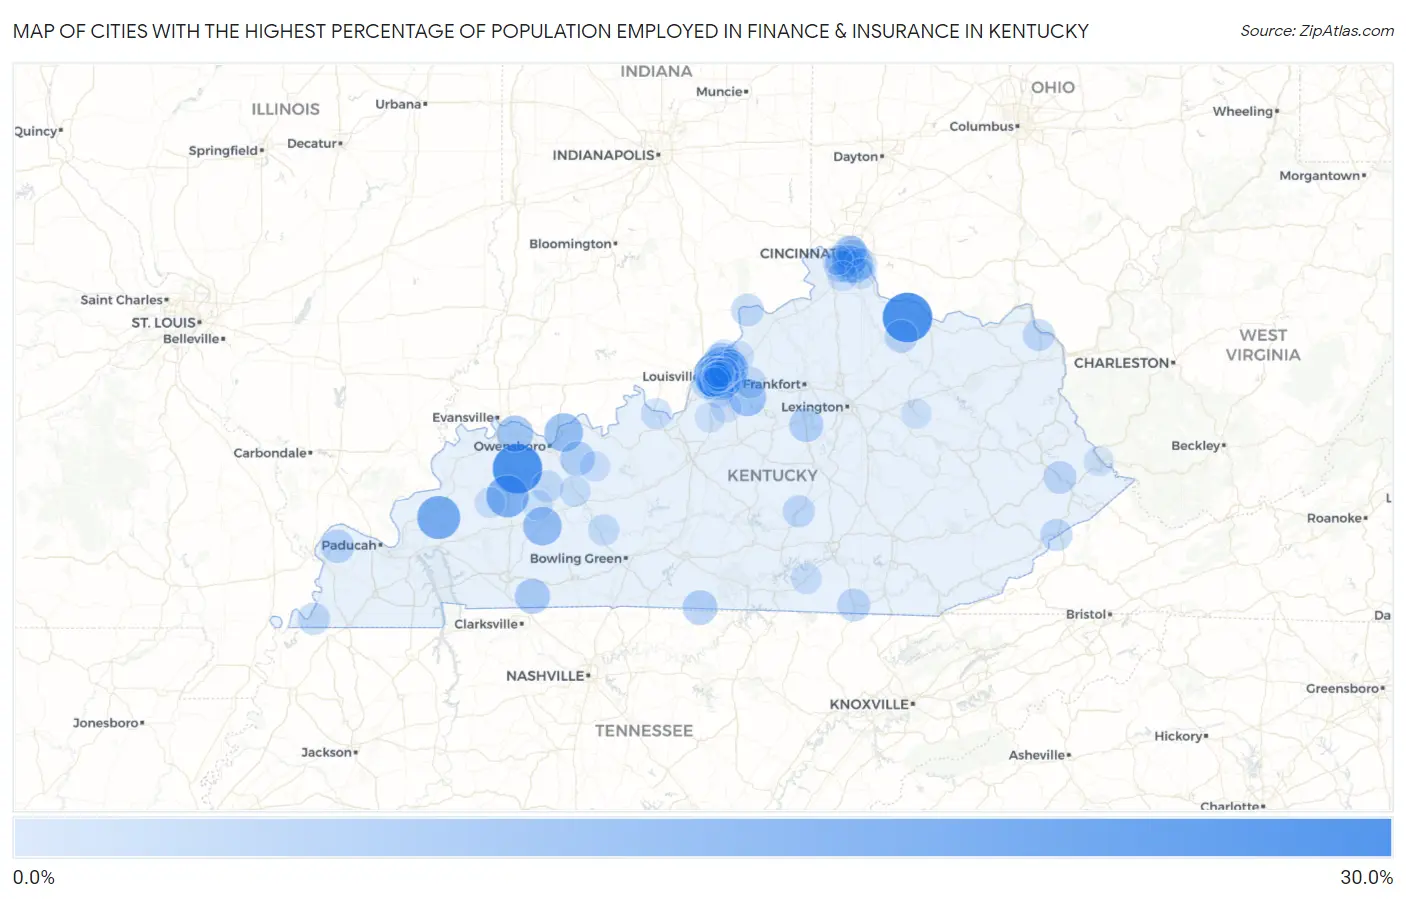
Map of Cities with the Highest Percentage of Population Employed in Finance & Insurance in Kentucky
0.0%
30.0%
Cities with the Highest Percentage of Population Employed in Finance & Insurance in Kentucky
| City | % Employed | vs State | vs National | |
| 1. | Germantown | 29.5% | 4.2%(+25.3)#1 | 4.8%(+24.7)#162 |
| 2. | Beech Grove | 29.4% | 4.2%(+25.2)#2 | 4.8%(+24.6)#163 |
| 3. | Maryhill Estates | 23.7% | 4.2%(+19.4)#3 | 4.8%(+18.9)#244 |
| 4. | Crayne | 21.8% | 4.2%(+17.6)#4 | 4.8%(+17.0)#296 |
| 5. | Hanson | 20.7% | 4.2%(+16.4)#5 | 4.8%(+15.9)#337 |
| 6. | Philpot | 17.6% | 4.2%(+13.4)#6 | 4.8%(+12.9)#489 |
| 7. | Fincastle | 16.7% | 4.2%(+12.5)#7 | 4.8%(+12.0)#537 |
| 8. | West Van Lear | 16.6% | 4.2%(+12.4)#8 | 4.8%(+11.8)#548 |
| 9. | Greenville | 16.5% | 4.2%(+12.3)#9 | 4.8%(+11.8)#552 |
| 10. | Maceo | 16.4% | 4.2%(+12.2)#10 | 4.8%(+11.7)#559 |
| 11. | Druid Hills | 15.6% | 4.2%(+11.4)#11 | 4.8%(+10.8)#628 |
| 12. | Elk Creek | 15.0% | 4.2%(+10.8)#12 | 4.8%(+10.3)#693 |
| 13. | Hurstbourne Acres | 15.0% | 4.2%(+10.8)#13 | 4.8%(+10.2)#702 |
| 14. | Old Brownsboro Place | 14.5% | 4.2%(+10.2)#14 | 4.8%(+9.68)#759 |
| 15. | Bellemeade | 14.0% | 4.2%(+9.80)#15 | 4.8%(+9.25)#836 |
| 16. | Spottsville | 13.9% | 4.2%(+9.70)#16 | 4.8%(+9.16)#848 |
| 17. | Kingsley | 13.9% | 4.2%(+9.65)#17 | 4.8%(+9.10)#852 |
| 18. | Glenview | 13.6% | 4.2%(+9.37)#18 | 4.8%(+8.82)#889 |
| 19. | Cold Spring | 13.5% | 4.2%(+9.27)#19 | 4.8%(+8.72)#909 |
| 20. | Murray Hill | 12.8% | 4.2%(+8.56)#20 | 4.8%(+8.01)#1,036 |
| 21. | Blue Ridge Manor | 12.7% | 4.2%(+8.43)#21 | 4.8%(+7.88)#1,065 |
| 22. | Trenton | 12.6% | 4.2%(+8.36)#22 | 4.8%(+7.81)#1,080 |
| 23. | Whitesville | 12.2% | 4.2%(+7.94)#23 | 4.8%(+7.39)#1,183 |
| 24. | Westwood | 12.1% | 4.2%(+7.84)#24 | 4.8%(+7.29)#1,215 |
| 25. | Langdon Place | 11.9% | 4.2%(+7.69)#25 | 4.8%(+7.14)#1,258 |
| 26. | Gamaliel | 11.9% | 4.2%(+7.67)#26 | 4.8%(+7.12)#1,263 |
| 27. | River Bluff | 11.6% | 4.2%(+7.42)#27 | 4.8%(+6.87)#1,327 |
| 28. | Barbourmeade | 11.6% | 4.2%(+7.41)#28 | 4.8%(+6.86)#1,329 |
| 29. | Manor Creek | 11.5% | 4.2%(+7.24)#29 | 4.8%(+6.70)#1,377 |
| 30. | Bellevue | 11.4% | 4.2%(+7.23)#30 | 4.8%(+6.68)#1,387 |
| 31. | Salvisa | 11.3% | 4.2%(+7.10)#31 | 4.8%(+6.55)#1,422 |
| 32. | Prospect | 11.2% | 4.2%(+6.99)#32 | 4.8%(+6.44)#1,459 |
| 33. | Taylor Mill | 11.1% | 4.2%(+6.87)#33 | 4.8%(+6.32)#1,501 |
| 34. | Goose Creek | 11.0% | 4.2%(+6.80)#34 | 4.8%(+6.25)#1,525 |
| 35. | Orchard Grass Hills | 10.8% | 4.2%(+6.55)#35 | 4.8%(+6.00)#1,611 |
| 36. | Rolling Fields | 10.7% | 4.2%(+6.46)#36 | 4.8%(+5.92)#1,640 |
| 37. | Briarwood | 10.5% | 4.2%(+6.31)#37 | 4.8%(+5.76)#1,693 |
| 38. | La Center | 10.5% | 4.2%(+6.29)#38 | 4.8%(+5.74)#1,706 |
| 39. | Seneca Gardens | 10.5% | 4.2%(+6.23)#39 | 4.8%(+5.69)#1,721 |
| 40. | Fort Thomas | 10.4% | 4.2%(+6.15)#40 | 4.8%(+5.60)#1,748 |
| 41. | Mount Olivet | 10.2% | 4.2%(+5.98)#41 | 4.8%(+5.44)#1,820 |
| 42. | Woodland Hills | 10.2% | 4.2%(+5.95)#42 | 4.8%(+5.41)#1,833 |
| 43. | Pine Knot | 10.0% | 4.2%(+5.82)#43 | 4.8%(+5.27)#1,895 |
| 44. | Brownsboro Farm | 10.0% | 4.2%(+5.81)#44 | 4.8%(+5.27)#1,897 |
| 45. | Fort Wright | 10.0% | 4.2%(+5.80)#45 | 4.8%(+5.25)#1,901 |
| 46. | Lincolnshire | 10.0% | 4.2%(+5.78)#46 | 4.8%(+5.23)#1,918 |
| 47. | Glenview Hills | 9.9% | 4.2%(+5.67)#47 | 4.8%(+5.12)#1,967 |
| 48. | Betsy Layne | 9.9% | 4.2%(+5.63)#48 | 4.8%(+5.08)#1,991 |
| 49. | Wilder | 9.8% | 4.2%(+5.57)#49 | 4.8%(+5.02)#2,012 |
| 50. | Milton | 9.5% | 4.2%(+5.24)#50 | 4.8%(+4.70)#2,211 |
| 51. | Riverwood | 9.3% | 4.2%(+5.12)#51 | 4.8%(+4.57)#2,281 |
| 52. | Hurstbourne | 9.3% | 4.2%(+5.08)#52 | 4.8%(+4.53)#2,301 |
| 53. | Hickman | 9.3% | 4.2%(+5.04)#53 | 4.8%(+4.50)#2,319 |
| 54. | Liberty | 9.2% | 4.2%(+4.98)#54 | 4.8%(+4.44)#2,360 |
| 55. | Edgewood | 9.2% | 4.2%(+4.98)#55 | 4.8%(+4.43)#2,361 |
| 56. | Payne Gap | 9.1% | 4.2%(+4.87)#56 | 4.8%(+4.32)#2,420 |
| 57. | Greenup | 9.0% | 4.2%(+4.83)#57 | 4.8%(+4.28)#2,457 |
| 58. | Bancroft | 8.9% | 4.2%(+4.70)#58 | 4.8%(+4.15)#2,535 |
| 59. | Plantation | 8.9% | 4.2%(+4.69)#59 | 4.8%(+4.15)#2,541 |
| 60. | Green Spring | 8.9% | 4.2%(+4.67)#60 | 4.8%(+4.12)#2,559 |
| 61. | Simpsonville | 8.9% | 4.2%(+4.65)#61 | 4.8%(+4.10)#2,574 |
| 62. | Hickory Hill | 8.8% | 4.2%(+4.60)#62 | 4.8%(+4.06)#2,608 |
| 63. | Wildwood | 8.8% | 4.2%(+4.55)#63 | 4.8%(+4.00)#2,638 |
| 64. | Livermore | 8.7% | 4.2%(+4.48)#64 | 4.8%(+3.93)#2,684 |
| 65. | Windy Hills | 8.6% | 4.2%(+4.35)#65 | 4.8%(+3.80)#2,783 |
| 66. | Strathmoor Manor | 8.5% | 4.2%(+4.24)#66 | 4.8%(+3.69)#2,870 |
| 67. | Woodbury | 8.3% | 4.2%(+4.11)#67 | 4.8%(+3.57)#2,968 |
| 68. | Audubon Park | 8.3% | 4.2%(+4.08)#68 | 4.8%(+3.53)#2,993 |
| 69. | Melbourne | 8.3% | 4.2%(+4.07)#69 | 4.8%(+3.52)#3,002 |
| 70. | Moorland | 8.2% | 4.2%(+3.94)#70 | 4.8%(+3.40)#3,095 |
| 71. | Strathmoor Village | 8.1% | 4.2%(+3.93)#71 | 4.8%(+3.38)#3,105 |
| 72. | Jeffersontown | 8.0% | 4.2%(+3.77)#72 | 4.8%(+3.23)#3,245 |
| 73. | Hartford | 8.0% | 4.2%(+3.76)#73 | 4.8%(+3.22)#3,251 |
| 74. | Brandenburg | 7.9% | 4.2%(+3.70)#74 | 4.8%(+3.16)#3,320 |
| 75. | Monticello | 7.7% | 4.2%(+3.48)#75 | 4.8%(+2.93)#3,518 |
| 76. | Goshen | 7.7% | 4.2%(+3.47)#76 | 4.8%(+2.92)#3,530 |
| 77. | Spring Mill | 7.7% | 4.2%(+3.47)#77 | 4.8%(+2.92)#3,536 |
| 78. | Indian Hills | 7.7% | 4.2%(+3.45)#78 | 4.8%(+2.90)#3,569 |
| 79. | St Matthews | 7.6% | 4.2%(+3.42)#79 | 4.8%(+2.87)#3,601 |
| 80. | Beechwood Village | 7.6% | 4.2%(+3.42)#80 | 4.8%(+2.87)#3,604 |
| 81. | Nebo | 7.6% | 4.2%(+3.40)#81 | 4.8%(+2.85)#3,621 |
| 82. | Buckner | 7.4% | 4.2%(+3.19)#82 | 4.8%(+2.64)#3,828 |
| 83. | Bremen | 7.4% | 4.2%(+3.19)#83 | 4.8%(+2.64)#3,835 |
| 84. | Dayton | 7.3% | 4.2%(+3.12)#84 | 4.8%(+2.57)#3,898 |
| 85. | Alexandria | 7.3% | 4.2%(+3.09)#85 | 4.8%(+2.55)#3,938 |
| 86. | Richlawn | 7.3% | 4.2%(+3.05)#86 | 4.8%(+2.51)#3,978 |
| 87. | Coldstream | 7.3% | 4.2%(+3.05)#87 | 4.8%(+2.50)#3,987 |
| 88. | Fordsville | 7.3% | 4.2%(+3.04)#88 | 4.8%(+2.49)#3,998 |
| 89. | Mount Washington | 7.2% | 4.2%(+3.02)#89 | 4.8%(+2.47)#4,019 |
| 90. | Rolling Hills | 7.2% | 4.2%(+2.95)#90 | 4.8%(+2.40)#4,095 |
| 91. | Independence | 7.2% | 4.2%(+2.93)#91 | 4.8%(+2.39)#4,108 |
| 92. | Norbourne Estates | 7.1% | 4.2%(+2.89)#92 | 4.8%(+2.34)#4,187 |
| 93. | Norwood | 7.1% | 4.2%(+2.89)#93 | 4.8%(+2.34)#4,188 |
| 94. | Shepherdsville | 7.1% | 4.2%(+2.88)#94 | 4.8%(+2.33)#4,196 |
| 95. | Camargo | 7.1% | 4.2%(+2.83)#95 | 4.8%(+2.28)#4,254 |
| 96. | Meadowview Estates | 7.0% | 4.2%(+2.80)#96 | 4.8%(+2.25)#4,303 |
| 97. | Crescent Springs | 7.0% | 4.2%(+2.78)#97 | 4.8%(+2.24)#4,318 |
| 98. | Wellington | 7.0% | 4.2%(+2.76)#98 | 4.8%(+2.21)#4,355 |
| 99. | South Williamson | 7.0% | 4.2%(+2.74)#99 | 4.8%(+2.20)#4,372 |
| 100. | Crossgate | 6.9% | 4.2%(+2.71)#100 | 4.8%(+2.16)#4,417 |
Common Questions
What are the Top 10 Cities with the Highest Percentage of Population Employed in Finance & Insurance in Kentucky?
Top 10 Cities with the Highest Percentage of Population Employed in Finance & Insurance in Kentucky are:
#1
29.5%
#2
29.4%
#3
23.7%
#4
21.8%
#5
20.7%
#6
16.7%
#7
16.5%
#8
16.4%
#9
15.6%
#10
15.0%
What city has the Highest Percentage of Population Employed in Finance & Insurance in Kentucky?
Germantown has the Highest Percentage of Population Employed in Finance & Insurance in Kentucky with 29.5%.
What is the Percentage of Population Employed in Finance & Insurance in the State of Kentucky?
Percentage of Population Employed in Finance & Insurance in Kentucky is 4.2%.
What is the Percentage of Population Employed in Finance & Insurance in the United States?
Percentage of Population Employed in Finance & Insurance in the United States is 4.8%.