Cities with the Highest Percentage of Population Employed in Finance & Insurance in New Mexico
RELATED REPORTS & OPTIONS
Finance & Insurance
New Mexico
Compare Cities
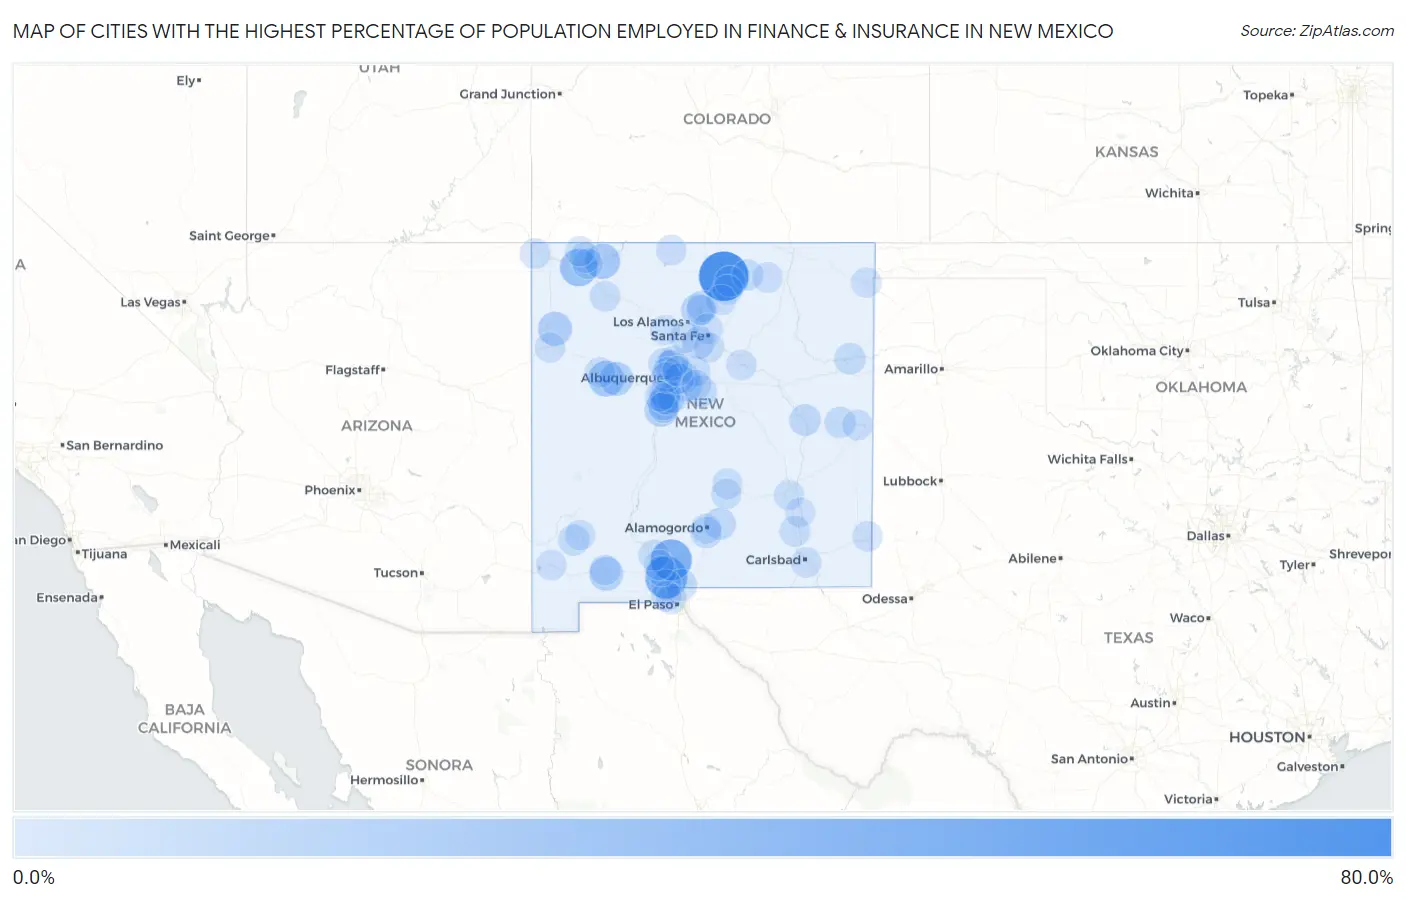
Map of Cities with the Highest Percentage of Population Employed in Finance & Insurance in New Mexico
0.0%
80.0%
Cities with the Highest Percentage of Population Employed in Finance & Insurance in New Mexico
| City | % Employed | vs State | vs National | |
| 1. | Arroyo Hondo | 68.2% | 3.2%(+65.0)#1 | 4.8%(+63.5)#17 |
| 2. | Catalpa Canyon | 46.2% | 3.2%(+43.0)#2 | 4.8%(+41.4)#57 |
| 3. | Mesquite | 42.4% | 3.2%(+39.3)#3 | 4.8%(+37.7)#69 |
| 4. | Organ | 39.3% | 3.2%(+36.1)#4 | 4.8%(+34.5)#86 |
| 5. | La Tierra | 29.4% | 3.2%(+26.2)#5 | 4.8%(+24.6)#164 |
| 6. | Napi Headquarters | 26.9% | 3.2%(+23.7)#6 | 4.8%(+22.1)#191 |
| 7. | Gamerco | 23.6% | 3.2%(+20.4)#7 | 4.8%(+18.9)#245 |
| 8. | Anzac Village | 21.1% | 3.2%(+17.9)#8 | 4.8%(+16.3)#323 |
| 9. | Blanco | 19.7% | 3.2%(+16.5)#9 | 4.8%(+15.0)#382 |
| 10. | Lindrith | 19.6% | 3.2%(+16.4)#10 | 4.8%(+14.9)#389 |
| 11. | Kirtland Afb | 19.6% | 3.2%(+16.4)#11 | 4.8%(+14.8)#390 |
| 12. | Brimhall Nizhoni | 15.5% | 3.2%(+12.3)#12 | 4.8%(+10.7)#645 |
| 13. | La Hacienda | 15.0% | 3.2%(+11.8)#13 | 4.8%(+10.3)#694 |
| 14. | North Acomita Village | 14.3% | 3.2%(+11.1)#14 | 4.8%(+9.52)#776 |
| 15. | Jarales | 13.3% | 3.2%(+10.1)#15 | 4.8%(+8.57)#937 |
| 16. | Little Walnut | 12.8% | 3.2%(+9.59)#16 | 4.8%(+8.01)#1,037 |
| 17. | Adelino | 11.5% | 3.2%(+8.29)#17 | 4.8%(+6.71)#1,371 |
| 18. | Hernandez | 11.1% | 3.2%(+7.92)#18 | 4.8%(+6.34)#1,487 |
| 19. | Ponderosa Pine | 9.6% | 3.2%(+6.37)#19 | 4.8%(+4.79)#2,135 |
| 20. | El Cerro Mission | 9.5% | 3.2%(+6.29)#20 | 4.8%(+4.72)#2,201 |
| 21. | La Cienega | 9.1% | 3.2%(+5.90)#21 | 4.8%(+4.32)#2,428 |
| 22. | Totah Vista | 8.9% | 3.2%(+5.71)#22 | 4.8%(+4.14)#2,549 |
| 23. | Sunlit Hills | 8.3% | 3.2%(+5.14)#23 | 4.8%(+3.57)#2,955 |
| 24. | Cloudcroft | 8.2% | 3.2%(+4.98)#24 | 4.8%(+3.40)#3,088 |
| 25. | Paa-Ko | 7.9% | 3.2%(+4.75)#25 | 4.8%(+3.17)#3,306 |
| 26. | Fort Sumner | 7.9% | 3.2%(+4.66)#26 | 4.8%(+3.08)#3,387 |
| 27. | Rio Rancho Estates | 7.8% | 3.2%(+4.62)#27 | 4.8%(+3.04)#3,423 |
| 28. | Tijeras | 7.7% | 3.2%(+4.50)#28 | 4.8%(+2.92)#3,532 |
| 29. | Chaparral | 7.5% | 3.2%(+4.29)#29 | 4.8%(+2.72)#3,747 |
| 30. | Santa Fe Foothills | 7.4% | 3.2%(+4.22)#30 | 4.8%(+2.64)#3,831 |
| 31. | Logan | 7.0% | 3.2%(+3.85)#31 | 4.8%(+2.27)#4,268 |
| 32. | Mcintosh | 7.0% | 3.2%(+3.83)#32 | 4.8%(+2.25)#4,299 |
| 33. | Boles Acres | 6.9% | 3.2%(+3.69)#33 | 4.8%(+2.11)#4,494 |
| 34. | Bosque Farms | 6.8% | 3.2%(+3.60)#34 | 4.8%(+2.02)#4,610 |
| 35. | Picacho Hills | 6.5% | 3.2%(+3.29)#35 | 4.8%(+1.71)#5,046 |
| 36. | La Villita | 6.3% | 3.2%(+3.14)#36 | 4.8%(+1.57)#5,256 |
| 37. | Tyrone | 6.2% | 3.2%(+3.04)#37 | 4.8%(+1.46)#5,428 |
| 38. | Melrose | 6.2% | 3.2%(+2.97)#38 | 4.8%(+1.40)#5,523 |
| 39. | Corrales | 6.0% | 3.2%(+2.80)#39 | 4.8%(+1.23)#5,806 |
| 40. | Conejo | 5.8% | 3.2%(+2.60)#40 | 4.8%(+1.02)#6,163 |
| 41. | Eagle Nest | 5.6% | 3.2%(+2.44)#41 | 4.8%(+0.866)#6,462 |
| 42. | Las Campanas | 5.5% | 3.2%(+2.26)#42 | 4.8%(+0.687)#6,816 |
| 43. | Thunder Mountain | 5.4% | 3.2%(+2.21)#43 | 4.8%(+0.638)#6,899 |
| 44. | Cedar Grove | 5.3% | 3.2%(+2.13)#44 | 4.8%(+0.556)#7,069 |
| 45. | Artesia | 5.3% | 3.2%(+2.13)#45 | 4.8%(+0.550)#7,078 |
| 46. | Pueblo Of Sandia Village | 5.3% | 3.2%(+2.10)#46 | 4.8%(+0.524)#7,135 |
| 47. | Rio Rancho | 5.2% | 3.2%(+1.98)#47 | 4.8%(+0.404)#7,386 |
| 48. | Bernalillo | 5.1% | 3.2%(+1.89)#48 | 4.8%(+0.315)#7,606 |
| 49. | Cochiti Lake | 4.9% | 3.2%(+1.69)#49 | 4.8%(+0.111)#8,052 |
| 50. | Meadow Lake | 4.8% | 3.2%(+1.57)#50 | 4.8%(-0.009)#8,354 |
| 51. | Flora Vista | 4.6% | 3.2%(+1.41)#51 | 4.8%(-0.164)#8,685 |
| 52. | Radium Springs | 4.5% | 3.2%(+1.30)#52 | 4.8%(-0.279)#8,982 |
| 53. | Cannon Afb | 4.5% | 3.2%(+1.27)#53 | 4.8%(-0.303)#9,061 |
| 54. | Nageezi | 4.4% | 3.2%(+1.23)#54 | 4.8%(-0.343)#9,172 |
| 55. | El Cerro | 4.4% | 3.2%(+1.18)#55 | 4.8%(-0.400)#9,306 |
| 56. | Carnuel | 4.4% | 3.2%(+1.18)#56 | 4.8%(-0.401)#9,308 |
| 57. | Beclabito | 4.3% | 3.2%(+1.16)#57 | 4.8%(-0.420)#9,361 |
| 58. | Tres Arroyos | 4.3% | 3.2%(+1.15)#58 | 4.8%(-0.429)#9,391 |
| 59. | Chamberino | 4.3% | 3.2%(+1.11)#59 | 4.8%(-0.463)#9,473 |
| 60. | Los Ranchos De Albuquerque | 4.3% | 3.2%(+1.08)#60 | 4.8%(-0.495)#9,561 |
| 61. | Rio Communities | 4.2% | 3.2%(+0.971)#61 | 4.8%(-0.606)#9,872 |
| 62. | Sunland Park | 4.1% | 3.2%(+0.953)#62 | 4.8%(-0.624)#9,916 |
| 63. | Albuquerque | 4.1% | 3.2%(+0.936)#63 | 4.8%(-0.641)#9,986 |
| 64. | Taos Pueblo | 4.1% | 3.2%(+0.914)#64 | 4.8%(-0.663)#10,032 |
| 65. | Los Lunas | 4.1% | 3.2%(+0.872)#65 | 4.8%(-0.705)#10,148 |
| 66. | Peak Place | 4.0% | 3.2%(+0.830)#66 | 4.8%(-0.747)#10,277 |
| 67. | Villanueva | 4.0% | 3.2%(+0.810)#67 | 4.8%(-0.767)#10,325 |
| 68. | Deming | 3.9% | 3.2%(+0.712)#68 | 4.8%(-0.865)#10,625 |
| 69. | Lee Acres | 3.8% | 3.2%(+0.659)#69 | 4.8%(-0.918)#10,784 |
| 70. | Cimarron | 3.8% | 3.2%(+0.631)#70 | 4.8%(-0.946)#10,879 |
| 71. | Chama | 3.8% | 3.2%(+0.577)#71 | 4.8%(-1.00)#11,049 |
| 72. | Grants | 3.8% | 3.2%(+0.566)#72 | 4.8%(-1.01)#11,083 |
| 73. | Lordsburg | 3.7% | 3.2%(+0.545)#73 | 4.8%(-1.03)#11,143 |
| 74. | Indian Hills | 3.7% | 3.2%(+0.471)#74 | 4.8%(-1.11)#11,361 |
| 75. | Eldorado At Santa Fe | 3.6% | 3.2%(+0.434)#75 | 4.8%(-1.14)#11,460 |
| 76. | Arenas Valley | 3.6% | 3.2%(+0.421)#76 | 4.8%(-1.16)#11,503 |
| 77. | North Hobbs | 3.5% | 3.2%(+0.335)#77 | 4.8%(-1.24)#11,759 |
| 78. | Capitan | 3.5% | 3.2%(+0.335)#78 | 4.8%(-1.24)#11,767 |
| 79. | Pena Blanca | 3.5% | 3.2%(+0.295)#79 | 4.8%(-1.28)#11,889 |
| 80. | Tano Road | 3.4% | 3.2%(+0.250)#80 | 4.8%(-1.33)#12,032 |
| 81. | Santa Teresa | 3.4% | 3.2%(+0.233)#81 | 4.8%(-1.34)#12,085 |
| 82. | Ruidoso | 3.4% | 3.2%(+0.211)#82 | 4.8%(-1.37)#12,158 |
| 83. | South River | 3.4% | 3.2%(+0.177)#83 | 4.8%(-1.40)#12,264 |
| 84. | Gallup | 3.4% | 3.2%(+0.163)#84 | 4.8%(-1.41)#12,304 |
| 85. | Sandia Heights | 3.3% | 3.2%(+0.157)#85 | 4.8%(-1.42)#12,320 |
| 86. | Carlsbad | 3.3% | 3.2%(+0.140)#86 | 4.8%(-1.44)#12,385 |
| 87. | Roswell | 3.3% | 3.2%(+0.120)#87 | 4.8%(-1.46)#12,446 |
| 88. | Rio Lucio | 3.3% | 3.2%(+0.111)#88 | 4.8%(-1.47)#12,477 |
| 89. | Clayton | 3.2% | 3.2%(+0.047)#89 | 4.8%(-1.53)#12,698 |
| 90. | San Pablo | 3.2% | 3.2%(+0.006)#90 | 4.8%(-1.57)#12,842 |
| 91. | Talpa | 3.1% | 3.2%(-0.094)#91 | 4.8%(-1.67)#13,182 |
| 92. | Hyde Park | 3.0% | 3.2%(-0.186)#92 | 4.8%(-1.76)#13,461 |
| 93. | Iyanbito | 3.0% | 3.2%(-0.201)#93 | 4.8%(-1.78)#13,515 |
| 94. | La Plata | 3.0% | 3.2%(-0.227)#94 | 4.8%(-1.80)#13,595 |
| 95. | Jemez Springs | 2.9% | 3.2%(-0.249)#95 | 4.8%(-1.83)#13,677 |
| 96. | Ohkay Owingeh | 2.9% | 3.2%(-0.266)#96 | 4.8%(-1.84)#13,738 |
| 97. | Alamogordo | 2.8% | 3.2%(-0.427)#97 | 4.8%(-2.00)#14,237 |
| 98. | Hagerman | 2.7% | 3.2%(-0.463)#98 | 4.8%(-2.04)#14,373 |
| 99. | Las Cruces | 2.7% | 3.2%(-0.519)#99 | 4.8%(-2.10)#14,553 |
| 100. | Espanola | 2.7% | 3.2%(-0.529)#100 | 4.8%(-2.11)#14,584 |
Common Questions
What are the Top 10 Cities with the Highest Percentage of Population Employed in Finance & Insurance in New Mexico?
Top 10 Cities with the Highest Percentage of Population Employed in Finance & Insurance in New Mexico are:
#1
68.2%
#2
42.4%
#3
39.3%
#4
26.9%
#5
21.1%
#6
19.7%
#7
15.5%
#8
15.0%
#9
14.3%
#10
13.3%
What city has the Highest Percentage of Population Employed in Finance & Insurance in New Mexico?
Arroyo Hondo has the Highest Percentage of Population Employed in Finance & Insurance in New Mexico with 68.2%.
What is the Percentage of Population Employed in Finance & Insurance in the State of New Mexico?
Percentage of Population Employed in Finance & Insurance in New Mexico is 3.2%.
What is the Percentage of Population Employed in Finance & Insurance in the United States?
Percentage of Population Employed in Finance & Insurance in the United States is 4.8%.