Cities with the Highest Percentage of Population Employed in Finance & Insurance in Nevada
RELATED REPORTS & OPTIONS
Finance & Insurance
Nevada
Compare Cities
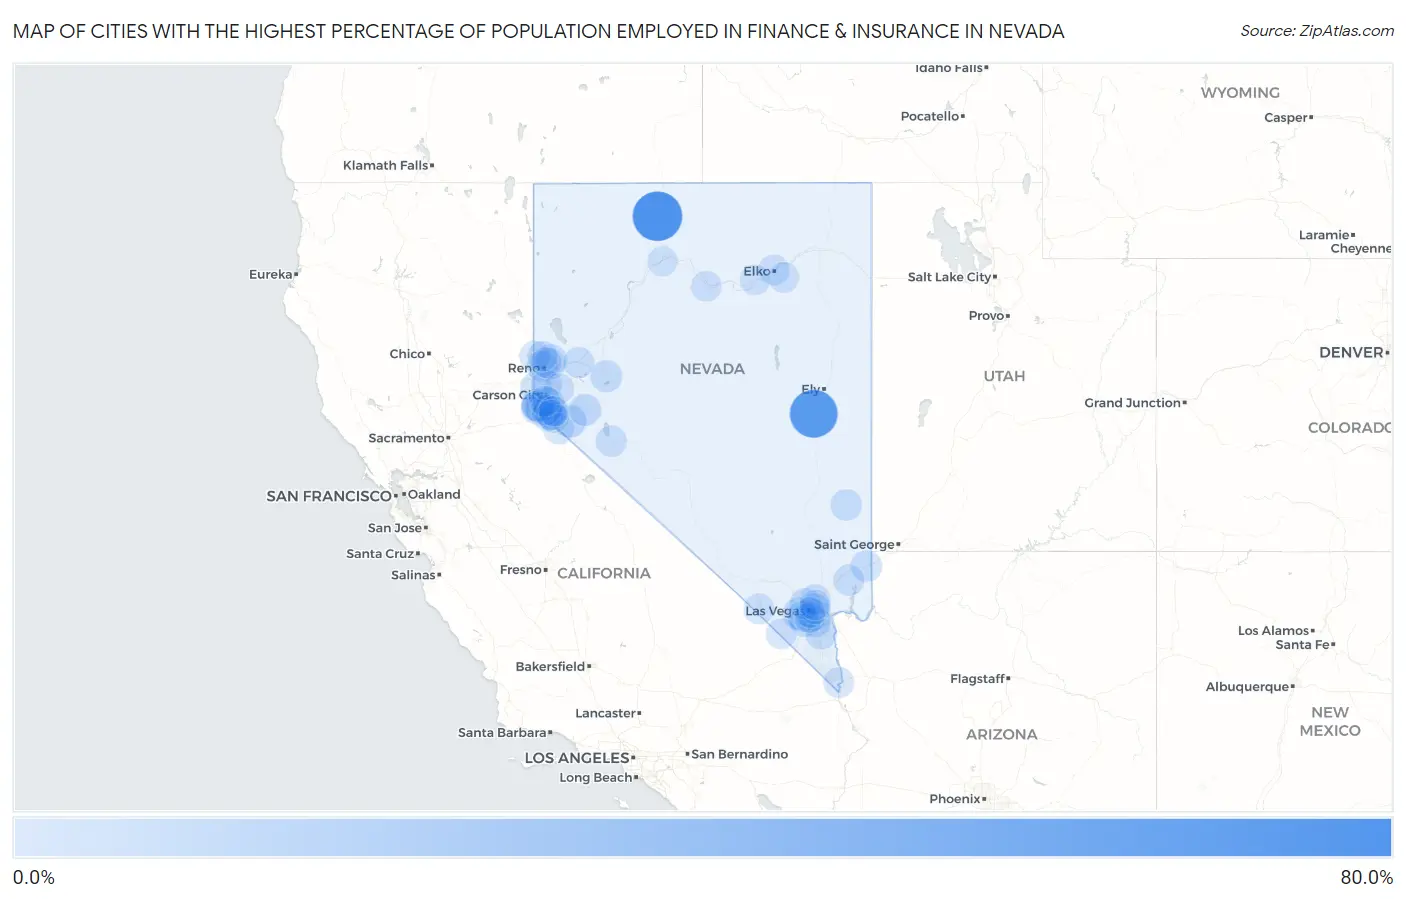
Map of Cities with the Highest Percentage of Population Employed in Finance & Insurance in Nevada
0.0%
80.0%
Cities with the Highest Percentage of Population Employed in Finance & Insurance in Nevada
| City | % Employed | vs State | vs National | |
| 1. | Orovada | 66.7% | 3.3%(+63.3)#1 | 4.8%(+61.9)#19 |
| 2. | Preston | 60.5% | 3.3%(+57.2)#2 | 4.8%(+55.8)#24 |
| 3. | East Valley | 12.2% | 3.3%(+8.89)#3 | 4.8%(+7.45)#1,170 |
| 4. | Round Hill Village | 10.1% | 3.3%(+6.75)#4 | 4.8%(+5.30)#1,882 |
| 5. | Smith Valley | 8.3% | 3.3%(+4.94)#5 | 4.8%(+3.49)#3,018 |
| 6. | Skyland | 6.7% | 3.3%(+3.40)#6 | 4.8%(+1.96)#4,700 |
| 7. | Summerlin South | 6.4% | 3.3%(+3.10)#7 | 4.8%(+1.65)#5,146 |
| 8. | Johnson Lane | 6.3% | 3.3%(+2.95)#8 | 4.8%(+1.50)#5,346 |
| 9. | Yerington | 6.0% | 3.3%(+2.72)#9 | 4.8%(+1.27)#5,731 |
| 10. | Fallon Station | 5.2% | 3.3%(+1.90)#10 | 4.8%(+0.450)#7,286 |
| 11. | Incline Village | 4.6% | 3.3%(+1.31)#11 | 4.8%(-0.138)#8,632 |
| 12. | Gardnerville Ranchos | 4.6% | 3.3%(+1.27)#12 | 4.8%(-0.172)#8,708 |
| 13. | Spanish Springs | 4.4% | 3.3%(+1.11)#13 | 4.8%(-0.333)#9,148 |
| 14. | Henderson | 4.3% | 3.3%(+0.981)#14 | 4.8%(-0.467)#9,481 |
| 15. | Whitney | 4.3% | 3.3%(+0.942)#15 | 4.8%(-0.505)#9,587 |
| 16. | Mesquite | 4.2% | 3.3%(+0.884)#16 | 4.8%(-0.563)#9,744 |
| 17. | Enterprise | 3.8% | 3.3%(+0.458)#17 | 4.8%(-0.990)#11,018 |
| 18. | Caliente | 3.8% | 3.3%(+0.437)#18 | 4.8%(-1.01)#11,078 |
| 19. | Las Vegas | 3.7% | 3.3%(+0.429)#19 | 4.8%(-1.02)#11,107 |
| 20. | Spring Valley | 3.6% | 3.3%(+0.255)#20 | 4.8%(-1.19)#11,611 |
| 21. | Boulder City | 3.6% | 3.3%(+0.253)#21 | 4.8%(-1.19)#11,616 |
| 22. | Zephyr Cove | 3.3% | 3.3%(-0.068)#22 | 4.8%(-1.52)#12,651 |
| 23. | Hawthorne | 3.2% | 3.3%(-0.097)#23 | 4.8%(-1.54)#12,765 |
| 24. | Reno | 3.2% | 3.3%(-0.163)#24 | 4.8%(-1.61)#12,954 |
| 25. | Gardnerville | 3.1% | 3.3%(-0.202)#25 | 4.8%(-1.65)#13,106 |
| 26. | Sparks | 3.1% | 3.3%(-0.210)#26 | 4.8%(-1.66)#13,129 |
| 27. | Carson | 3.1% | 3.3%(-0.255)#27 | 4.8%(-1.70)#13,277 |
| 28. | Amargosa Valley | 3.0% | 3.3%(-0.271)#28 | 4.8%(-1.72)#13,323 |
| 29. | Moapa Valley | 3.0% | 3.3%(-0.277)#29 | 4.8%(-1.72)#13,343 |
| 30. | Topaz Lake | 2.9% | 3.3%(-0.463)#30 | 4.8%(-1.91)#13,932 |
| 31. | North Las Vegas | 2.9% | 3.3%(-0.465)#31 | 4.8%(-1.91)#13,942 |
| 32. | Paradise | 2.8% | 3.3%(-0.528)#32 | 4.8%(-1.98)#14,147 |
| 33. | Cold Springs | 2.5% | 3.3%(-0.819)#33 | 4.8%(-2.27)#15,144 |
| 34. | Kingsbury | 2.4% | 3.3%(-0.888)#34 | 4.8%(-2.34)#15,382 |
| 35. | Carter Springs | 2.3% | 3.3%(-1.02)#35 | 4.8%(-2.46)#15,835 |
| 36. | Washoe Valley | 2.1% | 3.3%(-1.18)#36 | 4.8%(-2.62)#16,388 |
| 37. | Sun Valley | 2.1% | 3.3%(-1.18)#37 | 4.8%(-2.62)#16,396 |
| 38. | Fernley | 2.1% | 3.3%(-1.19)#38 | 4.8%(-2.64)#16,432 |
| 39. | Sunrise Manor | 2.1% | 3.3%(-1.20)#39 | 4.8%(-2.64)#16,451 |
| 40. | Dayton | 2.1% | 3.3%(-1.20)#40 | 4.8%(-2.65)#16,461 |
| 41. | Winchester | 2.0% | 3.3%(-1.28)#41 | 4.8%(-2.73)#16,778 |
| 42. | Minden | 2.0% | 3.3%(-1.36)#42 | 4.8%(-2.81)#17,029 |
| 43. | Sandy Valley | 1.8% | 3.3%(-1.56)#43 | 4.8%(-3.01)#17,723 |
| 44. | Pahrump | 1.7% | 3.3%(-1.64)#44 | 4.8%(-3.08)#17,978 |
| 45. | Elko | 1.7% | 3.3%(-1.65)#45 | 4.8%(-3.09)#18,028 |
| 46. | Indian Hills | 1.6% | 3.3%(-1.69)#46 | 4.8%(-3.14)#18,164 |
| 47. | Laughlin | 1.6% | 3.3%(-1.73)#47 | 4.8%(-3.18)#18,297 |
| 48. | Nellis Afb | 1.6% | 3.3%(-1.74)#48 | 4.8%(-3.18)#18,323 |
| 49. | Lemmon Valley | 1.6% | 3.3%(-1.74)#49 | 4.8%(-3.19)#18,333 |
| 50. | Ruhenstroth | 1.5% | 3.3%(-1.77)#50 | 4.8%(-3.22)#18,436 |
| 51. | Spring Creek | 1.5% | 3.3%(-1.85)#51 | 4.8%(-3.29)#18,700 |
| 52. | Battle Mountain | 1.1% | 3.3%(-2.17)#52 | 4.8%(-3.62)#19,730 |
| 53. | Carlin | 0.93% | 3.3%(-2.39)#53 | 4.8%(-3.84)#20,350 |
| 54. | Winnemucca | 0.71% | 3.3%(-2.61)#54 | 4.8%(-4.06)#20,914 |
| 55. | Fish Springs | 0.47% | 3.3%(-2.85)#55 | 4.8%(-4.30)#21,434 |
1
2Common Questions
What are the Top 10 Cities with the Highest Percentage of Population Employed in Finance & Insurance in Nevada?
Top 10 Cities with the Highest Percentage of Population Employed in Finance & Insurance in Nevada are:
#1
66.7%
#2
60.5%
#3
12.2%
#4
10.1%
#5
8.3%
#6
6.7%
#7
6.4%
#8
6.3%
#9
6.0%
#10
5.2%
What city has the Highest Percentage of Population Employed in Finance & Insurance in Nevada?
Orovada has the Highest Percentage of Population Employed in Finance & Insurance in Nevada with 66.7%.
What is the Percentage of Population Employed in Finance & Insurance in the State of Nevada?
Percentage of Population Employed in Finance & Insurance in Nevada is 3.3%.
What is the Percentage of Population Employed in Finance & Insurance in the United States?
Percentage of Population Employed in Finance & Insurance in the United States is 4.8%.