Cities with the Highest Percentage of Population Employed in Finance & Insurance in New Hampshire
RELATED REPORTS & OPTIONS
Finance & Insurance
New Hampshire
Compare Cities
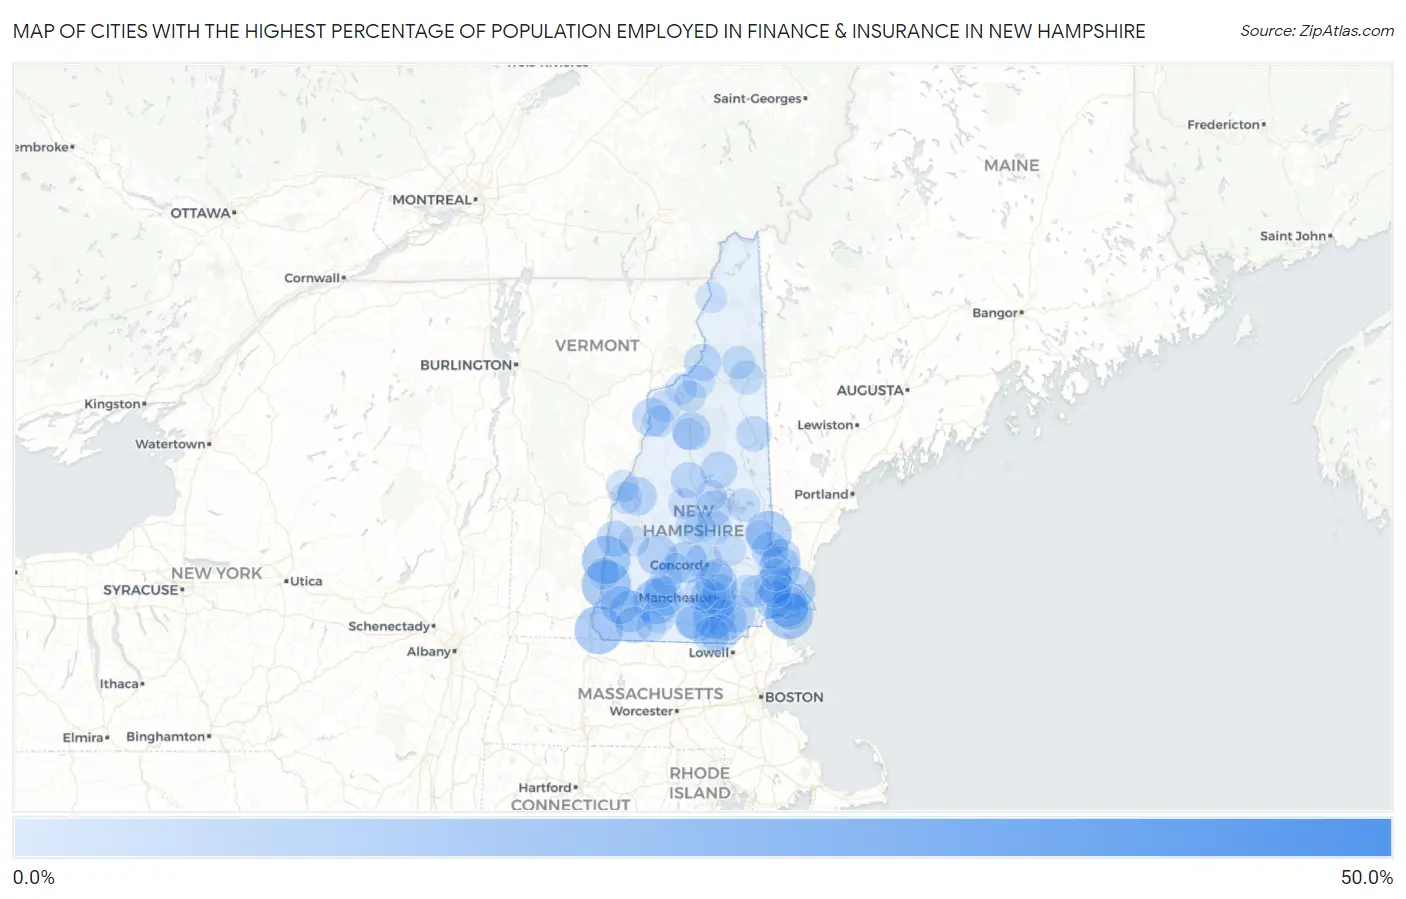
Map of Cities with the Highest Percentage of Population Employed in Finance & Insurance in New Hampshire
0.0%
50.0%
Cities with the Highest Percentage of Population Employed in Finance & Insurance in New Hampshire
| City | % Employed | vs State | vs National | |
| 1. | New Boston | 42.0% | 4.8%(+37.1)#1 | 4.8%(+37.2)#71 |
| 2. | Walpole | 13.2% | 4.8%(+8.41)#2 | 4.8%(+8.46)#956 |
| 3. | Charlestown | 12.6% | 4.8%(+7.77)#3 | 4.8%(+7.82)#1,078 |
| 4. | Hinsdale | 12.6% | 4.8%(+7.74)#4 | 4.8%(+7.80)#1,083 |
| 5. | Seabrook Beach | 12.6% | 4.8%(+7.74)#5 | 4.8%(+7.79)#1,084 |
| 6. | Milton | 10.9% | 4.8%(+6.10)#6 | 4.8%(+6.15)#1,559 |
| 7. | Hancock | 10.8% | 4.8%(+5.96)#7 | 4.8%(+6.02)#1,604 |
| 8. | Amherst | 9.6% | 4.8%(+4.79)#8 | 4.8%(+4.84)#2,104 |
| 9. | Portsmouth | 9.3% | 4.8%(+4.48)#9 | 4.8%(+4.53)#2,302 |
| 10. | East Merrimack | 8.7% | 4.8%(+3.88)#10 | 4.8%(+3.93)#2,681 |
| 11. | Contoocook | 8.1% | 4.8%(+3.32)#11 | 4.8%(+3.37)#3,126 |
| 12. | Dover | 8.1% | 4.8%(+3.30)#12 | 4.8%(+3.35)#3,145 |
| 13. | Hampton | 7.9% | 4.8%(+3.09)#13 | 4.8%(+3.14)#3,330 |
| 14. | Marlborough | 7.9% | 4.8%(+3.05)#14 | 4.8%(+3.10)#3,370 |
| 15. | Hooksett | 7.6% | 4.8%(+2.80)#15 | 4.8%(+2.85)#3,617 |
| 16. | Londonderry | 7.2% | 4.8%(+2.43)#16 | 4.8%(+2.48)#4,010 |
| 17. | Bradford | 6.8% | 4.8%(+1.99)#17 | 4.8%(+2.04)#4,591 |
| 18. | Bennington | 6.6% | 4.8%(+1.74)#18 | 4.8%(+1.79)#4,935 |
| 19. | Lincoln | 5.7% | 4.8%(+0.927)#19 | 4.8%(+0.980)#6,235 |
| 20. | Keene | 5.7% | 4.8%(+0.900)#20 | 4.8%(+0.953)#6,275 |
| 21. | Exeter | 5.7% | 4.8%(+0.875)#21 | 4.8%(+0.927)#6,324 |
| 22. | Woodsville | 5.6% | 4.8%(+0.825)#22 | 4.8%(+0.878)#6,430 |
| 23. | Derry | 5.6% | 4.8%(+0.821)#23 | 4.8%(+0.873)#6,439 |
| 24. | Enfield | 5.6% | 4.8%(+0.810)#24 | 4.8%(+0.862)#6,478 |
| 25. | Newmarket | 5.5% | 4.8%(+0.728)#25 | 4.8%(+0.781)#6,638 |
| 26. | Somersworth | 5.5% | 4.8%(+0.690)#26 | 4.8%(+0.743)#6,710 |
| 27. | Manchester | 5.3% | 4.8%(+0.450)#27 | 4.8%(+0.503)#7,175 |
| 28. | Hudson | 5.2% | 4.8%(+0.379)#28 | 4.8%(+0.432)#7,323 |
| 29. | Hampton Beach | 5.2% | 4.8%(+0.334)#29 | 4.8%(+0.387)#7,428 |
| 30. | Rochester | 5.0% | 4.8%(+0.141)#30 | 4.8%(+0.194)#7,857 |
| 31. | Lancaster | 4.9% | 4.8%(+0.067)#31 | 4.8%(+0.119)#8,026 |
| 32. | Klondike Corner | 4.8% | 4.8%(+0.015)#32 | 4.8%(+0.068)#8,156 |
| 33. | Troy | 4.6% | 4.8%(-0.231)#33 | 4.8%(-0.178)#8,724 |
| 34. | Concord | 4.6% | 4.8%(-0.245)#34 | 4.8%(-0.192)#8,750 |
| 35. | Center Sandwich | 4.5% | 4.8%(-0.274)#35 | 4.8%(-0.222)#8,836 |
| 36. | Laconia | 4.4% | 4.8%(-0.418)#36 | 4.8%(-0.365)#9,220 |
| 37. | Nashua | 4.3% | 4.8%(-0.529)#37 | 4.8%(-0.477)#9,503 |
| 38. | Claremont | 4.2% | 4.8%(-0.637)#38 | 4.8%(-0.584)#9,794 |
| 39. | Plymouth | 4.1% | 4.8%(-0.765)#39 | 4.8%(-0.712)#10,157 |
| 40. | Pinardville | 3.9% | 4.8%(-0.882)#40 | 4.8%(-0.829)#10,529 |
| 41. | South Hooksett | 3.7% | 4.8%(-1.14)#41 | 4.8%(-1.09)#11,315 |
| 42. | North Conway | 3.6% | 4.8%(-1.17)#42 | 4.8%(-1.12)#11,402 |
| 43. | Francestown | 3.6% | 4.8%(-1.18)#43 | 4.8%(-1.13)#11,436 |
| 44. | Belmont | 3.2% | 4.8%(-1.59)#44 | 4.8%(-1.54)#12,731 |
| 45. | Peterborough | 2.6% | 4.8%(-2.24)#45 | 4.8%(-2.19)#14,873 |
| 46. | Gorham | 2.5% | 4.8%(-2.28)#46 | 4.8%(-2.22)#15,000 |
| 47. | Antrim | 2.4% | 4.8%(-2.41)#47 | 4.8%(-2.36)#15,459 |
| 48. | Berlin | 2.3% | 4.8%(-2.51)#48 | 4.8%(-2.46)#15,810 |
| 49. | Goffstown | 2.3% | 4.8%(-2.51)#49 | 4.8%(-2.46)#15,830 |
| 50. | Raymond | 2.3% | 4.8%(-2.55)#50 | 4.8%(-2.50)#15,957 |
| 51. | Wolfeboro | 2.2% | 4.8%(-2.62)#51 | 4.8%(-2.57)#16,221 |
| 52. | Milford | 2.1% | 4.8%(-2.67)#52 | 4.8%(-2.62)#16,376 |
| 53. | Whitefield | 2.0% | 4.8%(-2.87)#53 | 4.8%(-2.81)#17,031 |
| 54. | Franklin | 1.9% | 4.8%(-2.89)#54 | 4.8%(-2.84)#17,111 |
| 55. | Suncook | 1.9% | 4.8%(-2.92)#55 | 4.8%(-2.87)#17,219 |
| 56. | Hanover | 1.9% | 4.8%(-2.92)#56 | 4.8%(-2.87)#17,221 |
| 57. | Epping | 1.8% | 4.8%(-2.98)#57 | 4.8%(-2.92)#17,412 |
| 58. | Lebanon | 1.8% | 4.8%(-3.03)#58 | 4.8%(-2.98)#17,605 |
| 59. | Newfields | 1.8% | 4.8%(-3.07)#59 | 4.8%(-3.01)#17,745 |
| 60. | Lisbon | 1.7% | 4.8%(-3.11)#60 | 4.8%(-3.06)#17,899 |
| 61. | Hillsborough | 1.7% | 4.8%(-3.15)#61 | 4.8%(-3.10)#18,034 |
| 62. | Durham | 1.7% | 4.8%(-3.17)#62 | 4.8%(-3.12)#18,085 |
| 63. | North Walpole | 1.6% | 4.8%(-3.18)#63 | 4.8%(-3.12)#18,100 |
| 64. | Pittsfield | 1.6% | 4.8%(-3.21)#64 | 4.8%(-3.15)#18,204 |
| 65. | Littleton | 1.5% | 4.8%(-3.30)#65 | 4.8%(-3.25)#18,531 |
| 66. | North Woodstock | 1.4% | 4.8%(-3.40)#66 | 4.8%(-3.35)#18,874 |
| 67. | Mountain Lakes | 1.4% | 4.8%(-3.47)#67 | 4.8%(-3.42)#19,087 |
| 68. | Tilton Northfield | 1.3% | 4.8%(-3.50)#68 | 4.8%(-3.45)#19,193 |
| 69. | Bethlehem | 1.2% | 4.8%(-3.63)#69 | 4.8%(-3.57)#19,585 |
| 70. | Henniker | 1.1% | 4.8%(-3.74)#70 | 4.8%(-3.68)#19,925 |
| 71. | Bristol | 1.1% | 4.8%(-3.75)#71 | 4.8%(-3.70)#19,951 |
| 72. | Colebrook | 1.0% | 4.8%(-3.80)#72 | 4.8%(-3.75)#20,096 |
| 73. | Jaffrey | 0.78% | 4.8%(-4.04)#73 | 4.8%(-3.99)#20,739 |
| 74. | Meredith | 0.77% | 4.8%(-4.05)#74 | 4.8%(-4.00)#20,763 |
| 75. | Newport | 0.54% | 4.8%(-4.28)#75 | 4.8%(-4.23)#21,312 |
| 76. | Farmington | 0.100% | 4.8%(-4.72)#76 | 4.8%(-4.67)#21,803 |
1
Common Questions
What are the Top 10 Cities with the Highest Percentage of Population Employed in Finance & Insurance in New Hampshire?
Top 10 Cities with the Highest Percentage of Population Employed in Finance & Insurance in New Hampshire are:
#1
13.2%
#2
12.6%
#3
12.6%
#4
12.6%
#5
10.9%
#6
10.8%
#7
9.6%
#8
9.3%
#9
8.7%
#10
8.1%
What city has the Highest Percentage of Population Employed in Finance & Insurance in New Hampshire?
Walpole has the Highest Percentage of Population Employed in Finance & Insurance in New Hampshire with 13.2%.
What is the Percentage of Population Employed in Finance & Insurance in the State of New Hampshire?
Percentage of Population Employed in Finance & Insurance in New Hampshire is 4.8%.
What is the Percentage of Population Employed in Finance & Insurance in the United States?
Percentage of Population Employed in Finance & Insurance in the United States is 4.8%.