Cities with the Highest Percentage of Population Employed in Finance & Insurance in North Carolina
RELATED REPORTS & OPTIONS
Finance & Insurance
North Carolina
Compare Cities
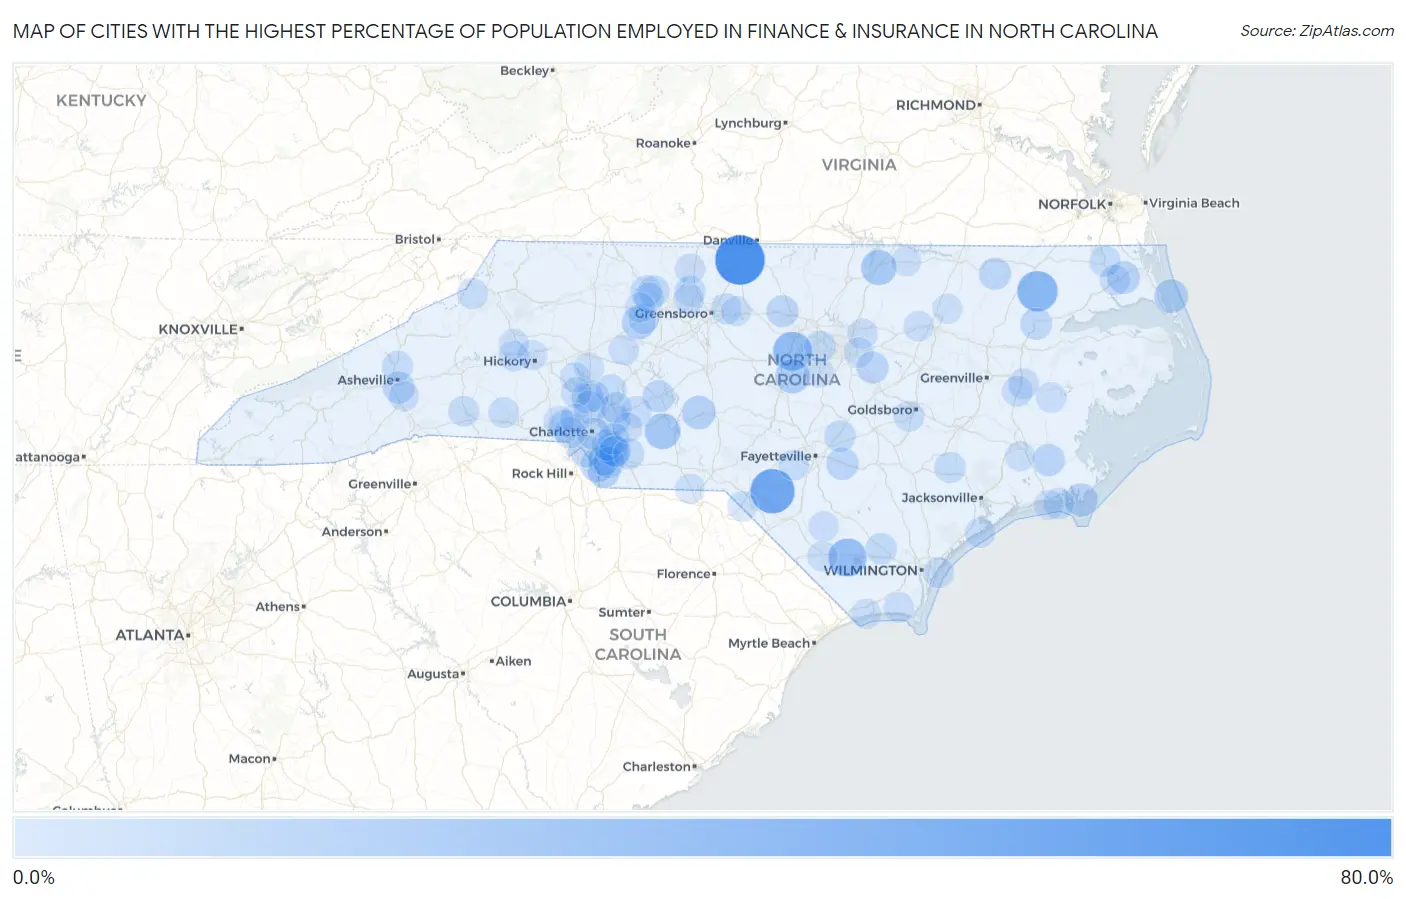
Map of Cities with the Highest Percentage of Population Employed in Finance & Insurance in North Carolina
0.0%
80.0%
Cities with the Highest Percentage of Population Employed in Finance & Insurance in North Carolina
| City | % Employed | vs State | vs National | |
| 1. | Ruffin | 61.2% | 5.1%(+56.1)#1 | 4.8%(+56.4)#23 |
| 2. | Wakulla | 45.9% | 5.1%(+40.8)#2 | 4.8%(+41.1)#60 |
| 3. | Powellsville | 35.0% | 5.1%(+29.9)#3 | 4.8%(+30.2)#106 |
| 4. | Fearrington Village | 30.8% | 5.1%(+25.7)#4 | 4.8%(+26.0)#145 |
| 5. | Hallsboro | 28.6% | 5.1%(+23.5)#5 | 4.8%(+23.8)#172 |
| 6. | Aquadale | 22.0% | 5.1%(+16.9)#6 | 4.8%(+17.2)#291 |
| 7. | Middleburg | 20.5% | 5.1%(+15.5)#7 | 4.8%(+15.8)#341 |
| 8. | Moncure | 18.6% | 5.1%(+13.5)#8 | 4.8%(+13.8)#432 |
| 9. | Marvin | 17.2% | 5.1%(+12.1)#9 | 4.8%(+12.4)#510 |
| 10. | Duck | 16.9% | 5.1%(+11.8)#10 | 4.8%(+12.1)#522 |
| 11. | Bermuda Run | 16.3% | 5.1%(+11.2)#11 | 4.8%(+11.5)#567 |
| 12. | Troy | 16.0% | 5.1%(+10.9)#12 | 4.8%(+11.2)#599 |
| 13. | Gloucester | 15.1% | 5.1%(+10.0)#13 | 4.8%(+10.3)#689 |
| 14. | Dudley | 14.7% | 5.1%(+9.64)#14 | 4.8%(+9.94)#731 |
| 15. | Grandfather | 14.3% | 5.1%(+9.22)#15 | 4.8%(+9.52)#792 |
| 16. | Waxhaw | 14.2% | 5.1%(+9.10)#16 | 4.8%(+9.40)#811 |
| 17. | Governors Club | 14.0% | 5.1%(+8.95)#17 | 4.8%(+9.25)#838 |
| 18. | Camden | 13.7% | 5.1%(+8.67)#18 | 4.8%(+8.98)#868 |
| 19. | Harrisburg | 13.6% | 5.1%(+8.50)#19 | 4.8%(+8.80)#894 |
| 20. | Huntersville | 13.2% | 5.1%(+8.18)#20 | 4.8%(+8.48)#953 |
| 21. | Autryville | 13.0% | 5.1%(+7.97)#21 | 4.8%(+8.28)#989 |
| 22. | Mcadenville | 12.9% | 5.1%(+7.86)#22 | 4.8%(+8.17)#1,004 |
| 23. | Arapahoe | 12.8% | 5.1%(+7.71)#23 | 4.8%(+8.01)#1,038 |
| 24. | Richfield | 12.5% | 5.1%(+7.43)#24 | 4.8%(+7.73)#1,090 |
| 25. | Efland | 12.1% | 5.1%(+7.08)#25 | 4.8%(+7.38)#1,187 |
| 26. | Lasker | 12.0% | 5.1%(+6.93)#26 | 4.8%(+7.23)#1,235 |
| 27. | Archer Lodge | 12.0% | 5.1%(+6.92)#27 | 4.8%(+7.23)#1,238 |
| 28. | Biltmore Forest | 12.0% | 5.1%(+6.90)#28 | 4.8%(+7.20)#1,243 |
| 29. | Pineville | 12.0% | 5.1%(+6.89)#29 | 4.8%(+7.19)#1,244 |
| 30. | Charlotte | 11.8% | 5.1%(+6.73)#30 | 4.8%(+7.03)#1,287 |
| 31. | Stallings | 11.6% | 5.1%(+6.54)#31 | 4.8%(+6.84)#1,337 |
| 32. | Windsor | 11.4% | 5.1%(+6.30)#32 | 4.8%(+6.60)#1,410 |
| 33. | Indian Trail | 11.1% | 5.1%(+6.06)#33 | 4.8%(+6.36)#1,481 |
| 34. | Cornelius | 11.1% | 5.1%(+6.01)#34 | 4.8%(+6.31)#1,505 |
| 35. | Tobaccoville | 10.8% | 5.1%(+5.71)#35 | 4.8%(+6.01)#1,608 |
| 36. | Falcon | 10.7% | 5.1%(+5.65)#36 | 4.8%(+5.95)#1,631 |
| 37. | Rural Hall | 10.6% | 5.1%(+5.53)#37 | 4.8%(+5.84)#1,665 |
| 38. | Weddington | 10.3% | 5.1%(+5.28)#38 | 4.8%(+5.58)#1,755 |
| 39. | Sandyfield | 10.3% | 5.1%(+5.20)#39 | 4.8%(+5.51)#1,788 |
| 40. | Morrisville | 10.2% | 5.1%(+5.14)#40 | 4.8%(+5.44)#1,813 |
| 41. | Wesley Chapel | 10.1% | 5.1%(+5.08)#41 | 4.8%(+5.38)#1,845 |
| 42. | Matthews | 10.1% | 5.1%(+5.00)#42 | 4.8%(+5.31)#1,880 |
| 43. | Mint Hill | 10.0% | 5.1%(+4.97)#43 | 4.8%(+5.28)#1,893 |
| 44. | Potters Hill | 10.0% | 5.1%(+4.93)#44 | 4.8%(+5.23)#1,907 |
| 45. | Enochville | 10.0% | 5.1%(+4.92)#45 | 4.8%(+5.23)#1,927 |
| 46. | Belmont | 10.0% | 5.1%(+4.89)#46 | 4.8%(+5.19)#1,935 |
| 47. | Lake Park | 9.7% | 5.1%(+4.63)#47 | 4.8%(+4.94)#2,059 |
| 48. | Davidson | 9.7% | 5.1%(+4.62)#48 | 4.8%(+4.92)#2,064 |
| 49. | Atlantic Beach | 9.6% | 5.1%(+4.51)#49 | 4.8%(+4.82)#2,122 |
| 50. | Stokesdale | 9.4% | 5.1%(+4.37)#50 | 4.8%(+4.67)#2,226 |
| 51. | Weaverville | 9.3% | 5.1%(+4.26)#51 | 4.8%(+4.56)#2,285 |
| 52. | Unionville | 9.3% | 5.1%(+4.26)#52 | 4.8%(+4.56)#2,287 |
| 53. | South Mills | 9.3% | 5.1%(+4.24)#53 | 4.8%(+4.54)#2,294 |
| 54. | Washington | 9.1% | 5.1%(+4.07)#54 | 4.8%(+4.38)#2,390 |
| 55. | Chocowinity | 9.1% | 5.1%(+4.02)#55 | 4.8%(+4.32)#2,414 |
| 56. | Governors | 9.1% | 5.1%(+4.01)#56 | 4.8%(+4.31)#2,431 |
| 57. | Rutherfordton | 9.1% | 5.1%(+4.00)#57 | 4.8%(+4.30)#2,440 |
| 58. | Mar Mac | 8.9% | 5.1%(+3.81)#58 | 4.8%(+4.11)#2,565 |
| 59. | Mount Pleasant | 8.9% | 5.1%(+3.80)#59 | 4.8%(+4.10)#2,575 |
| 60. | Clemmons | 8.9% | 5.1%(+3.78)#60 | 4.8%(+4.08)#2,582 |
| 61. | Concord | 8.8% | 5.1%(+3.71)#61 | 4.8%(+4.01)#2,635 |
| 62. | Elizabeth City | 8.7% | 5.1%(+3.64)#62 | 4.8%(+3.94)#2,672 |
| 63. | Beech Mountain | 8.6% | 5.1%(+3.52)#63 | 4.8%(+3.82)#2,755 |
| 64. | Mcleansville | 8.6% | 5.1%(+3.50)#64 | 4.8%(+3.80)#2,771 |
| 65. | Wrightsville Beach | 8.5% | 5.1%(+3.45)#65 | 4.8%(+3.75)#2,809 |
| 66. | Kingstown | 8.5% | 5.1%(+3.41)#66 | 4.8%(+3.71)#2,852 |
| 67. | Rockfish | 8.3% | 5.1%(+3.23)#67 | 4.8%(+3.53)#2,994 |
| 68. | Cooleemee | 8.2% | 5.1%(+3.11)#68 | 4.8%(+3.41)#3,083 |
| 69. | Oak Island | 8.1% | 5.1%(+3.07)#69 | 4.8%(+3.37)#3,123 |
| 70. | Ranlo | 8.0% | 5.1%(+2.91)#70 | 4.8%(+3.21)#3,257 |
| 71. | Oak Ridge | 8.0% | 5.1%(+2.89)#71 | 4.8%(+3.20)#3,267 |
| 72. | Rutherford College | 7.9% | 5.1%(+2.80)#72 | 4.8%(+3.10)#3,366 |
| 73. | Rolesville | 7.8% | 5.1%(+2.78)#73 | 4.8%(+3.08)#3,393 |
| 74. | Westport | 7.8% | 5.1%(+2.77)#74 | 4.8%(+3.07)#3,402 |
| 75. | Nashville | 7.8% | 5.1%(+2.76)#75 | 4.8%(+3.06)#3,407 |
| 76. | Bethania | 7.8% | 5.1%(+2.68)#76 | 4.8%(+2.98)#3,474 |
| 77. | Madison | 7.7% | 5.1%(+2.67)#77 | 4.8%(+2.97)#3,481 |
| 78. | Bladenboro | 7.7% | 5.1%(+2.63)#78 | 4.8%(+2.93)#3,517 |
| 79. | Bath | 7.7% | 5.1%(+2.62)#79 | 4.8%(+2.92)#3,542 |
| 80. | North Topsail Beach | 7.6% | 5.1%(+2.56)#80 | 4.8%(+2.86)#3,615 |
| 81. | Royal Pines | 7.6% | 5.1%(+2.55)#81 | 4.8%(+2.85)#3,623 |
| 82. | Cypress Landing | 7.5% | 5.1%(+2.46)#82 | 4.8%(+2.77)#3,701 |
| 83. | Chadbourn | 7.5% | 5.1%(+2.41)#83 | 4.8%(+2.72)#3,745 |
| 84. | Midland | 7.5% | 5.1%(+2.40)#84 | 4.8%(+2.71)#3,760 |
| 85. | Scotch Meadows | 7.4% | 5.1%(+2.35)#85 | 4.8%(+2.65)#3,820 |
| 86. | Whitsett | 7.4% | 5.1%(+2.34)#86 | 4.8%(+2.64)#3,833 |
| 87. | Lake Norman Of Catawba | 7.3% | 5.1%(+2.26)#87 | 4.8%(+2.57)#3,900 |
| 88. | Knightdale | 7.3% | 5.1%(+2.23)#88 | 4.8%(+2.53)#3,952 |
| 89. | Troutman | 7.3% | 5.1%(+2.20)#89 | 4.8%(+2.50)#3,982 |
| 90. | Ocean Isle Beach | 7.3% | 5.1%(+2.19)#90 | 4.8%(+2.49)#3,996 |
| 91. | Whitakers | 7.2% | 5.1%(+2.11)#91 | 4.8%(+2.41)#4,088 |
| 92. | Holly Springs | 7.2% | 5.1%(+2.09)#92 | 4.8%(+2.40)#4,098 |
| 93. | Macon | 7.1% | 5.1%(+2.07)#93 | 4.8%(+2.38)#4,143 |
| 94. | Northlakes | 7.1% | 5.1%(+2.06)#94 | 4.8%(+2.37)#4,157 |
| 95. | Lewisville | 7.1% | 5.1%(+2.05)#95 | 4.8%(+2.35)#4,172 |
| 96. | Cajah S Mountain | 7.0% | 5.1%(+1.97)#96 | 4.8%(+2.27)#4,266 |
| 97. | Pine Knoll Shores | 7.0% | 5.1%(+1.91)#97 | 4.8%(+2.21)#4,348 |
| 98. | Mcfarlan | 7.0% | 5.1%(+1.91)#98 | 4.8%(+2.21)#4,359 |
| 99. | Brices Creek | 6.9% | 5.1%(+1.87)#99 | 4.8%(+2.17)#4,411 |
| 100. | Mount Holly | 6.9% | 5.1%(+1.82)#100 | 4.8%(+2.12)#4,477 |
Common Questions
What are the Top 10 Cities with the Highest Percentage of Population Employed in Finance & Insurance in North Carolina?
Top 10 Cities with the Highest Percentage of Population Employed in Finance & Insurance in North Carolina are:
#1
61.2%
#2
45.9%
#3
35.0%
#4
30.8%
#5
28.6%
#6
22.0%
#7
20.5%
#8
18.6%
#9
17.2%
#10
16.9%
What city has the Highest Percentage of Population Employed in Finance & Insurance in North Carolina?
Ruffin has the Highest Percentage of Population Employed in Finance & Insurance in North Carolina with 61.2%.
What is the Percentage of Population Employed in Finance & Insurance in the State of North Carolina?
Percentage of Population Employed in Finance & Insurance in North Carolina is 5.1%.
What is the Percentage of Population Employed in Finance & Insurance in the United States?
Percentage of Population Employed in Finance & Insurance in the United States is 4.8%.