Cities with the Highest Percentage of Population Employed in Finance & Insurance in Delaware
RELATED REPORTS & OPTIONS
Finance & Insurance
Delaware
Compare Cities
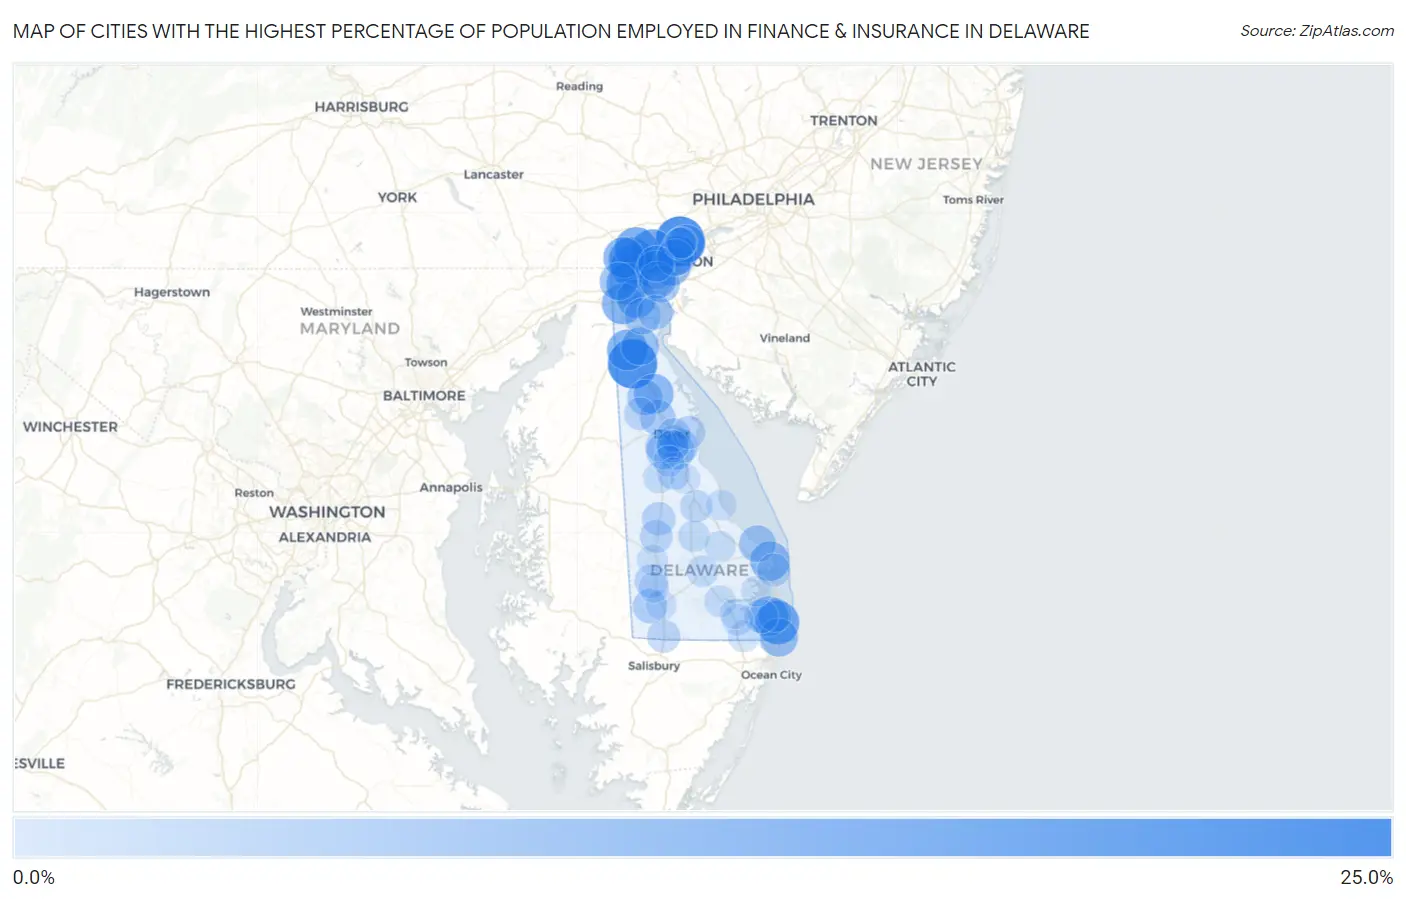
Map of Cities with the Highest Percentage of Population Employed in Finance & Insurance in Delaware
0.0%
25.0%
Cities with the Highest Percentage of Population Employed in Finance & Insurance in Delaware
| City | % Employed | vs State | vs National | |
| 1. | Arden | 20.1% | 7.6%(+12.4)#1 | 4.8%(+15.3)#359 |
| 2. | Townsend | 19.9% | 7.6%(+12.3)#2 | 4.8%(+15.1)#379 |
| 3. | Pike Creek | 15.1% | 7.6%(+7.49)#3 | 4.8%(+10.3)#685 |
| 4. | Pike Creek Valley | 14.3% | 7.6%(+6.69)#4 | 4.8%(+9.54)#774 |
| 5. | Greenville | 14.2% | 7.6%(+6.54)#5 | 4.8%(+9.39)#813 |
| 6. | South Bethany | 13.9% | 7.6%(+6.27)#6 | 4.8%(+9.12)#850 |
| 7. | Hockessin | 13.3% | 7.6%(+5.70)#7 | 4.8%(+8.55)#943 |
| 8. | Brookside | 12.1% | 7.6%(+4.47)#8 | 4.8%(+7.33)#1,204 |
| 9. | Middletown | 11.1% | 7.6%(+3.48)#9 | 4.8%(+6.33)#1,499 |
| 10. | Glasgow | 11.1% | 7.6%(+3.48)#10 | 4.8%(+6.33)#1,500 |
| 11. | North Star | 10.8% | 7.6%(+3.15)#11 | 4.8%(+6.00)#1,612 |
| 12. | Smyrna | 9.8% | 7.6%(+2.20)#12 | 4.8%(+5.05)#2,001 |
| 13. | Ocean View | 9.8% | 7.6%(+2.17)#13 | 4.8%(+5.02)#2,014 |
| 14. | Rehoboth Beach | 9.5% | 7.6%(+1.90)#14 | 4.8%(+4.76)#2,164 |
| 15. | Bellefonte | 9.2% | 7.6%(+1.59)#15 | 4.8%(+4.44)#2,355 |
| 16. | Bear | 9.1% | 7.6%(+1.46)#16 | 4.8%(+4.31)#2,437 |
| 17. | Wilmington | 9.1% | 7.6%(+1.45)#17 | 4.8%(+4.31)#2,439 |
| 18. | Newport | 8.5% | 7.6%(+0.884)#18 | 4.8%(+3.74)#2,832 |
| 19. | Fenwick Island | 8.4% | 7.6%(+0.792)#19 | 4.8%(+3.64)#2,906 |
| 20. | Claymont | 8.3% | 7.6%(+0.643)#20 | 4.8%(+3.50)#3,017 |
| 21. | Newark | 8.0% | 7.6%(+0.393)#21 | 4.8%(+3.24)#3,222 |
| 22. | Odessa | 7.8% | 7.6%(+0.212)#22 | 4.8%(+3.06)#3,406 |
| 23. | New Castle | 7.4% | 7.6%(-0.252)#23 | 4.8%(+2.60)#3,872 |
| 24. | Wilmington Manor | 7.1% | 7.6%(-0.542)#24 | 4.8%(+2.31)#4,222 |
| 25. | Edgemoor | 6.8% | 7.6%(-0.784)#25 | 4.8%(+2.07)#4,552 |
| 26. | Lewes | 6.8% | 7.6%(-0.795)#26 | 4.8%(+2.06)#4,571 |
| 27. | Rising Sun Lebanon | 6.4% | 7.6%(-1.26)#27 | 4.8%(+1.59)#5,235 |
| 28. | St Georges | 6.3% | 7.6%(-1.31)#28 | 4.8%(+1.54)#5,300 |
| 29. | Elsmere | 6.1% | 7.6%(-1.51)#29 | 4.8%(+1.35)#5,602 |
| 30. | Cheswold | 5.7% | 7.6%(-1.95)#30 | 4.8%(+0.903)#6,377 |
| 31. | Clayton | 5.6% | 7.6%(-1.98)#31 | 4.8%(+0.875)#6,436 |
| 32. | Camden | 5.5% | 7.6%(-2.13)#32 | 4.8%(+0.722)#6,757 |
| 33. | Delaware City | 4.6% | 7.6%(-3.06)#33 | 4.8%(-0.207)#8,784 |
| 34. | Bethel | 4.2% | 7.6%(-3.42)#34 | 4.8%(-0.566)#9,752 |
| 35. | Dover Base Housing | 4.2% | 7.6%(-3.42)#35 | 4.8%(-0.570)#9,759 |
| 36. | Kent Acres | 4.1% | 7.6%(-3.49)#36 | 4.8%(-0.638)#9,977 |
| 37. | Wyoming | 4.0% | 7.6%(-3.62)#37 | 4.8%(-0.773)#10,354 |
| 38. | Bethany Beach | 3.8% | 7.6%(-3.78)#38 | 4.8%(-0.931)#10,843 |
| 39. | Dover | 3.8% | 7.6%(-3.85)#39 | 4.8%(-1.00)#11,056 |
| 40. | Millville | 3.8% | 7.6%(-3.86)#40 | 4.8%(-1.01)#11,069 |
| 41. | Farmington | 3.4% | 7.6%(-4.21)#41 | 4.8%(-1.36)#12,134 |
| 42. | Seaford | 3.3% | 7.6%(-4.31)#42 | 4.8%(-1.46)#12,449 |
| 43. | Little Creek | 2.9% | 7.6%(-4.68)#43 | 4.8%(-1.83)#13,680 |
| 44. | Delmar | 2.9% | 7.6%(-4.69)#44 | 4.8%(-1.84)#13,725 |
| 45. | Dewey Beach | 2.9% | 7.6%(-4.73)#45 | 4.8%(-1.88)#13,830 |
| 46. | Greenwood | 2.9% | 7.6%(-4.77)#46 | 4.8%(-1.92)#13,962 |
| 47. | Kenton | 2.4% | 7.6%(-5.21)#47 | 4.8%(-2.36)#15,462 |
| 48. | Highland Acres | 2.3% | 7.6%(-5.28)#48 | 4.8%(-2.43)#15,720 |
| 49. | Riverview | 2.3% | 7.6%(-5.35)#49 | 4.8%(-2.50)#15,959 |
| 50. | Milford | 2.2% | 7.6%(-5.47)#50 | 4.8%(-2.62)#16,361 |
| 51. | Ardencroft | 1.8% | 7.6%(-5.86)#51 | 4.8%(-3.01)#17,746 |
| 52. | Millsboro | 1.6% | 7.6%(-6.01)#52 | 4.8%(-3.15)#18,202 |
| 53. | Georgetown | 1.6% | 7.6%(-6.01)#53 | 4.8%(-3.16)#18,219 |
| 54. | Ellendale | 1.6% | 7.6%(-6.02)#54 | 4.8%(-3.17)#18,274 |
| 55. | Felton | 1.5% | 7.6%(-6.16)#55 | 4.8%(-3.31)#18,753 |
| 56. | Selbyville | 1.4% | 7.6%(-6.21)#56 | 4.8%(-3.35)#18,883 |
| 57. | Frankford | 1.3% | 7.6%(-6.35)#57 | 4.8%(-3.50)#19,350 |
| 58. | Woodside East | 1.1% | 7.6%(-6.53)#58 | 4.8%(-3.68)#19,908 |
| 59. | Ardentown | 1.0% | 7.6%(-6.62)#59 | 4.8%(-3.77)#20,154 |
| 60. | Bridgeville | 0.87% | 7.6%(-6.75)#60 | 4.8%(-3.90)#20,498 |
| 61. | Milton | 0.82% | 7.6%(-6.80)#61 | 4.8%(-3.95)#20,634 |
| 62. | Laurel | 0.80% | 7.6%(-6.82)#62 | 4.8%(-3.97)#20,695 |
| 63. | Blades | 0.66% | 7.6%(-6.96)#63 | 4.8%(-4.11)#21,053 |
| 64. | Slaughter Beach | 0.57% | 7.6%(-7.04)#64 | 4.8%(-4.19)#21,233 |
| 65. | Long Neck | 0.45% | 7.6%(-7.17)#65 | 4.8%(-4.31)#21,458 |
| 66. | Frederica | 0.41% | 7.6%(-7.21)#66 | 4.8%(-4.35)#21,522 |
| 67. | Dagsboro | 0.32% | 7.6%(-7.30)#67 | 4.8%(-4.45)#21,643 |
1
Common Questions
What are the Top 10 Cities with the Highest Percentage of Population Employed in Finance & Insurance in Delaware?
Top 10 Cities with the Highest Percentage of Population Employed in Finance & Insurance in Delaware are:
#1
20.1%
#2
19.9%
#3
15.1%
#4
14.3%
#5
14.2%
#6
13.9%
#7
13.3%
#8
12.1%
#9
11.1%
#10
11.1%
What city has the Highest Percentage of Population Employed in Finance & Insurance in Delaware?
Arden has the Highest Percentage of Population Employed in Finance & Insurance in Delaware with 20.1%.
What is the Percentage of Population Employed in Finance & Insurance in the State of Delaware?
Percentage of Population Employed in Finance & Insurance in Delaware is 7.6%.
What is the Percentage of Population Employed in Finance & Insurance in the United States?
Percentage of Population Employed in Finance & Insurance in the United States is 4.8%.