Walnut Creek, CA Map & Demographics
Walnut Creek Map
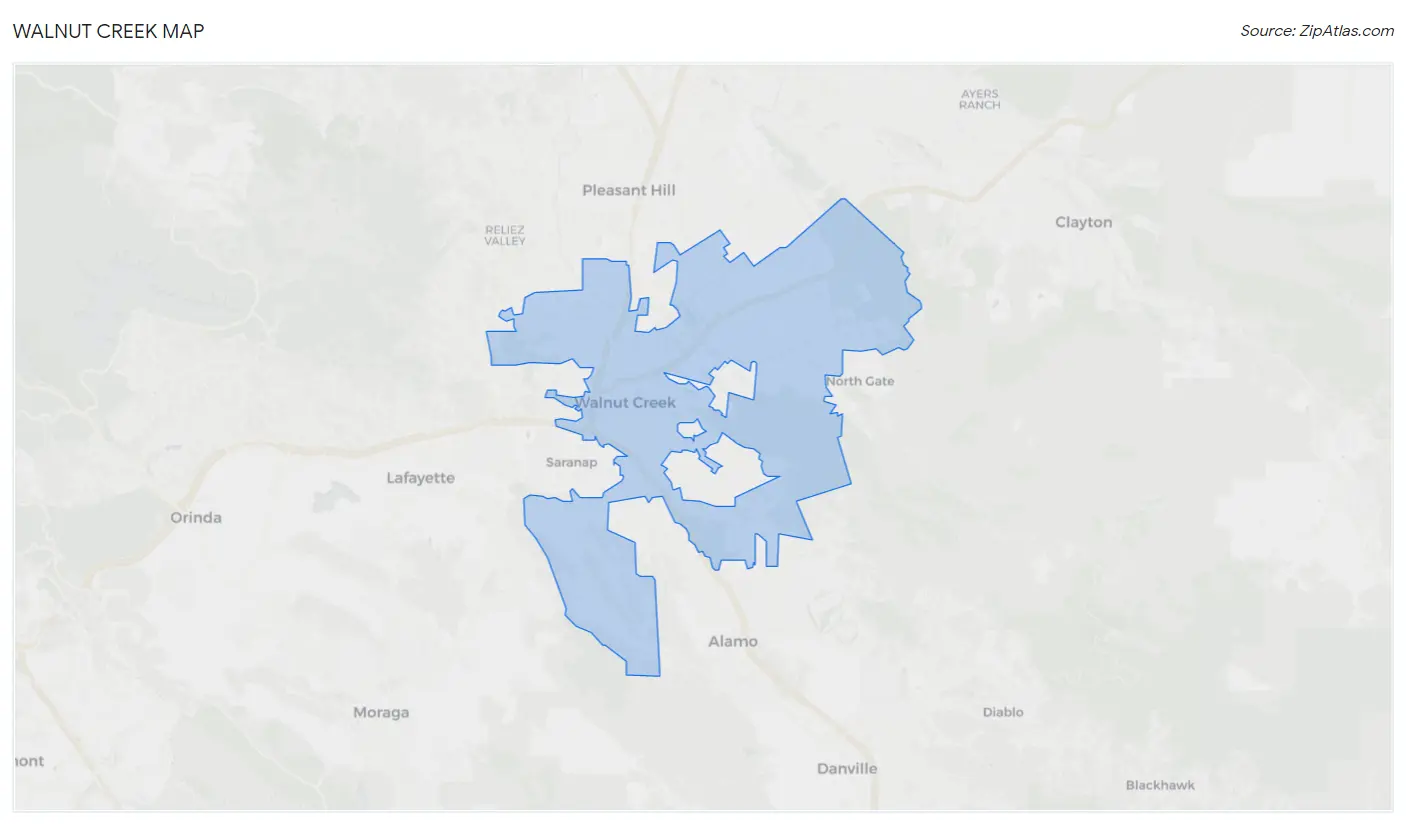
Walnut Creek Overview
$80,347
PER CAPITA INCOME
$167,241
AVG FAMILY INCOME
$129,971
AVG HOUSEHOLD INCOME
25.9%
WAGE / INCOME GAP [ % ]
74.1¢/ $1
WAGE / INCOME GAP [ $ ]
$13,769
FAMILY INCOME DEFICIT
0.46
INEQUALITY / GINI INDEX
69,809
TOTAL POPULATION
33,323
MALE POPULATION
36,486
FEMALE POPULATION
91.33
MALES / 100 FEMALES
109.49
FEMALES / 100 MALES
47.2
MEDIAN AGE
2.8
AVG FAMILY SIZE
2.1
AVG HOUSEHOLD SIZE
34,822
LABOR FORCE [ PEOPLE ]
57.8%
PERCENT IN LABOR FORCE
4.9%
UNEMPLOYMENT RATE
Income in Walnut Creek
Income Overview in Walnut Creek
Per Capita Income in Walnut Creek is $80,347, while median incomes of families and households are $167,241 and $129,971 respectively.
| Characteristic | Number | Measure |
| Per Capita Income | 69,809 | $80,347 |
| Median Family Income | 17,966 | $167,241 |
| Mean Family Income | 17,966 | $217,195 |
| Median Household Income | 32,205 | $129,971 |
| Mean Household Income | 32,205 | $172,606 |
| Income Deficit | 17,966 | $13,769 |
| Wage / Income Gap (%) | 69,809 | 25.87% |
| Wage / Income Gap ($) | 69,809 | 74.13¢ per $1 |
| Gini / Inequality Index | 69,809 | 0.46 |
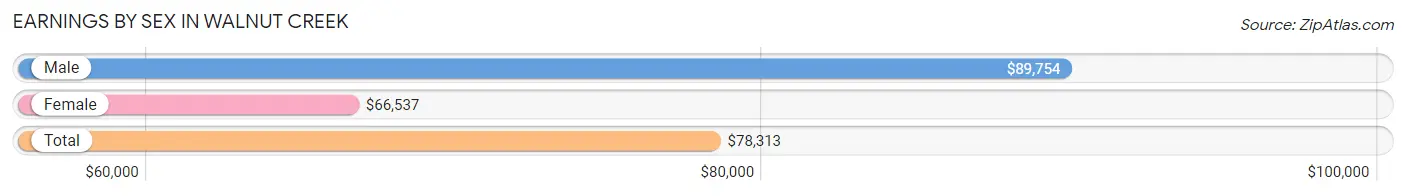
Earnings by Sex in Walnut Creek
Average Earnings in Walnut Creek are $78,313, $89,754 for men and $66,537 for women, a difference of 25.9%.
| Sex | Number | Average Earnings |
| Male | 18,951 (52.2%) | $89,754 |
| Female | 17,335 (47.8%) | $66,537 |
| Total | 36,286 (100.0%) | $78,313 |
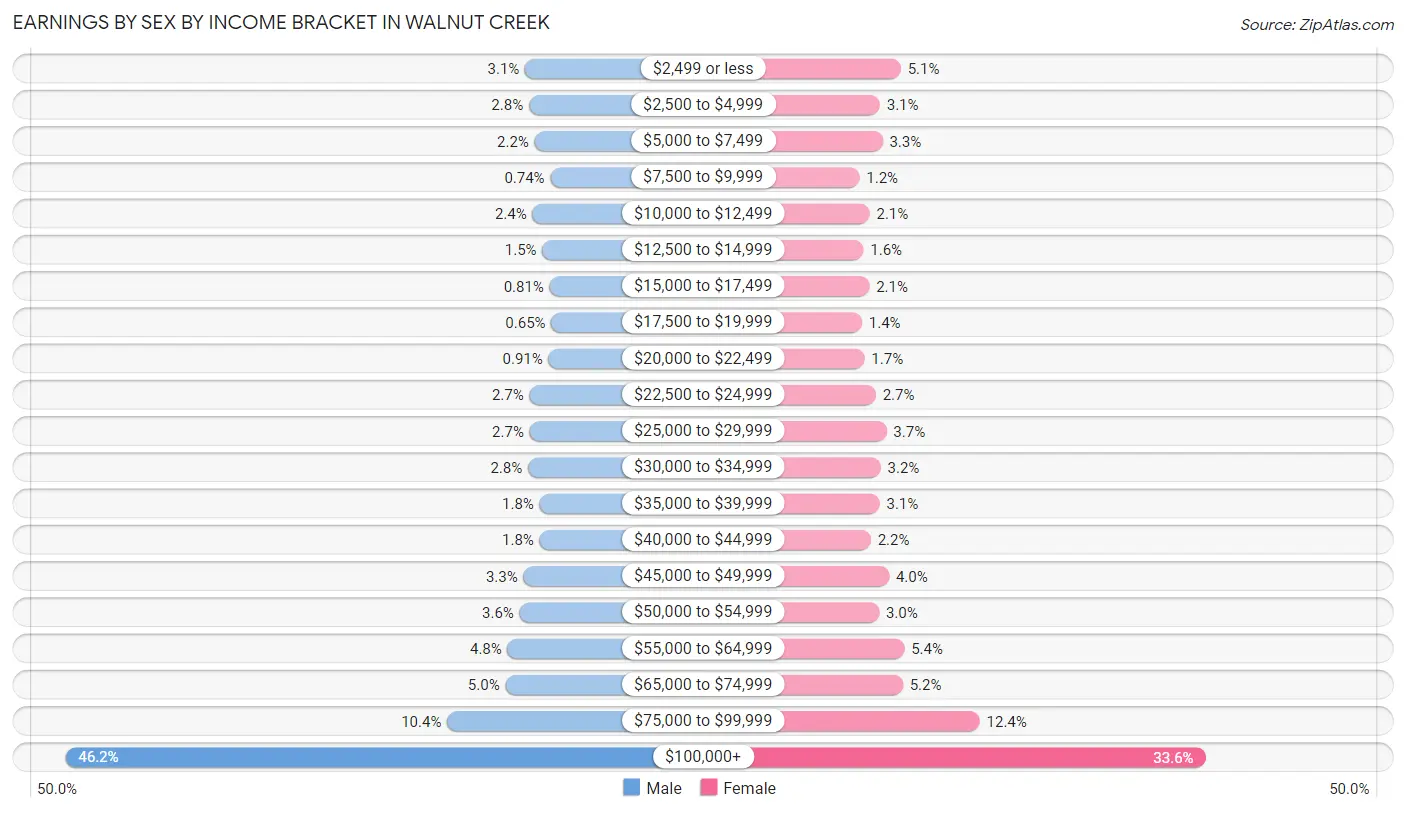
Earnings by Sex by Income Bracket in Walnut Creek
The most common earnings brackets in Walnut Creek are $100,000+ for men (8,752 | 46.2%) and $100,000+ for women (5,822 | 33.6%).
| Income | Male | Female |
| $2,499 or less | 589 (3.1%) | 876 (5.1%) |
| $2,500 to $4,999 | 522 (2.8%) | 535 (3.1%) |
| $5,000 to $7,499 | 420 (2.2%) | 579 (3.3%) |
| $7,500 to $9,999 | 141 (0.7%) | 205 (1.2%) |
| $10,000 to $12,499 | 458 (2.4%) | 369 (2.1%) |
| $12,500 to $14,999 | 283 (1.5%) | 268 (1.5%) |
| $15,000 to $17,499 | 154 (0.8%) | 364 (2.1%) |
| $17,500 to $19,999 | 123 (0.6%) | 244 (1.4%) |
| $20,000 to $22,499 | 173 (0.9%) | 286 (1.7%) |
| $22,500 to $24,999 | 511 (2.7%) | 469 (2.7%) |
| $25,000 to $29,999 | 508 (2.7%) | 643 (3.7%) |
| $30,000 to $34,999 | 538 (2.8%) | 549 (3.2%) |
| $35,000 to $39,999 | 332 (1.8%) | 533 (3.1%) |
| $40,000 to $44,999 | 332 (1.8%) | 389 (2.2%) |
| $45,000 to $49,999 | 618 (3.3%) | 685 (4.0%) |
| $50,000 to $54,999 | 686 (3.6%) | 521 (3.0%) |
| $55,000 to $64,999 | 900 (4.8%) | 933 (5.4%) |
| $65,000 to $74,999 | 939 (5.0%) | 909 (5.2%) |
| $75,000 to $99,999 | 1,972 (10.4%) | 2,156 (12.4%) |
| $100,000+ | 8,752 (46.2%) | 5,822 (33.6%) |
| Total | 18,951 (100.0%) | 17,335 (100.0%) |
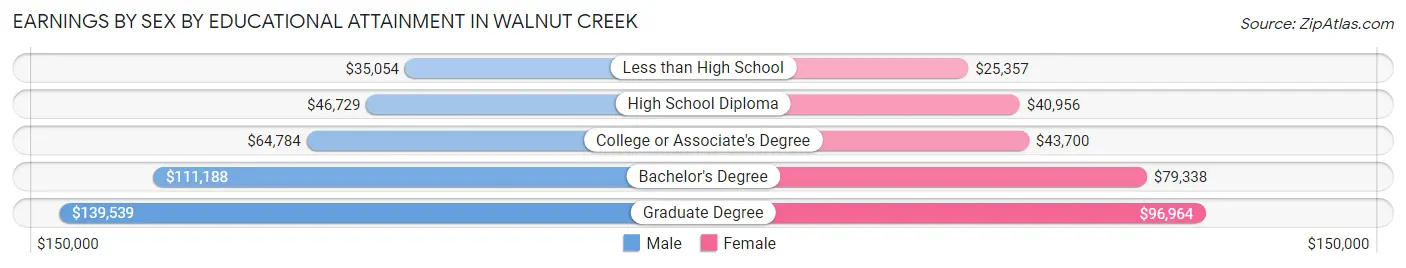
Earnings by Sex by Educational Attainment in Walnut Creek
Average earnings in Walnut Creek are $100,324 for men and $75,048 for women, a difference of 25.2%. Men with an educational attainment of graduate degree enjoy the highest average annual earnings of $139,539, while those with less than high school education earn the least with $35,054. Women with an educational attainment of graduate degree earn the most with the average annual earnings of $96,964, while those with less than high school education have the smallest earnings of $25,357.
| Educational Attainment | Male Income | Female Income |
| Less than High School | $35,054 | $25,357 |
| High School Diploma | $46,729 | $40,956 |
| College or Associate's Degree | $64,784 | $43,700 |
| Bachelor's Degree | $111,188 | $79,338 |
| Graduate Degree | $139,539 | $96,964 |
| Total | $100,324 | $75,048 |
Family Income in Walnut Creek
Family Income Brackets in Walnut Creek
According to the Walnut Creek family income data, there are 7,725 families falling into the $200,000+ income range, which is the most common income bracket and makes up 43.0% of all families. Conversely, the $10,000 to $14,999 income bracket is the least frequent group with only 180 families (1.0%) belonging to this category.
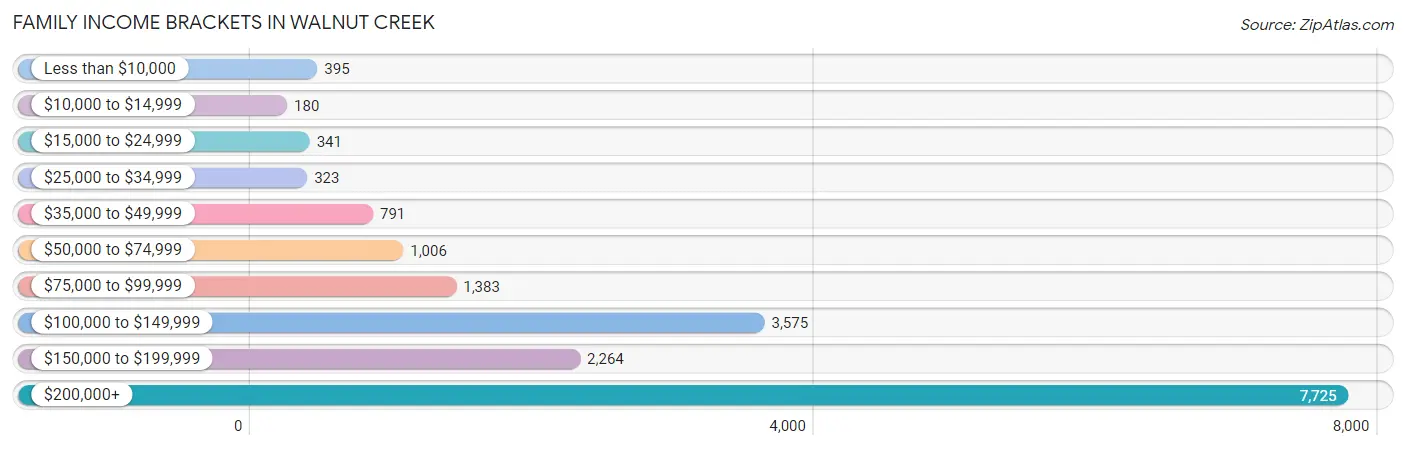
| Income Bracket | # Families | % Families |
| Less than $10,000 | 395 | 2.2% |
| $10,000 to $14,999 | 180 | 1.0% |
| $15,000 to $24,999 | 341 | 1.9% |
| $25,000 to $34,999 | 323 | 1.8% |
| $35,000 to $49,999 | 791 | 4.4% |
| $50,000 to $74,999 | 1,006 | 5.6% |
| $75,000 to $99,999 | 1,383 | 7.7% |
| $100,000 to $149,999 | 3,575 | 19.9% |
| $150,000 to $199,999 | 2,264 | 12.6% |
| $200,000+ | 7,725 | 43.0% |
Family Income by Famaliy Size in Walnut Creek
5-person families (853 | 4.8%) account for the highest median family income in Walnut Creek with $250,001 per family, while 3-person families (3,987 | 22.2%) have the highest median income of $73,710 per family member.
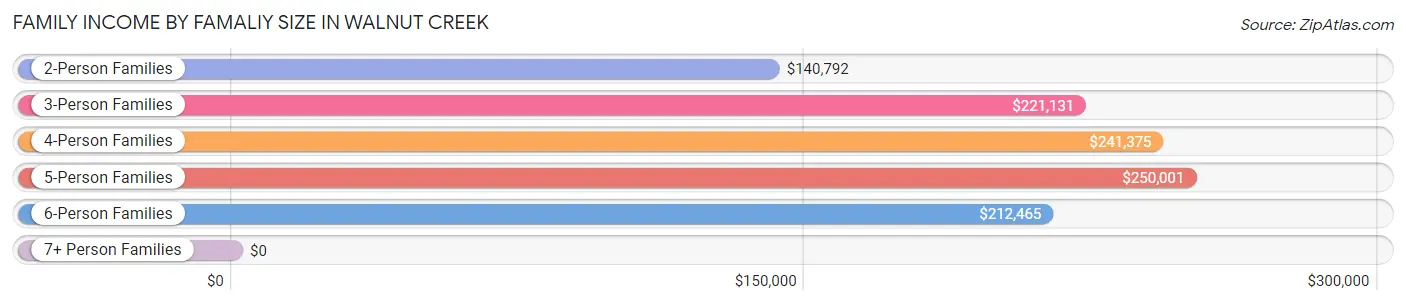
| Income Bracket | # Families | Median Income |
| 2-Person Families | 10,044 (55.9%) | $140,792 |
| 3-Person Families | 3,987 (22.2%) | $221,131 |
| 4-Person Families | 2,721 (15.1%) | $241,375 |
| 5-Person Families | 853 (4.8%) | $250,001 |
| 6-Person Families | 287 (1.6%) | $212,465 |
| 7+ Person Families | 74 (0.4%) | $0 |
| Total | 17,966 (100.0%) | $167,241 |
Family Income by Number of Earners in Walnut Creek
The median family income in Walnut Creek is $167,241, with families comprising 3+ earners (1,348) having the highest median family income of $250,001, while families with no earners (3,773) have the lowest median family income of $106,533, accounting for 7.5% and 21.0% of families, respectively.
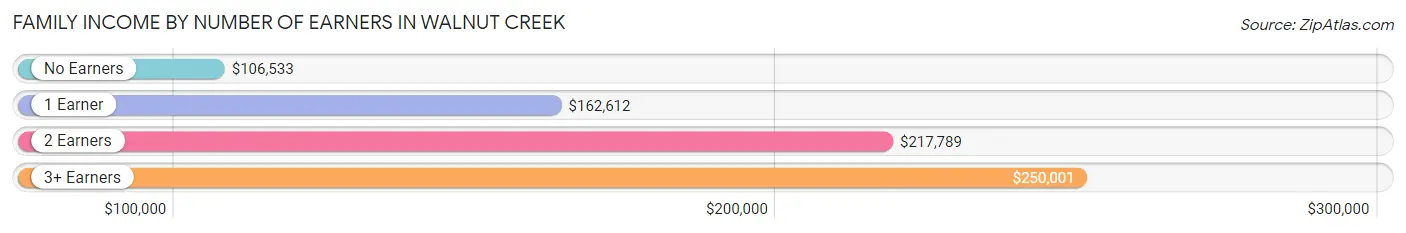
| Number of Earners | # Families | Median Income |
| No Earners | 3,773 (21.0%) | $106,533 |
| 1 Earner | 5,289 (29.4%) | $162,612 |
| 2 Earners | 7,556 (42.1%) | $217,789 |
| 3+ Earners | 1,348 (7.5%) | $250,001 |
| Total | 17,966 (100.0%) | $167,241 |
Household Income in Walnut Creek
Household Income Brackets in Walnut Creek
With 9,726 households falling in the category, the $200,000+ income range is the most frequent in Walnut Creek, accounting for 30.2% of all households. In contrast, only 644 households (2.0%) fall into the $10,000 to $14,999 income bracket, making it the least populous group.
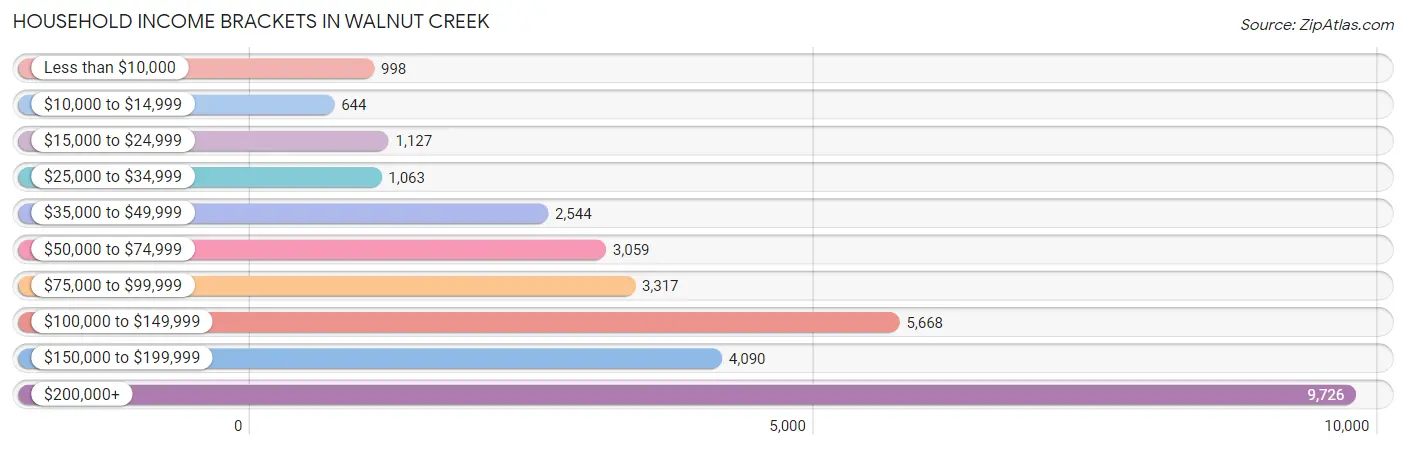
| Income Bracket | # Households | % Households |
| Less than $10,000 | 998 | 3.1% |
| $10,000 to $14,999 | 644 | 2.0% |
| $15,000 to $24,999 | 1,127 | 3.5% |
| $25,000 to $34,999 | 1,063 | 3.3% |
| $35,000 to $49,999 | 2,544 | 7.9% |
| $50,000 to $74,999 | 3,059 | 9.5% |
| $75,000 to $99,999 | 3,317 | 10.3% |
| $100,000 to $149,999 | 5,668 | 17.6% |
| $150,000 to $199,999 | 4,090 | 12.7% |
| $200,000+ | 9,726 | 30.2% |
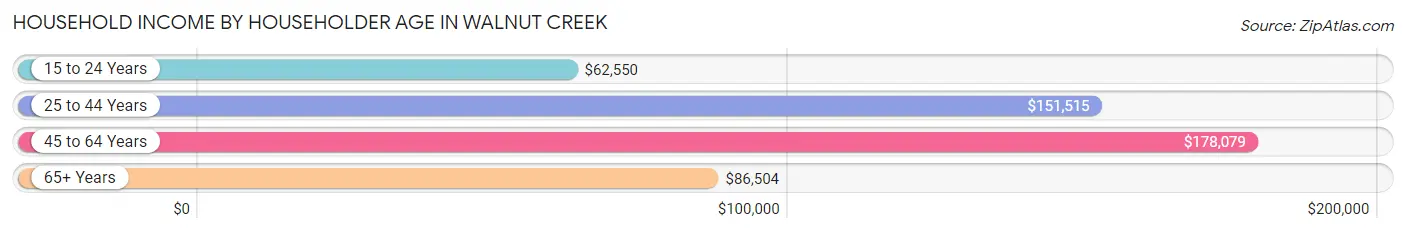
Household Income by Householder Age in Walnut Creek
The median household income in Walnut Creek is $129,971, with the highest median household income of $178,079 found in the 45 to 64 years age bracket for the primary householder. A total of 9,044 households (28.1%) fall into this category. Meanwhile, the 15 to 24 years age bracket for the primary householder has the lowest median household income of $62,550, with 505 households (1.6%) in this group.
| Income Bracket | # Households | Median Income |
| 15 to 24 Years | 505 (1.6%) | $62,550 |
| 25 to 44 Years | 9,436 (29.3%) | $151,515 |
| 45 to 64 Years | 9,044 (28.1%) | $178,079 |
| 65+ Years | 13,220 (41.0%) | $86,504 |
| Total | 32,205 (100.0%) | $129,971 |
Poverty in Walnut Creek
Income Below Poverty by Sex and Age in Walnut Creek
With 5.6% poverty level for males and 5.9% for females among the residents of Walnut Creek, 6 to 11 year old males and 15 year old females are the most vulnerable to poverty, with 263 males (15.5%) and 58 females (18.4%) in their respective age groups living below the poverty level.
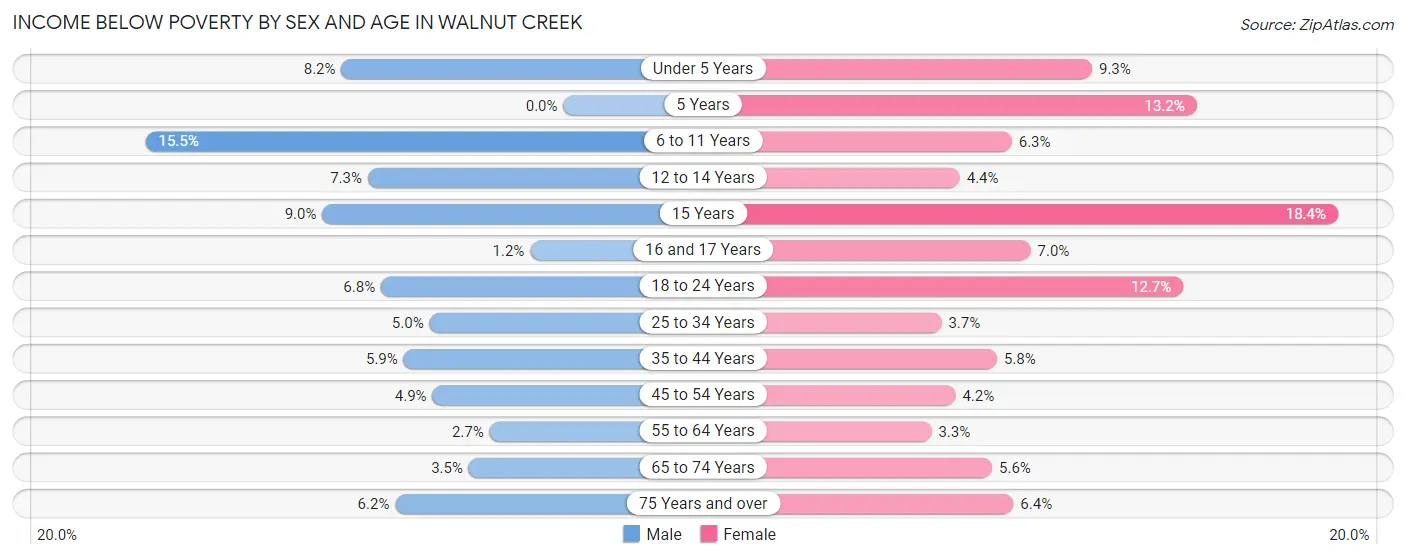
| Age Bracket | Male | Female |
| Under 5 Years | 148 (8.2%) | 142 (9.3%) |
| 5 Years | 0 (0.0%) | 49 (13.2%) |
| 6 to 11 Years | 263 (15.5%) | 107 (6.3%) |
| 12 to 14 Years | 60 (7.3%) | 27 (4.4%) |
| 15 Years | 29 (8.9%) | 58 (18.4%) |
| 16 and 17 Years | 8 (1.2%) | 42 (7.0%) |
| 18 to 24 Years | 136 (6.8%) | 265 (12.7%) |
| 25 to 34 Years | 246 (5.0%) | 178 (3.7%) |
| 35 to 44 Years | 251 (5.9%) | 245 (5.8%) |
| 45 to 54 Years | 187 (4.9%) | 158 (4.2%) |
| 55 to 64 Years | 115 (2.7%) | 140 (3.3%) |
| 65 to 74 Years | 138 (3.5%) | 302 (5.6%) |
| 75 Years and over | 255 (6.2%) | 406 (6.4%) |
| Total | 1,836 (5.6%) | 2,119 (5.9%) |
Income Above Poverty by Sex and Age in Walnut Creek
According to the poverty statistics in Walnut Creek, males aged 5 years and females aged 55 to 64 years are the age groups that are most secure financially, with 100.0% of males and 96.7% of females in these age groups living above the poverty line.
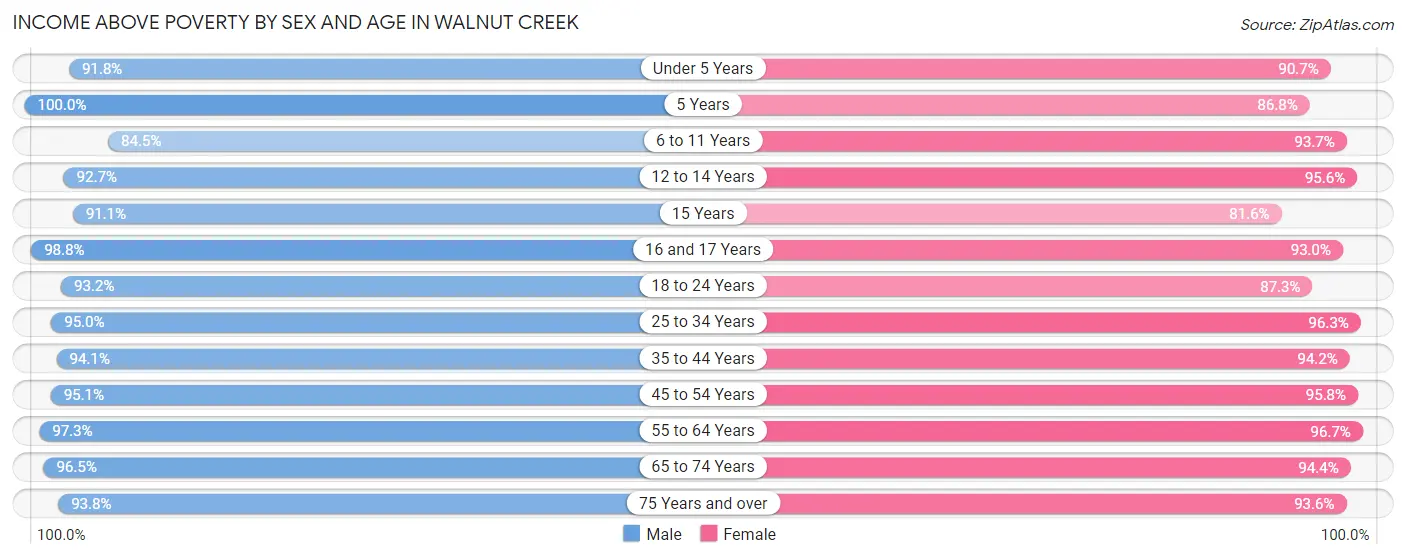
| Age Bracket | Male | Female |
| Under 5 Years | 1,648 (91.8%) | 1,387 (90.7%) |
| 5 Years | 249 (100.0%) | 323 (86.8%) |
| 6 to 11 Years | 1,433 (84.5%) | 1,590 (93.7%) |
| 12 to 14 Years | 766 (92.7%) | 590 (95.6%) |
| 15 Years | 295 (91.0%) | 257 (81.6%) |
| 16 and 17 Years | 644 (98.8%) | 557 (93.0%) |
| 18 to 24 Years | 1,872 (93.2%) | 1,827 (87.3%) |
| 25 to 34 Years | 4,706 (95.0%) | 4,638 (96.3%) |
| 35 to 44 Years | 3,984 (94.1%) | 4,008 (94.2%) |
| 45 to 54 Years | 3,658 (95.1%) | 3,582 (95.8%) |
| 55 to 64 Years | 4,077 (97.3%) | 4,065 (96.7%) |
| 65 to 74 Years | 3,790 (96.5%) | 5,115 (94.4%) |
| 75 Years and over | 3,832 (93.8%) | 5,966 (93.6%) |
| Total | 30,954 (94.4%) | 33,905 (94.1%) |
Income Below Poverty Among Married-Couple Families in Walnut Creek
The poverty statistics for married-couple families in Walnut Creek show that 2.4% or 362 of the total 15,071 families live below the poverty line. Families with 3 or 4 children have the highest poverty rate of 21.1%, comprising of 129 families. On the other hand, families with 5 or more children have the lowest poverty rate of 0.0%, which includes 0 families.
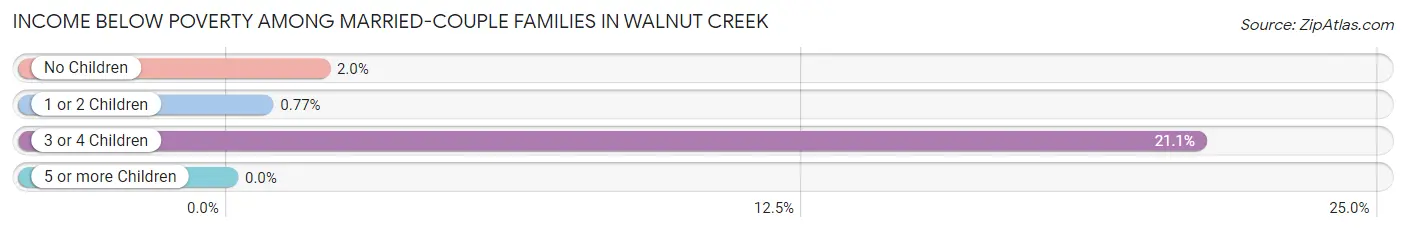
| Children | Above Poverty | Below Poverty |
| No Children | 9,714 (98.0%) | 198 (2.0%) |
| 1 or 2 Children | 4,501 (99.2%) | 35 (0.8%) |
| 3 or 4 Children | 483 (78.9%) | 129 (21.1%) |
| 5 or more Children | 11 (100.0%) | 0 (0.0%) |
| Total | 14,709 (97.6%) | 362 (2.4%) |
Income Below Poverty Among Single-Parent Households in Walnut Creek
According to the poverty data in Walnut Creek, 13.8% or 143 single-father households and 11.0% or 204 single-mother households are living below the poverty line. Among single-father households, those with 1 or 2 children have the highest poverty rate, with 135 households (40.7%) experiencing poverty. Likewise, among single-mother households, those with 3 or 4 children have the highest poverty rate, with 54 households (50.9%) falling below the poverty line.
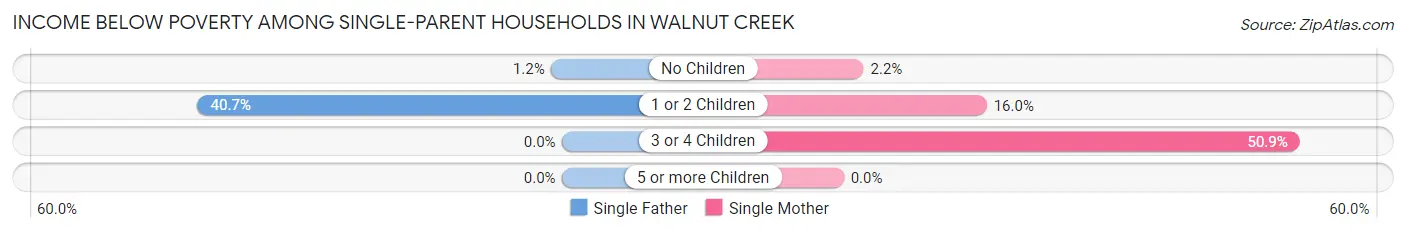
| Children | Single Father | Single Mother |
| No Children | 8 (1.2%) | 21 (2.2%) |
| 1 or 2 Children | 135 (40.7%) | 129 (16.0%) |
| 3 or 4 Children | 0 (0.0%) | 54 (50.9%) |
| 5 or more Children | 0 (0.0%) | 0 (0.0%) |
| Total | 143 (13.8%) | 204 (11.0%) |
Income Below Poverty Among Married-Couple vs Single-Parent Households in Walnut Creek
The poverty data for Walnut Creek shows that 362 of the married-couple family households (2.4%) and 347 of the single-parent households (12.0%) are living below the poverty level. Within the married-couple family households, those with 3 or 4 children have the highest poverty rate, with 129 households (21.1%) falling below the poverty line. Among the single-parent households, those with 3 or 4 children have the highest poverty rate, with 54 household (33.8%) living below poverty.
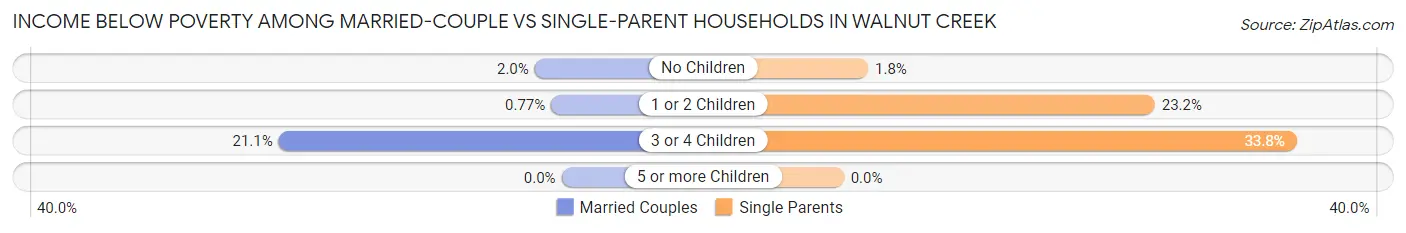
| Children | Married-Couple Families | Single-Parent Households |
| No Children | 198 (2.0%) | 29 (1.8%) |
| 1 or 2 Children | 35 (0.8%) | 264 (23.2%) |
| 3 or 4 Children | 129 (21.1%) | 54 (33.8%) |
| 5 or more Children | 0 (0.0%) | 0 (0.0%) |
| Total | 362 (2.4%) | 347 (12.0%) |
Race in Walnut Creek
The most populous races in Walnut Creek are White / Caucasian (46,879 | 67.1%), Asian (11,492 | 16.5%), and Two or more Races (7,548 | 10.8%).
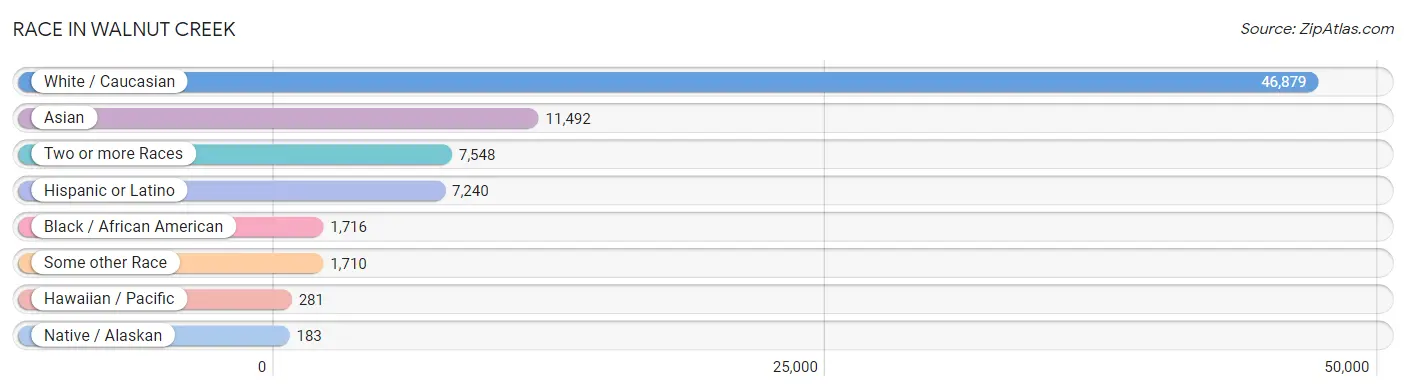
| Race | # Population | % Population |
| Asian | 11,492 | 16.5% |
| Black / African American | 1,716 | 2.5% |
| Hawaiian / Pacific | 281 | 0.4% |
| Hispanic or Latino | 7,240 | 10.4% |
| Native / Alaskan | 183 | 0.3% |
| White / Caucasian | 46,879 | 67.1% |
| Two or more Races | 7,548 | 10.8% |
| Some other Race | 1,710 | 2.5% |
| Total | 69,809 | 100.0% |
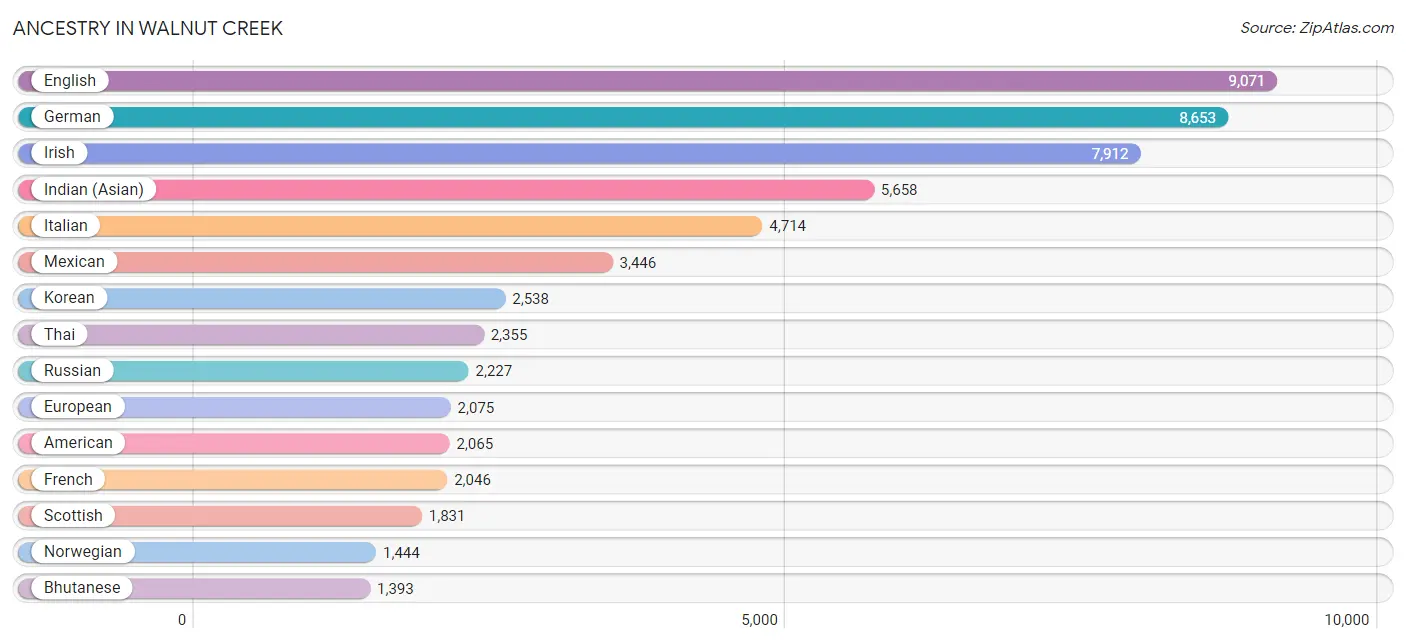
Ancestry in Walnut Creek
The most populous ancestries reported in Walnut Creek are English (9,071 | 13.0%), German (8,653 | 12.4%), Irish (7,912 | 11.3%), Indian (Asian) (5,658 | 8.1%), and Italian (4,714 | 6.8%), together accounting for 51.6% of all Walnut Creek residents.
| Ancestry | # Population | % Population |
| Afghan | 252 | 0.4% |
| African | 112 | 0.2% |
| American | 2,065 | 3.0% |
| Arab | 1,136 | 1.6% |
| Argentinean | 74 | 0.1% |
| Armenian | 213 | 0.3% |
| Assyrian / Chaldean / Syriac | 23 | 0.0% |
| Australian | 34 | 0.1% |
| Austrian | 320 | 0.5% |
| Bangladeshi | 133 | 0.2% |
| Basque | 13 | 0.0% |
| Belgian | 62 | 0.1% |
| Bhutanese | 1,393 | 2.0% |
| Blackfeet | 27 | 0.0% |
| Brazilian | 106 | 0.2% |
| British | 536 | 0.8% |
| Bulgarian | 239 | 0.3% |
| Burmese | 1,102 | 1.6% |
| Cambodian | 247 | 0.4% |
| Canadian | 163 | 0.2% |
| Cape Verdean | 27 | 0.0% |
| Celtic | 15 | 0.0% |
| Central American | 919 | 1.3% |
| Central American Indian | 10 | 0.0% |
| Cherokee | 283 | 0.4% |
| Chilean | 61 | 0.1% |
| Chippewa | 5 | 0.0% |
| Choctaw | 147 | 0.2% |
| Colombian | 262 | 0.4% |
| Costa Rican | 55 | 0.1% |
| Creek | 14 | 0.0% |
| Croatian | 98 | 0.1% |
| Cuban | 101 | 0.1% |
| Cypriot | 11 | 0.0% |
| Czech | 394 | 0.6% |
| Czechoslovakian | 173 | 0.3% |
| Danish | 721 | 1.0% |
| Dutch | 917 | 1.3% |
| Eastern European | 750 | 1.1% |
| Ecuadorian | 60 | 0.1% |
| Egyptian | 189 | 0.3% |
| English | 9,071 | 13.0% |
| Ethiopian | 114 | 0.2% |
| European | 2,075 | 3.0% |
| Filipino | 243 | 0.4% |
| Finnish | 325 | 0.5% |
| French | 2,046 | 2.9% |
| French Canadian | 263 | 0.4% |
| German | 8,653 | 12.4% |
| German Russian | 20 | 0.0% |
| Ghanaian | 5 | 0.0% |
| Greek | 542 | 0.8% |
| Guamanian / Chamorro | 59 | 0.1% |
| Guatemalan | 92 | 0.1% |
| Haitian | 10 | 0.0% |
| Honduran | 15 | 0.0% |
| Hopi | 23 | 0.0% |
| Hungarian | 244 | 0.4% |
| Icelander | 18 | 0.0% |
| Indian (Asian) | 5,658 | 8.1% |
| Indonesian | 221 | 0.3% |
| Iranian | 955 | 1.4% |
| Iraqi | 15 | 0.0% |
| Irish | 7,912 | 11.3% |
| Iroquois | 19 | 0.0% |
| Israeli | 161 | 0.2% |
| Italian | 4,714 | 6.8% |
| Jamaican | 40 | 0.1% |
| Japanese | 191 | 0.3% |
| Jordanian | 26 | 0.0% |
| Korean | 2,538 | 3.6% |
| Laotian | 162 | 0.2% |
| Latvian | 18 | 0.0% |
| Lebanese | 139 | 0.2% |
| Lithuanian | 221 | 0.3% |
| Malaysian | 201 | 0.3% |
| Maltese | 9 | 0.0% |
| Mexican | 3,446 | 4.9% |
| Mexican American Indian | 133 | 0.2% |
| Mongolian | 24 | 0.0% |
| Native Hawaiian | 439 | 0.6% |
| Nicaraguan | 270 | 0.4% |
| Nigerian | 57 | 0.1% |
| Northern European | 471 | 0.7% |
| Norwegian | 1,444 | 2.1% |
| Osage | 13 | 0.0% |
| Paiute | 10 | 0.0% |
| Pakistani | 165 | 0.2% |
| Palestinian | 99 | 0.1% |
| Panamanian | 224 | 0.3% |
| Paraguayan | 8 | 0.0% |
| Peruvian | 524 | 0.7% |
| Pima | 1 | 0.0% |
| Polish | 1,304 | 1.9% |
| Portuguese | 676 | 1.0% |
| Potawatomi | 11 | 0.0% |
| Puerto Rican | 318 | 0.5% |
| Romanian | 85 | 0.1% |
| Russian | 2,227 | 3.2% |
| Salvadoran | 263 | 0.4% |
| Samoan | 43 | 0.1% |
| Scandinavian | 210 | 0.3% |
| Scotch-Irish | 487 | 0.7% |
| Scottish | 1,831 | 2.6% |
| Serbian | 139 | 0.2% |
| Sioux | 10 | 0.0% |
| Slavic | 15 | 0.0% |
| Slovak | 120 | 0.2% |
| Slovene | 47 | 0.1% |
| South American | 1,095 | 1.6% |
| Soviet Union | 34 | 0.1% |
| Spaniard | 411 | 0.6% |
| Spanish | 633 | 0.9% |
| Sri Lankan | 721 | 1.0% |
| Subsaharan African | 332 | 0.5% |
| Swedish | 1,049 | 1.5% |
| Swiss | 481 | 0.7% |
| Syrian | 84 | 0.1% |
| Thai | 2,355 | 3.4% |
| Tlingit-Haida | 28 | 0.0% |
| Tohono O'Odham | 1 | 0.0% |
| Trinidadian and Tobagonian | 13 | 0.0% |
| Turkish | 229 | 0.3% |
| Ukrainian | 600 | 0.9% |
| Uruguayan | 13 | 0.0% |
| Venezuelan | 82 | 0.1% |
| Vietnamese | 174 | 0.3% |
| Welsh | 536 | 0.8% |
| Yaqui | 33 | 0.1% |
| Yugoslavian | 37 | 0.1% |
| Zimbabwean | 11 | 0.0% | View All 131 Rows |
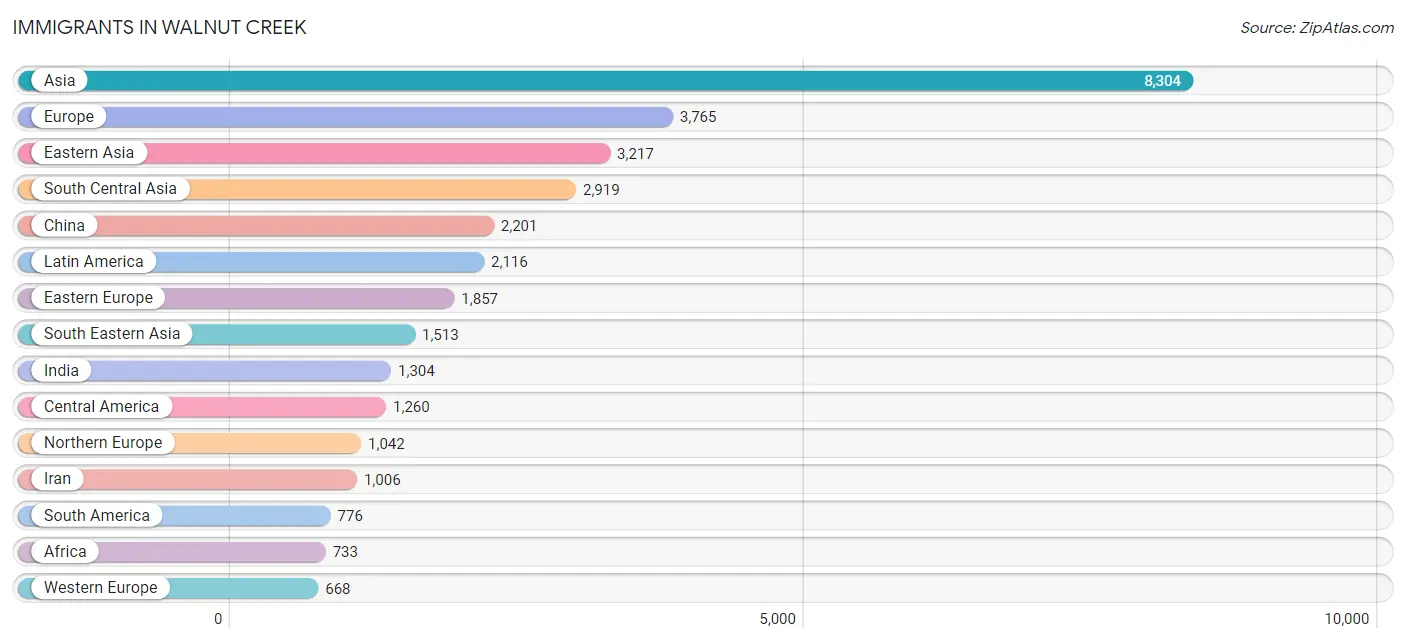
Immigrants in Walnut Creek
The most numerous immigrant groups reported in Walnut Creek came from Asia (8,304 | 11.9%), Europe (3,765 | 5.4%), Eastern Asia (3,217 | 4.6%), South Central Asia (2,919 | 4.2%), and China (2,201 | 3.2%), together accounting for 29.2% of all Walnut Creek residents.
| Immigration Origin | # Population | % Population |
| Afghanistan | 233 | 0.3% |
| Africa | 733 | 1.1% |
| Argentina | 74 | 0.1% |
| Armenia | 66 | 0.1% |
| Asia | 8,304 | 11.9% |
| Australia | 19 | 0.0% |
| Austria | 62 | 0.1% |
| Azores | 8 | 0.0% |
| Bangladesh | 192 | 0.3% |
| Belarus | 125 | 0.2% |
| Belgium | 8 | 0.0% |
| Bosnia and Herzegovina | 18 | 0.0% |
| Brazil | 110 | 0.2% |
| Bulgaria | 139 | 0.2% |
| Cambodia | 70 | 0.1% |
| Canada | 655 | 0.9% |
| Caribbean | 80 | 0.1% |
| Central America | 1,260 | 1.8% |
| Chile | 35 | 0.1% |
| China | 2,201 | 3.2% |
| Colombia | 126 | 0.2% |
| Costa Rica | 68 | 0.1% |
| Croatia | 12 | 0.0% |
| Czechoslovakia | 28 | 0.0% |
| Denmark | 83 | 0.1% |
| Dominican Republic | 9 | 0.0% |
| Eastern Africa | 108 | 0.2% |
| Eastern Asia | 3,217 | 4.6% |
| Eastern Europe | 1,857 | 2.7% |
| Ecuador | 28 | 0.0% |
| Egypt | 73 | 0.1% |
| El Salvador | 39 | 0.1% |
| England | 385 | 0.5% |
| Eritrea | 46 | 0.1% |
| Ethiopia | 27 | 0.0% |
| Europe | 3,765 | 5.4% |
| Fiji | 34 | 0.1% |
| France | 136 | 0.2% |
| Germany | 315 | 0.4% |
| Greece | 16 | 0.0% |
| Guatemala | 51 | 0.1% |
| Honduras | 15 | 0.0% |
| Hong Kong | 262 | 0.4% |
| Hungary | 8 | 0.0% |
| India | 1,304 | 1.9% |
| Indonesia | 118 | 0.2% |
| Iran | 1,006 | 1.4% |
| Iraq | 8 | 0.0% |
| Ireland | 92 | 0.1% |
| Israel | 115 | 0.2% |
| Italy | 59 | 0.1% |
| Jamaica | 45 | 0.1% |
| Japan | 232 | 0.3% |
| Jordan | 52 | 0.1% |
| Kazakhstan | 81 | 0.1% |
| Kenya | 19 | 0.0% |
| Korea | 605 | 0.9% |
| Laos | 102 | 0.2% |
| Latin America | 2,116 | 3.0% |
| Latvia | 7 | 0.0% |
| Lebanon | 45 | 0.1% |
| Lithuania | 12 | 0.0% |
| Malaysia | 24 | 0.0% |
| Mexico | 642 | 0.9% |
| Middle Africa | 52 | 0.1% |
| Moldova | 86 | 0.1% |
| Morocco | 18 | 0.0% |
| Netherlands | 62 | 0.1% |
| Nicaragua | 117 | 0.2% |
| Nigeria | 18 | 0.0% |
| Northern Africa | 435 | 0.6% |
| Northern Europe | 1,042 | 1.5% |
| Norway | 13 | 0.0% |
| Oceania | 53 | 0.1% |
| Pakistan | 52 | 0.1% |
| Panama | 328 | 0.5% |
| Peru | 338 | 0.5% |
| Philippines | 606 | 0.9% |
| Poland | 174 | 0.3% |
| Portugal | 8 | 0.0% |
| Romania | 28 | 0.0% |
| Russia | 565 | 0.8% |
| Saudi Arabia | 25 | 0.0% |
| Scotland | 53 | 0.1% |
| Singapore | 26 | 0.0% |
| South Africa | 36 | 0.1% |
| South America | 776 | 1.1% |
| South Central Asia | 2,919 | 4.2% |
| South Eastern Asia | 1,513 | 2.2% |
| Southern Europe | 185 | 0.3% |
| Spain | 102 | 0.2% |
| Sweden | 28 | 0.0% |
| Switzerland | 85 | 0.1% |
| Syria | 8 | 0.0% |
| Taiwan | 457 | 0.6% |
| Thailand | 127 | 0.2% |
| Trinidad and Tobago | 13 | 0.0% |
| Turkey | 110 | 0.2% |
| Uganda | 5 | 0.0% |
| Ukraine | 423 | 0.6% |
| Uzbekistan | 24 | 0.0% |
| Venezuela | 57 | 0.1% |
| Vietnam | 373 | 0.5% |
| Western Africa | 24 | 0.0% |
| Western Asia | 445 | 0.6% |
| Western Europe | 668 | 1.0% |
| Yemen | 5 | 0.0% |
| Zimbabwe | 11 | 0.0% | View All 108 Rows |
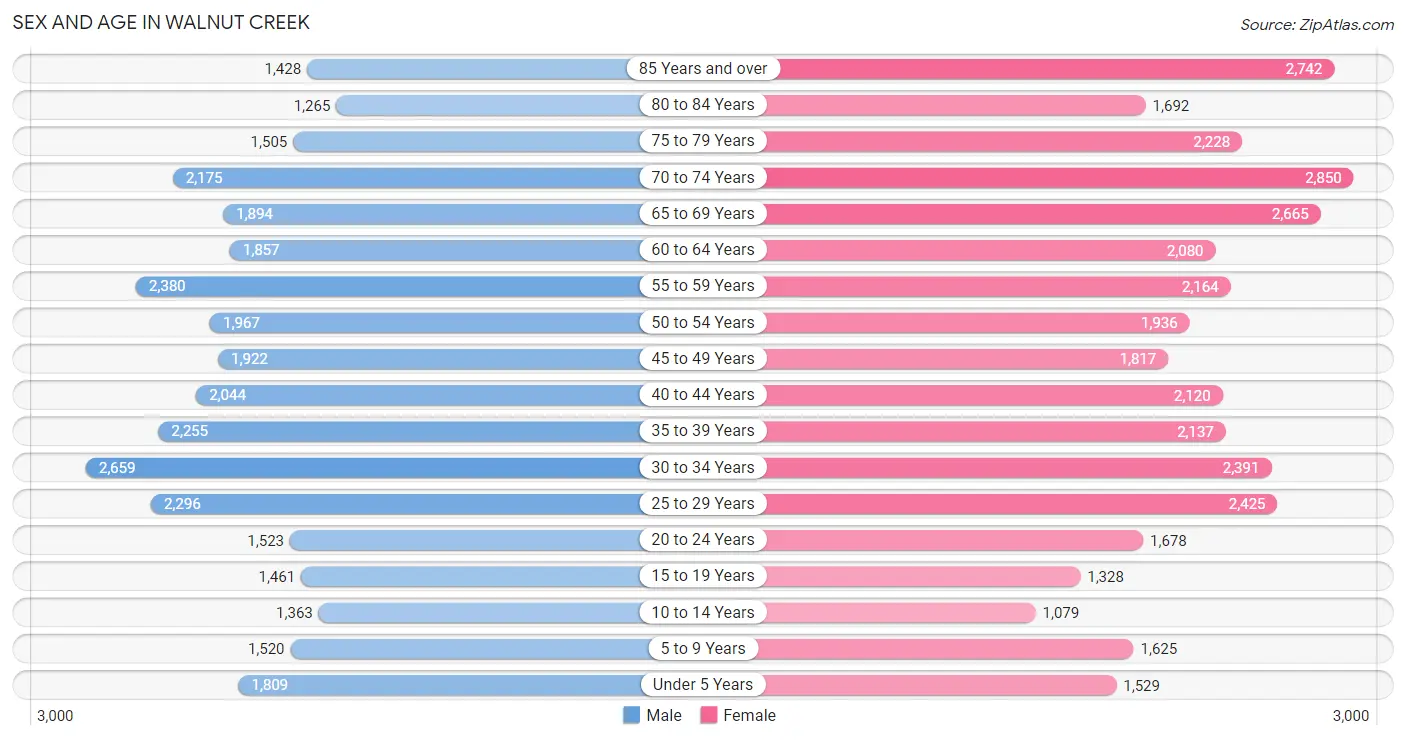
Sex and Age in Walnut Creek
Sex and Age in Walnut Creek
The most populous age groups in Walnut Creek are 30 to 34 Years (2,659 | 8.0%) for men and 70 to 74 Years (2,850 | 7.8%) for women.
| Age Bracket | Male | Female |
| Under 5 Years | 1,809 (5.4%) | 1,529 (4.2%) |
| 5 to 9 Years | 1,520 (4.6%) | 1,625 (4.4%) |
| 10 to 14 Years | 1,363 (4.1%) | 1,079 (3.0%) |
| 15 to 19 Years | 1,461 (4.4%) | 1,328 (3.6%) |
| 20 to 24 Years | 1,523 (4.6%) | 1,678 (4.6%) |
| 25 to 29 Years | 2,296 (6.9%) | 2,425 (6.7%) |
| 30 to 34 Years | 2,659 (8.0%) | 2,391 (6.6%) |
| 35 to 39 Years | 2,255 (6.8%) | 2,137 (5.9%) |
| 40 to 44 Years | 2,044 (6.1%) | 2,120 (5.8%) |
| 45 to 49 Years | 1,922 (5.8%) | 1,817 (5.0%) |
| 50 to 54 Years | 1,967 (5.9%) | 1,936 (5.3%) |
| 55 to 59 Years | 2,380 (7.1%) | 2,164 (5.9%) |
| 60 to 64 Years | 1,857 (5.6%) | 2,080 (5.7%) |
| 65 to 69 Years | 1,894 (5.7%) | 2,665 (7.3%) |
| 70 to 74 Years | 2,175 (6.5%) | 2,850 (7.8%) |
| 75 to 79 Years | 1,505 (4.5%) | 2,228 (6.1%) |
| 80 to 84 Years | 1,265 (3.8%) | 1,692 (4.6%) |
| 85 Years and over | 1,428 (4.3%) | 2,742 (7.5%) |
| Total | 33,323 (100.0%) | 36,486 (100.0%) |
Families and Households in Walnut Creek
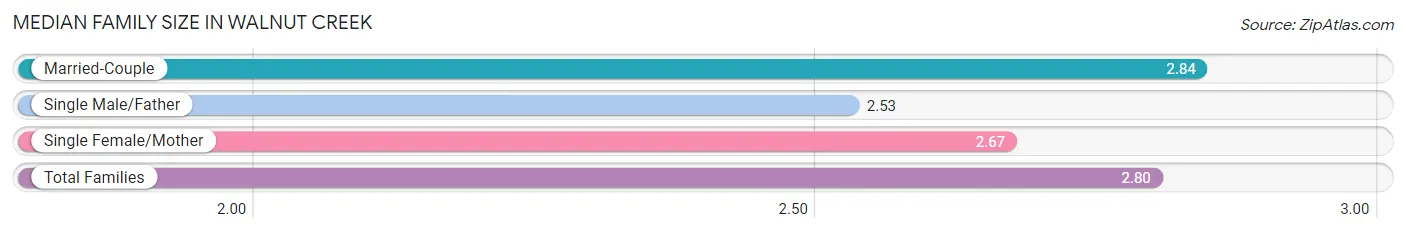
Median Family Size in Walnut Creek
The median family size in Walnut Creek is 2.80 persons per family, with married-couple families (15,071 | 83.9%) accounting for the largest median family size of 2.84 persons per family. On the other hand, single male/father families (1,040 | 5.8%) represent the smallest median family size with 2.53 persons per family.
| Family Type | # Families | Family Size |
| Married-Couple | 15,071 (83.9%) | 2.84 |
| Single Male/Father | 1,040 (5.8%) | 2.53 |
| Single Female/Mother | 1,855 (10.3%) | 2.67 |
| Total Families | 17,966 (100.0%) | 2.80 |
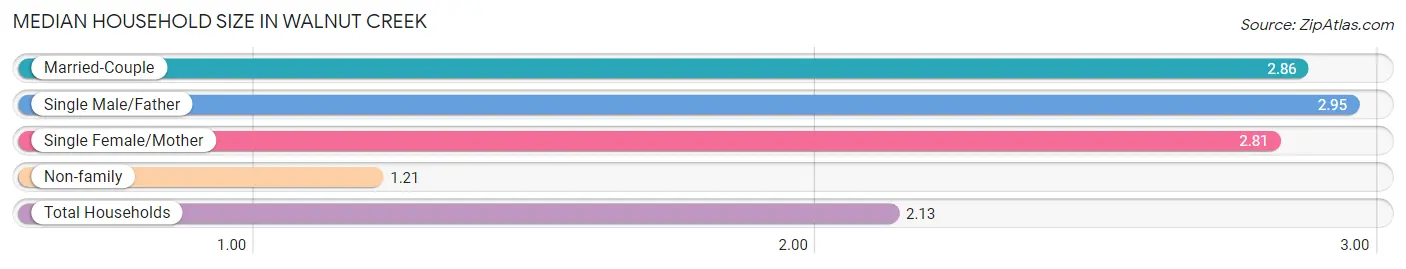
Median Household Size in Walnut Creek
The median household size in Walnut Creek is 2.13 persons per household, with single male/father households (1,040 | 3.2%) accounting for the largest median household size of 2.95 persons per household. non-family households (14,239 | 44.2%) represent the smallest median household size with 1.21 persons per household.
| Household Type | # Households | Household Size |
| Married-Couple | 15,071 (46.8%) | 2.86 |
| Single Male/Father | 1,040 (3.2%) | 2.95 |
| Single Female/Mother | 1,855 (5.8%) | 2.81 |
| Non-family | 14,239 (44.2%) | 1.21 |
| Total Households | 32,205 (100.0%) | 2.13 |
Household Size by Marriage Status in Walnut Creek
Out of a total of 32,205 households in Walnut Creek, 17,966 (55.8%) are family households, while 14,239 (44.2%) are nonfamily households. The most numerous type of family households are 2-person households, comprising 9,714, and the most common type of nonfamily households are 1-person households, comprising 11,840.
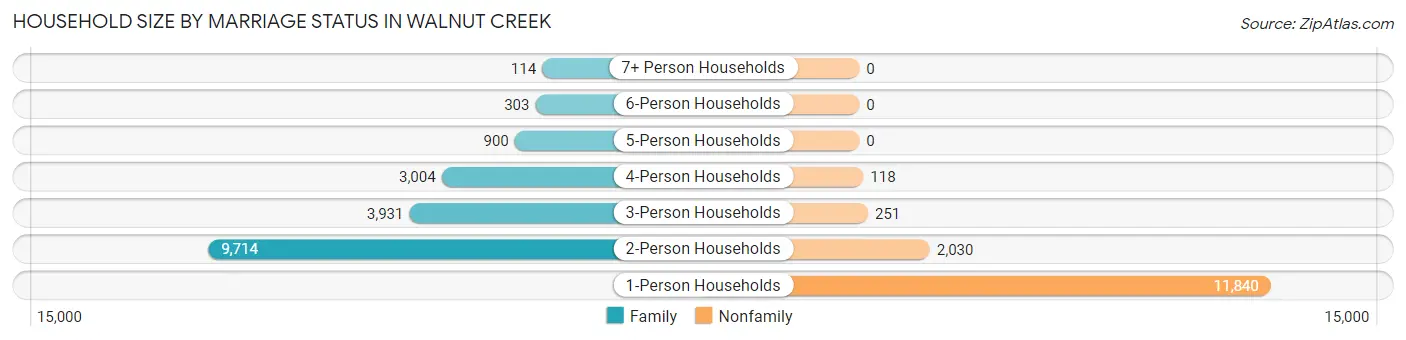
| Household Size | Family Households | Nonfamily Households |
| 1-Person Households | - | 11,840 (36.8%) |
| 2-Person Households | 9,714 (30.2%) | 2,030 (6.3%) |
| 3-Person Households | 3,931 (12.2%) | 251 (0.8%) |
| 4-Person Households | 3,004 (9.3%) | 118 (0.4%) |
| 5-Person Households | 900 (2.8%) | 0 (0.0%) |
| 6-Person Households | 303 (0.9%) | 0 (0.0%) |
| 7+ Person Households | 114 (0.4%) | 0 (0.0%) |
| Total | 17,966 (55.8%) | 14,239 (44.2%) |
Female Fertility in Walnut Creek
Fertility by Age in Walnut Creek
Average fertility rate in Walnut Creek is 51.0 births per 1,000 women. Women in the age bracket of 35 to 50 years have the highest fertility rate with 60.0 births per 1,000 women. Women in the age bracket of 35 to 50 years acount for 53.5% of all women with births.
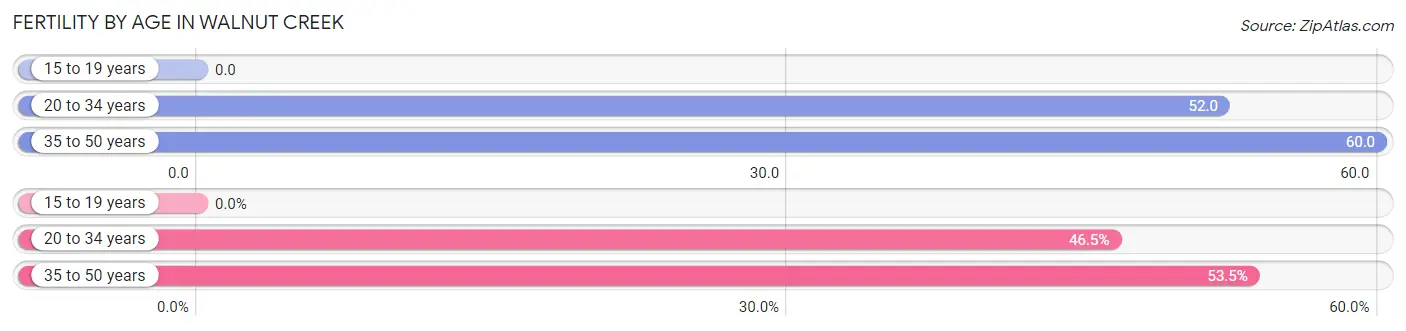
| Age Bracket | Women with Births | Births / 1,000 Women |
| 15 to 19 years | 0 (0.0%) | 0.0 |
| 20 to 34 years | 337 (46.5%) | 52.0 |
| 35 to 50 years | 388 (53.5%) | 60.0 |
| Total | 725 (100.0%) | 51.0 |
Fertility by Age by Marriage Status in Walnut Creek
75.2% of women with births (725) in Walnut Creek are married. The highest percentage of unmarried women with births falls into 20 to 34 years age bracket with 28.5% of them unmarried at the time of birth, while the lowest percentage of unmarried women with births belong to 35 to 50 years age bracket with 21.7% of them unmarried.
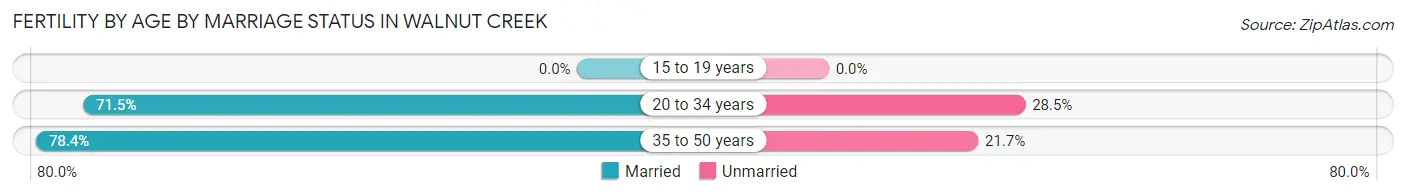
| Age Bracket | Married | Unmarried |
| 15 to 19 years | 0 (0.0%) | 0 (0.0%) |
| 20 to 34 years | 241 (71.5%) | 96 (28.5%) |
| 35 to 50 years | 304 (78.3%) | 84 (21.6%) |
| Total | 545 (75.2%) | 180 (24.8%) |
Fertility by Education in Walnut Creek
Average fertility rate in Walnut Creek is 51.0 births per 1,000 women. Women with the education attainment of high school diploma have the highest fertility rate of 82.0 births per 1,000 women, while women with the education attainment of less than high school have the lowest fertility at 6.0 births per 1,000 women. Women with the education attainment of bachelor's degree represent 38.8% of all women with births.
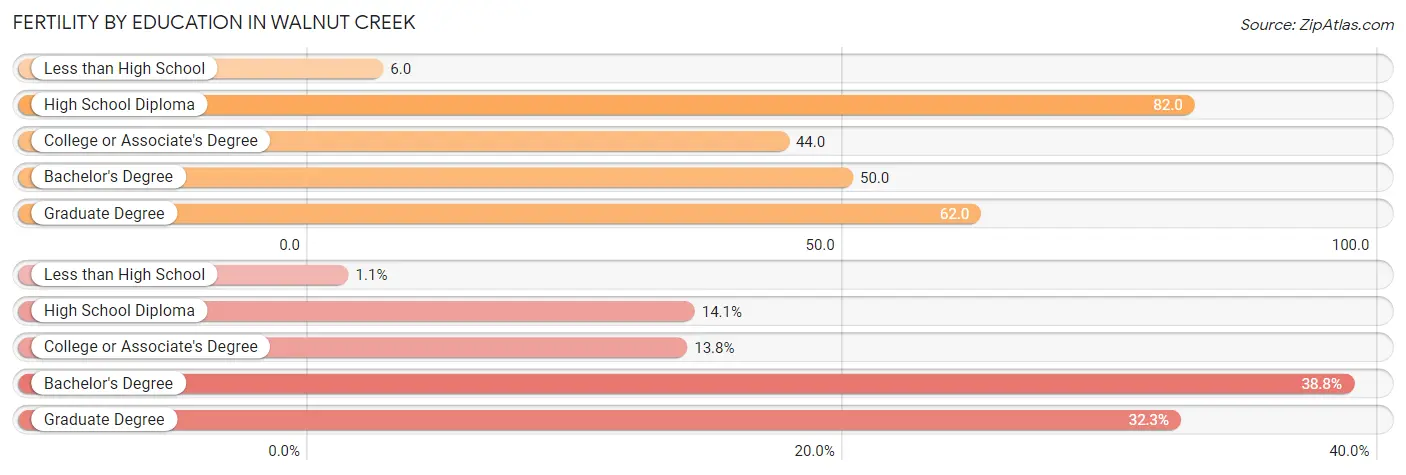
| Educational Attainment | Women with Births | Births / 1,000 Women |
| Less than High School | 8 (1.1%) | 6.0 |
| High School Diploma | 102 (14.1%) | 82.0 |
| College or Associate's Degree | 100 (13.8%) | 44.0 |
| Bachelor's Degree | 281 (38.8%) | 50.0 |
| Graduate Degree | 234 (32.3%) | 62.0 |
| Total | 725 (100.0%) | 51.0 |
Fertility by Education by Marriage Status in Walnut Creek
24.8% of women with births in Walnut Creek are unmarried. Women with the educational attainment of graduate degree are most likely to be married with 100.0% of them married at childbirth, while women with the educational attainment of less than high school are least likely to be married with 100.0% of them unmarried at childbirth.
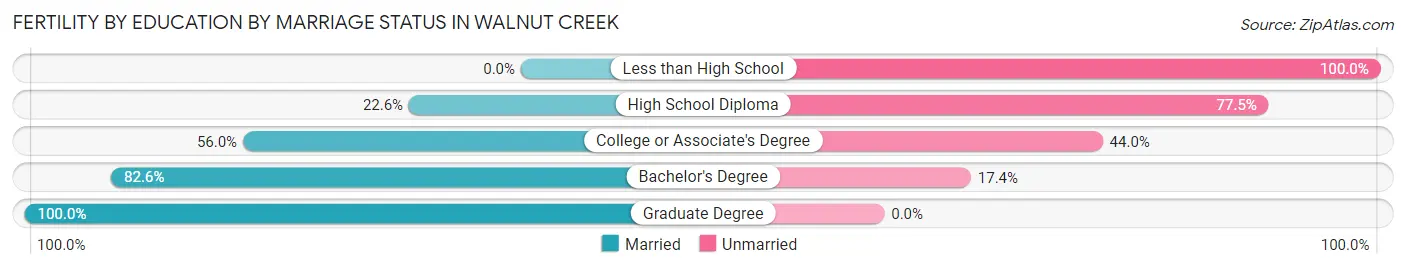
| Educational Attainment | Married | Unmarried |
| Less than High School | 0 (0.0%) | 8 (100.0%) |
| High School Diploma | 23 (22.6%) | 79 (77.4%) |
| College or Associate's Degree | 56 (56.0%) | 44 (44.0%) |
| Bachelor's Degree | 232 (82.6%) | 49 (17.4%) |
| Graduate Degree | 234 (100.0%) | 0 (0.0%) |
| Total | 545 (75.2%) | 180 (24.8%) |
Employment Characteristics in Walnut Creek
Employment by Class of Employer in Walnut Creek
Among the 32,387 employed individuals in Walnut Creek, private company employees (21,391 | 66.0%), self-employed (not incorporated) (3,206 | 9.9%), and not-for-profit organizations (2,718 | 8.4%) make up the most common classes of employment.
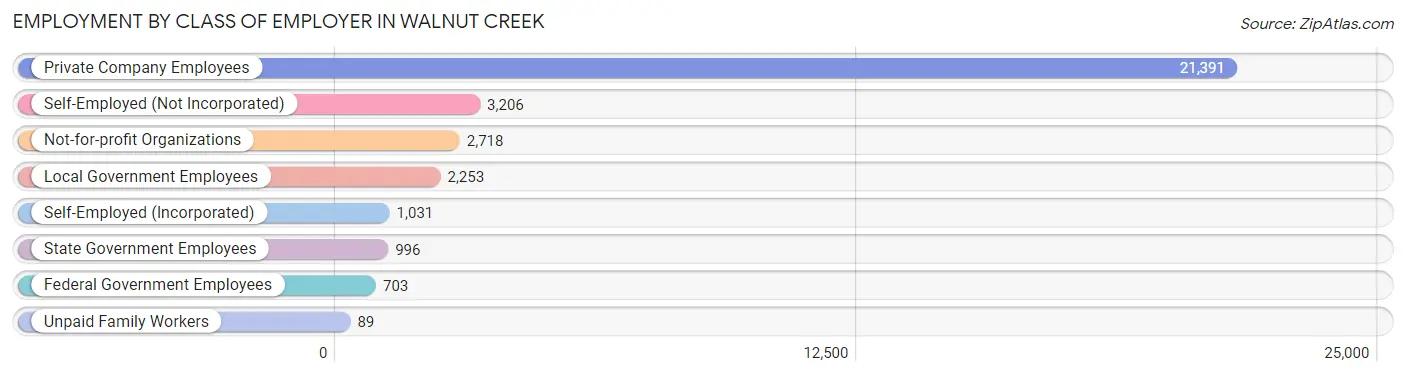
| Employer Class | # Employees | % Employees |
| Private Company Employees | 21,391 | 66.0% |
| Self-Employed (Incorporated) | 1,031 | 3.2% |
| Self-Employed (Not Incorporated) | 3,206 | 9.9% |
| Not-for-profit Organizations | 2,718 | 8.4% |
| Local Government Employees | 2,253 | 7.0% |
| State Government Employees | 996 | 3.1% |
| Federal Government Employees | 703 | 2.2% |
| Unpaid Family Workers | 89 | 0.3% |
| Total | 32,387 | 100.0% |
Employment Status by Age in Walnut Creek
According to the labor force statistics for Walnut Creek, out of the total population over 16 years of age (60,245), 57.8% or 34,822 individuals are in the labor force, with 4.9% or 1,706 of them unemployed. The age group with the highest labor force participation rate is 25 to 29 years, with 90.8% or 4,287 individuals in the labor force. Within the labor force, the 16 to 19 years age range has the highest percentage of unemployed individuals, with 11.8% or 85 of them being unemployed.
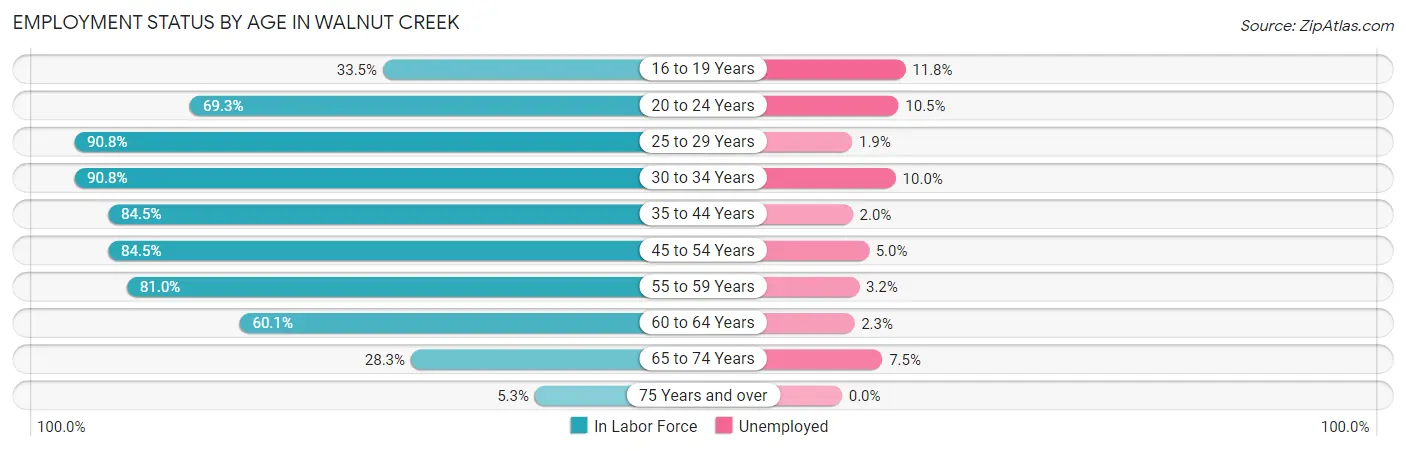
| Age Bracket | In Labor Force | Unemployed |
| 16 to 19 Years | 720 (33.5%) | 85 (11.8%) |
| 20 to 24 Years | 2,218 (69.3%) | 233 (10.5%) |
| 25 to 29 Years | 4,287 (90.8%) | 81 (1.9%) |
| 30 to 34 Years | 4,585 (90.8%) | 458 (10.0%) |
| 35 to 44 Years | 7,230 (84.5%) | 145 (2.0%) |
| 45 to 54 Years | 6,457 (84.5%) | 323 (5.0%) |
| 55 to 59 Years | 3,681 (81.0%) | 118 (3.2%) |
| 60 to 64 Years | 2,366 (60.1%) | 54 (2.3%) |
| 65 to 74 Years | 2,712 (28.3%) | 203 (7.5%) |
| 75 Years and over | 576 (5.3%) | 0 (0.0%) |
| Total | 34,822 (57.8%) | 1,706 (4.9%) |
Employment Status by Educational Attainment in Walnut Creek
According to labor force statistics for Walnut Creek, 83.0% of individuals (28,594) out of the total population between 25 and 64 years of age (34,450) are in the labor force, with 4.1% or 1,172 of them being unemployed. The group with the highest labor force participation rate are those with the educational attainment of bachelor's degree or higher, with 86.4% or 21,702 individuals in the labor force. Within the labor force, individuals with less than high school education have the highest percentage of unemployment, with 11.6% or 58 of them being unemployed.
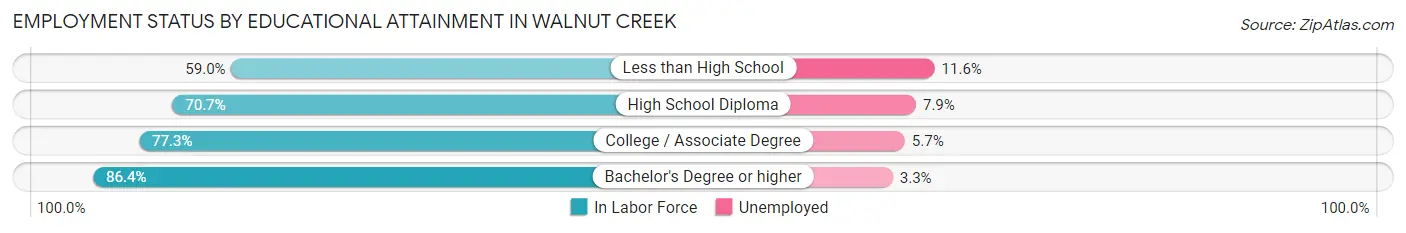
| Educational Attainment | In Labor Force | Unemployed |
| Less than High School | 502 (59.0%) | 99 (11.6%) |
| High School Diploma | 1,622 (70.7%) | 181 (7.9%) |
| College / Associate Degree | 4,783 (77.3%) | 353 (5.7%) |
| Bachelor's Degree or higher | 21,702 (86.4%) | 829 (3.3%) |
| Total | 28,594 (83.0%) | 1,412 (4.1%) |
Employment Occupations by Sex in Walnut Creek
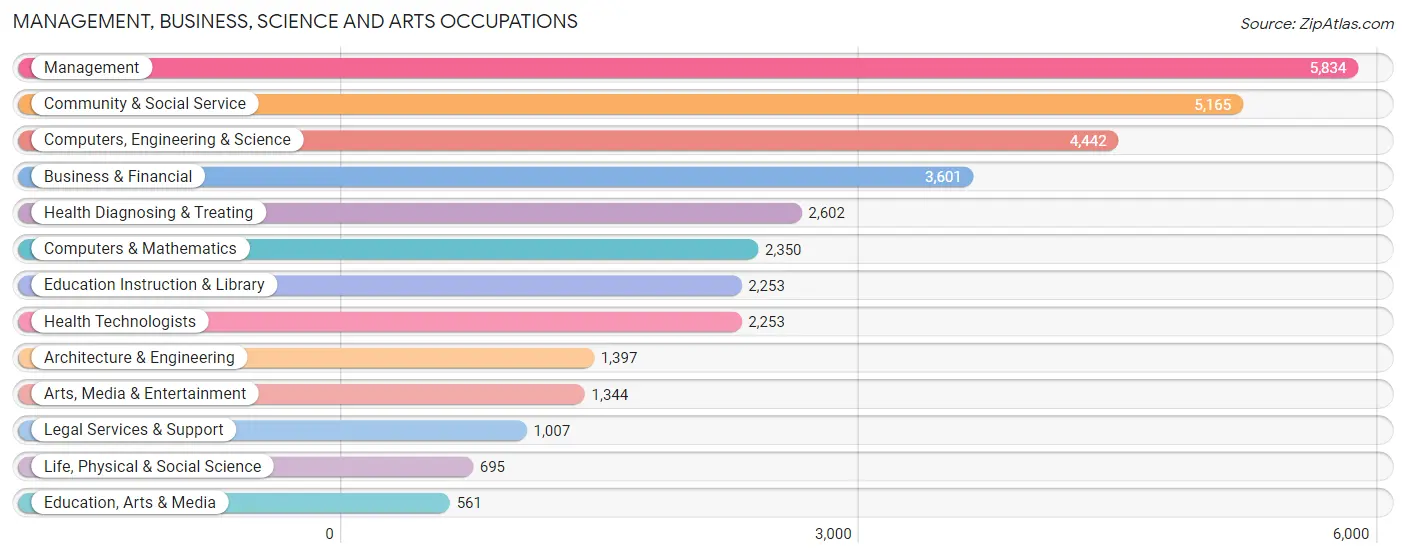
Management, Business, Science and Arts Occupations
The most common Management, Business, Science and Arts occupations in Walnut Creek are Management (5,834 | 17.6%), Community & Social Service (5,165 | 15.6%), Computers, Engineering & Science (4,442 | 13.4%), Business & Financial (3,601 | 10.9%), and Health Diagnosing & Treating (2,602 | 7.9%).
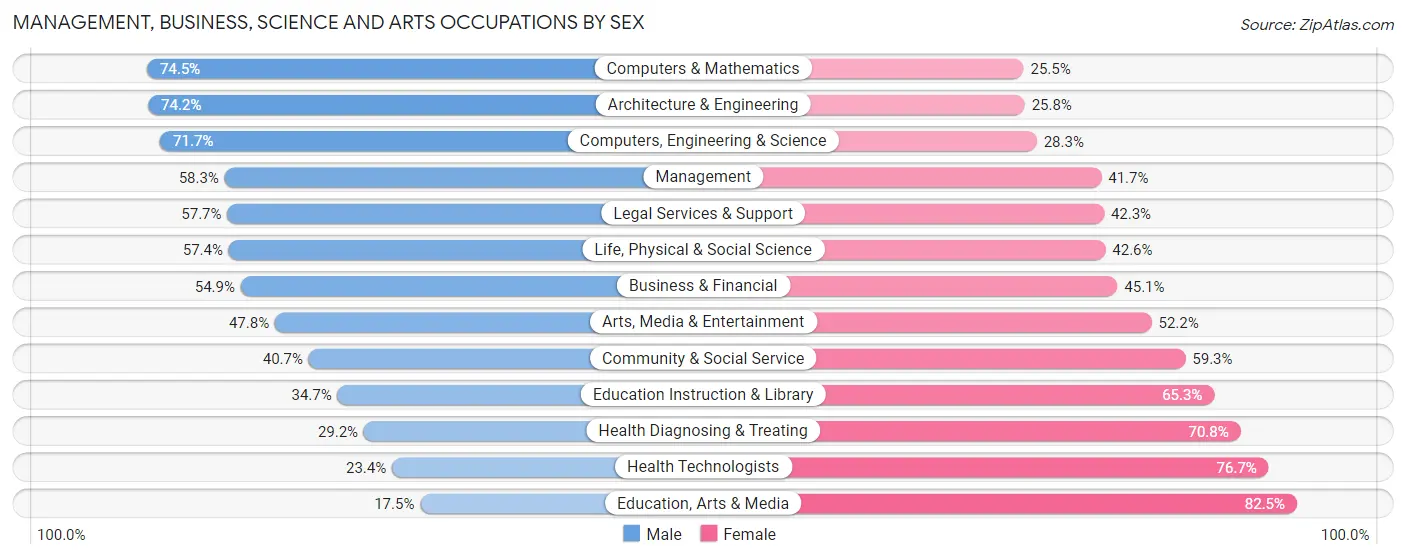
Management, Business, Science and Arts Occupations by Sex
Within the Management, Business, Science and Arts occupations in Walnut Creek, the most male-oriented occupations are Computers & Mathematics (74.5%), Architecture & Engineering (74.2%), and Computers, Engineering & Science (71.7%), while the most female-oriented occupations are Education, Arts & Media (82.5%), Health Technologists (76.6%), and Health Diagnosing & Treating (70.8%).
| Occupation | Male | Female |
| Management | 3,399 (58.3%) | 2,435 (41.7%) |
| Business & Financial | 1,977 (54.9%) | 1,624 (45.1%) |
| Computers, Engineering & Science | 3,186 (71.7%) | 1,256 (28.3%) |
| Computers & Mathematics | 1,750 (74.5%) | 600 (25.5%) |
| Architecture & Engineering | 1,037 (74.2%) | 360 (25.8%) |
| Life, Physical & Social Science | 399 (57.4%) | 296 (42.6%) |
| Community & Social Service | 2,103 (40.7%) | 3,062 (59.3%) |
| Education, Arts & Media | 98 (17.5%) | 463 (82.5%) |
| Legal Services & Support | 581 (57.7%) | 426 (42.3%) |
| Education Instruction & Library | 782 (34.7%) | 1,471 (65.3%) |
| Arts, Media & Entertainment | 642 (47.8%) | 702 (52.2%) |
| Health Diagnosing & Treating | 760 (29.2%) | 1,842 (70.8%) |
| Health Technologists | 526 (23.4%) | 1,727 (76.6%) |
| Total (Category) | 11,425 (52.8%) | 10,219 (47.2%) |
| Total (Overall) | 17,294 (52.3%) | 15,767 (47.7%) |
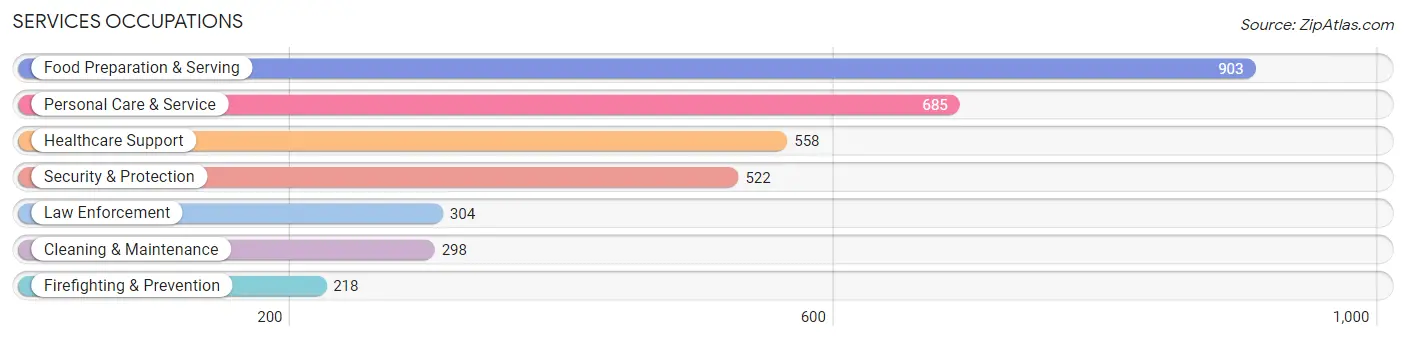
Services Occupations
The most common Services occupations in Walnut Creek are Food Preparation & Serving (903 | 2.7%), Personal Care & Service (685 | 2.1%), Healthcare Support (558 | 1.7%), Security & Protection (522 | 1.6%), and Law Enforcement (304 | 0.9%).
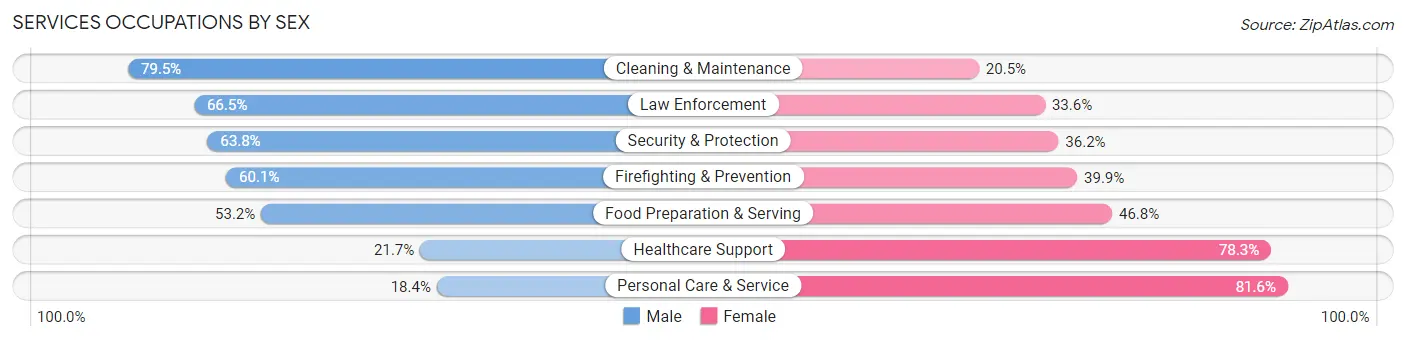
Services Occupations by Sex
Within the Services occupations in Walnut Creek, the most male-oriented occupations are Cleaning & Maintenance (79.5%), Law Enforcement (66.4%), and Security & Protection (63.8%), while the most female-oriented occupations are Personal Care & Service (81.6%), Healthcare Support (78.3%), and Food Preparation & Serving (46.8%).
| Occupation | Male | Female |
| Healthcare Support | 121 (21.7%) | 437 (78.3%) |
| Security & Protection | 333 (63.8%) | 189 (36.2%) |
| Firefighting & Prevention | 131 (60.1%) | 87 (39.9%) |
| Law Enforcement | 202 (66.4%) | 102 (33.6%) |
| Food Preparation & Serving | 480 (53.2%) | 423 (46.8%) |
| Cleaning & Maintenance | 237 (79.5%) | 61 (20.5%) |
| Personal Care & Service | 126 (18.4%) | 559 (81.6%) |
| Total (Category) | 1,297 (43.7%) | 1,669 (56.3%) |
| Total (Overall) | 17,294 (52.3%) | 15,767 (47.7%) |
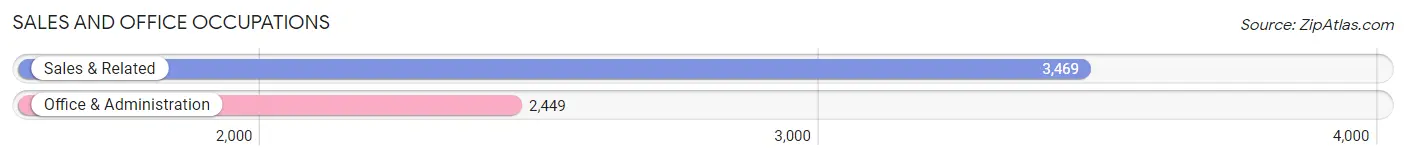
Sales and Office Occupations
The most common Sales and Office occupations in Walnut Creek are Sales & Related (3,469 | 10.5%), and Office & Administration (2,449 | 7.4%).
Sales and Office Occupations by Sex
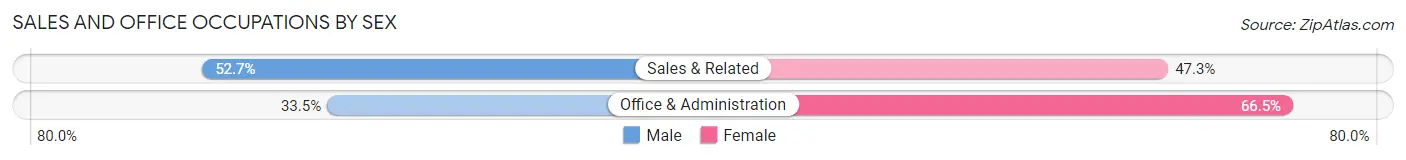
| Occupation | Male | Female |
| Sales & Related | 1,827 (52.7%) | 1,642 (47.3%) |
| Office & Administration | 820 (33.5%) | 1,629 (66.5%) |
| Total (Category) | 2,647 (44.7%) | 3,271 (55.3%) |
| Total (Overall) | 17,294 (52.3%) | 15,767 (47.7%) |
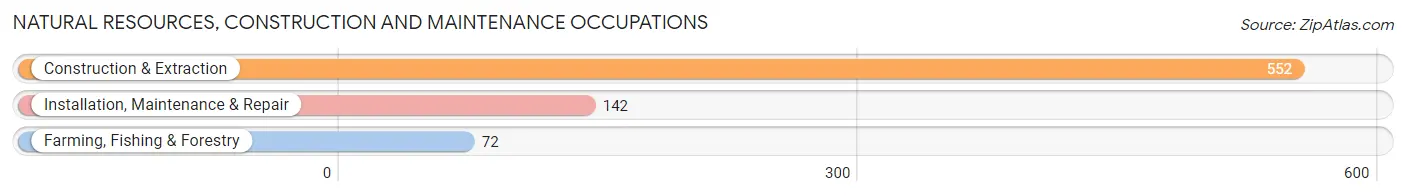
Natural Resources, Construction and Maintenance Occupations
The most common Natural Resources, Construction and Maintenance occupations in Walnut Creek are Construction & Extraction (552 | 1.7%), Installation, Maintenance & Repair (142 | 0.4%), and Farming, Fishing & Forestry (72 | 0.2%).
Natural Resources, Construction and Maintenance Occupations by Sex
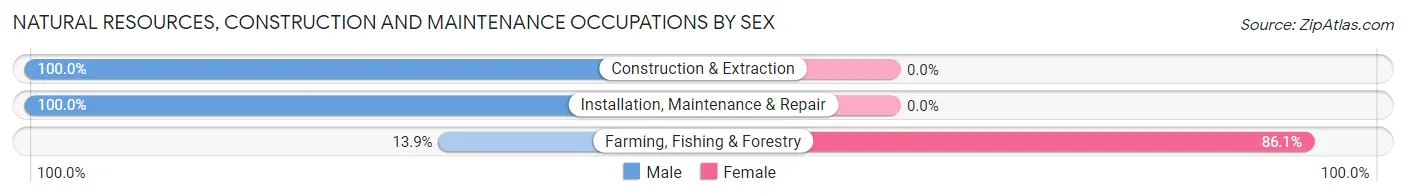
| Occupation | Male | Female |
| Farming, Fishing & Forestry | 10 (13.9%) | 62 (86.1%) |
| Construction & Extraction | 552 (100.0%) | 0 (0.0%) |
| Installation, Maintenance & Repair | 142 (100.0%) | 0 (0.0%) |
| Total (Category) | 704 (91.9%) | 62 (8.1%) |
| Total (Overall) | 17,294 (52.3%) | 15,767 (47.7%) |
Production, Transportation and Moving Occupations
The most common Production, Transportation and Moving occupations in Walnut Creek are Transportation (646 | 1.9%), Production (581 | 1.8%), and Material Moving (540 | 1.6%).
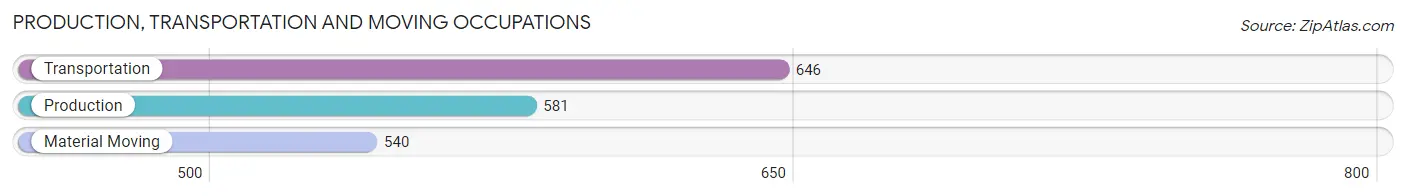
Production, Transportation and Moving Occupations by Sex
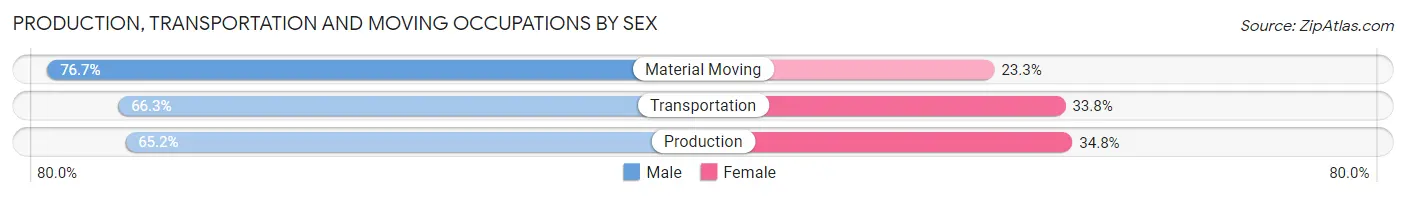
| Occupation | Male | Female |
| Production | 379 (65.2%) | 202 (34.8%) |
| Transportation | 428 (66.2%) | 218 (33.8%) |
| Material Moving | 414 (76.7%) | 126 (23.3%) |
| Total (Category) | 1,221 (69.1%) | 546 (30.9%) |
| Total (Overall) | 17,294 (52.3%) | 15,767 (47.7%) |
Employment Industries by Sex in Walnut Creek
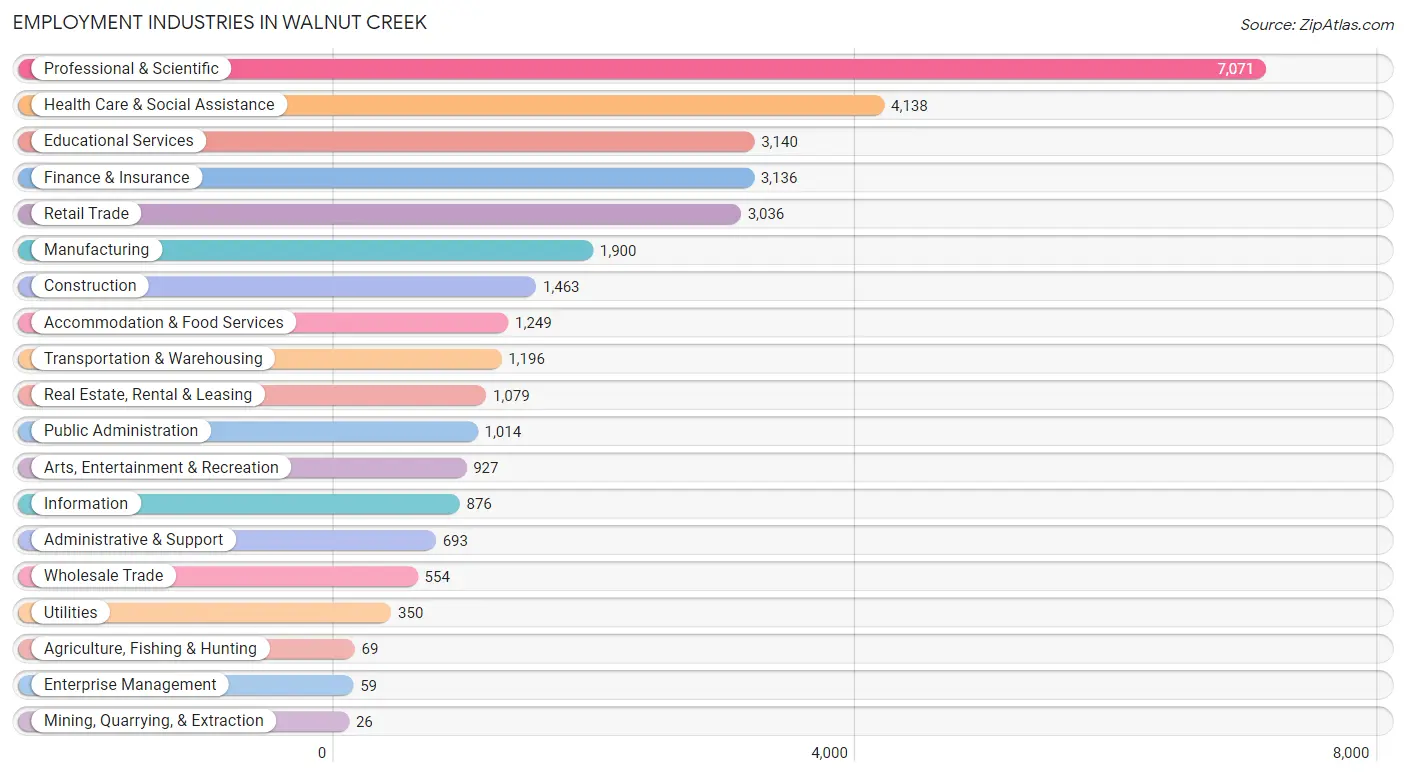
Employment Industries in Walnut Creek
The major employment industries in Walnut Creek include Professional & Scientific (7,071 | 21.4%), Health Care & Social Assistance (4,138 | 12.5%), Educational Services (3,140 | 9.5%), Finance & Insurance (3,136 | 9.5%), and Retail Trade (3,036 | 9.2%).
Employment Industries by Sex in Walnut Creek
The Walnut Creek industries that see more men than women are Agriculture, Fishing & Hunting (92.7%), Construction (83.3%), and Wholesale Trade (79.2%), whereas the industries that tend to have a higher number of women are Mining, Quarrying, & Extraction (100.0%), Health Care & Social Assistance (71.2%), and Enterprise Management (62.7%).
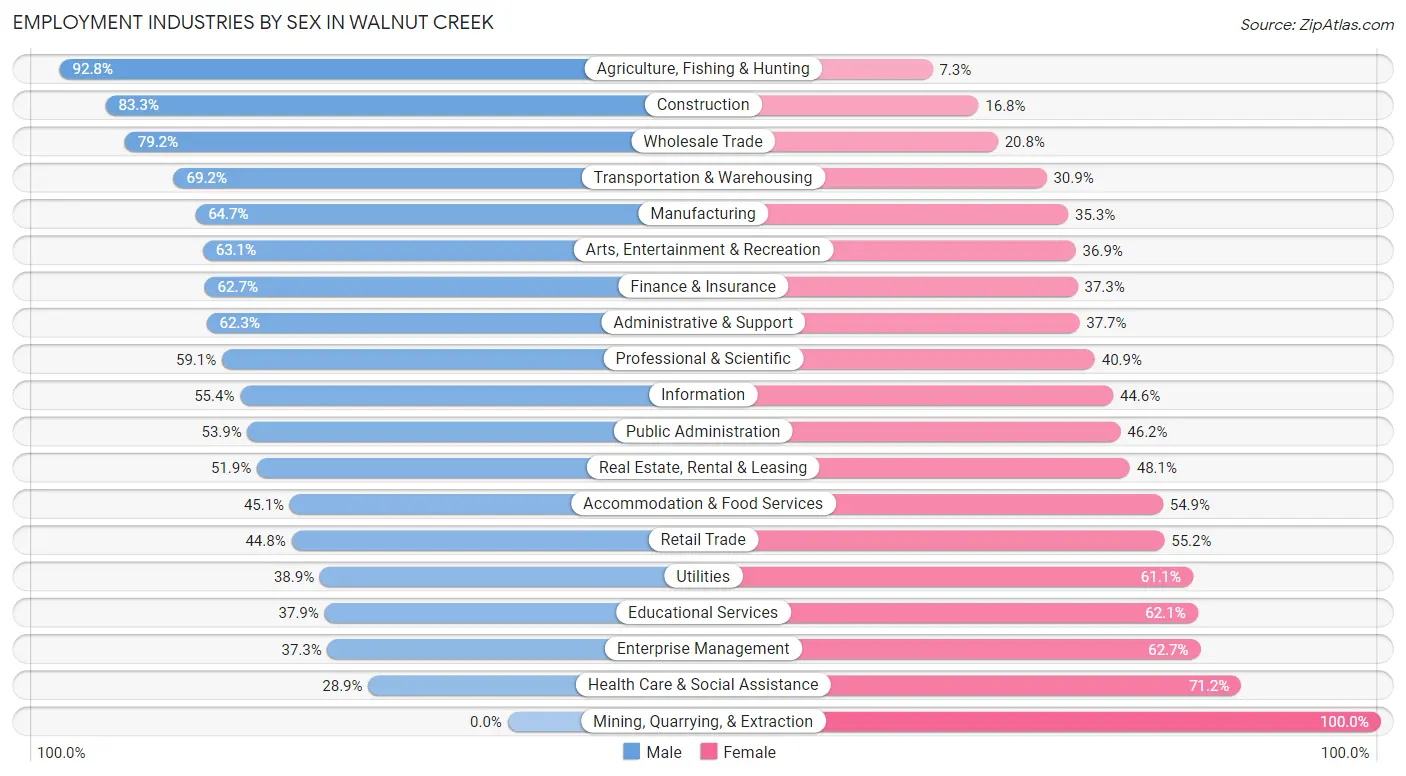
| Industry | Male | Female |
| Agriculture, Fishing & Hunting | 64 (92.7%) | 5 (7.2%) |
| Mining, Quarrying, & Extraction | 0 (0.0%) | 26 (100.0%) |
| Construction | 1,218 (83.3%) | 245 (16.8%) |
| Manufacturing | 1,229 (64.7%) | 671 (35.3%) |
| Wholesale Trade | 439 (79.2%) | 115 (20.8%) |
| Retail Trade | 1,359 (44.8%) | 1,677 (55.2%) |
| Transportation & Warehousing | 827 (69.2%) | 369 (30.8%) |
| Utilities | 136 (38.9%) | 214 (61.1%) |
| Information | 485 (55.4%) | 391 (44.6%) |
| Finance & Insurance | 1,967 (62.7%) | 1,169 (37.3%) |
| Real Estate, Rental & Leasing | 560 (51.9%) | 519 (48.1%) |
| Professional & Scientific | 4,182 (59.1%) | 2,889 (40.9%) |
| Enterprise Management | 22 (37.3%) | 37 (62.7%) |
| Administrative & Support | 432 (62.3%) | 261 (37.7%) |
| Educational Services | 1,190 (37.9%) | 1,950 (62.1%) |
| Health Care & Social Assistance | 1,194 (28.8%) | 2,944 (71.2%) |
| Arts, Entertainment & Recreation | 585 (63.1%) | 342 (36.9%) |
| Accommodation & Food Services | 563 (45.1%) | 686 (54.9%) |
| Public Administration | 546 (53.8%) | 468 (46.2%) |
| Total | 17,294 (52.3%) | 15,767 (47.7%) |
Education in Walnut Creek
School Enrollment in Walnut Creek
The most common levels of schooling among the 11,907 students in Walnut Creek are high school (2,637 | 22.2%), college / undergraduate (2,612 | 21.9%), and elementary school (2,271 | 19.1%).
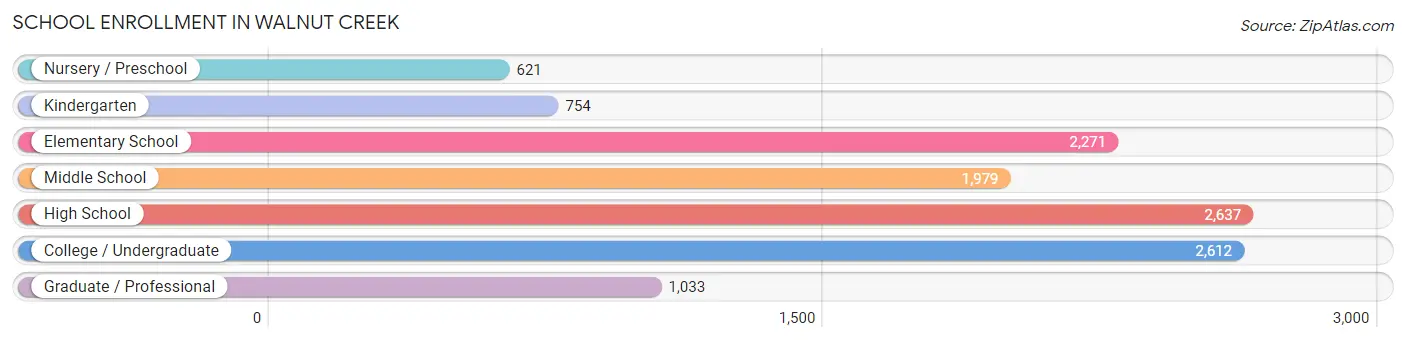
| School Level | # Students | % Students |
| Nursery / Preschool | 621 | 5.2% |
| Kindergarten | 754 | 6.3% |
| Elementary School | 2,271 | 19.1% |
| Middle School | 1,979 | 16.6% |
| High School | 2,637 | 22.2% |
| College / Undergraduate | 2,612 | 21.9% |
| Graduate / Professional | 1,033 | 8.7% |
| Total | 11,907 | 100.0% |
School Enrollment by Age by Funding Source in Walnut Creek
Out of a total of 11,907 students who are enrolled in schools in Walnut Creek, 2,608 (21.9%) attend a private institution, while the remaining 9,299 (78.1%) are enrolled in public schools. The age group of 3 to 4 year olds has the highest likelihood of being enrolled in private schools, with 462 (79.1% in the age bracket) enrolled. Conversely, the age group of 18 to 19 year olds has the lowest likelihood of being enrolled in a private school, with 714 (88.4% in the age bracket) attending a public institution.
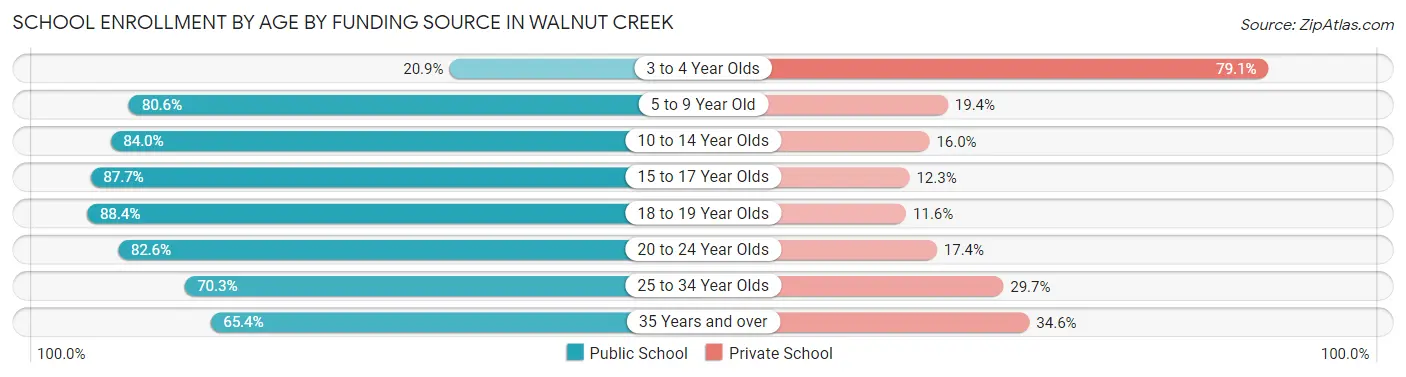
| Age Bracket | Public School | Private School |
| 3 to 4 Year Olds | 122 (20.9%) | 462 (79.1%) |
| 5 to 9 Year Old | 2,391 (80.6%) | 576 (19.4%) |
| 10 to 14 Year Olds | 2,013 (84.0%) | 383 (16.0%) |
| 15 to 17 Year Olds | 1,639 (87.7%) | 229 (12.3%) |
| 18 to 19 Year Olds | 714 (88.4%) | 94 (11.6%) |
| 20 to 24 Year Olds | 1,109 (82.6%) | 233 (17.4%) |
| 25 to 34 Year Olds | 678 (70.3%) | 287 (29.7%) |
| 35 Years and over | 639 (65.4%) | 338 (34.6%) |
| Total | 9,299 (78.1%) | 2,608 (21.9%) |
Educational Attainment by Field of Study in Walnut Creek
Business (7,420 | 18.0%), social sciences (4,727 | 11.5%), engineering (4,289 | 10.4%), science & technology (3,310 | 8.0%), and bio, nature & agricultural (2,864 | 7.0%) are the most common fields of study among 41,173 individuals in Walnut Creek who have obtained a bachelor's degree or higher.
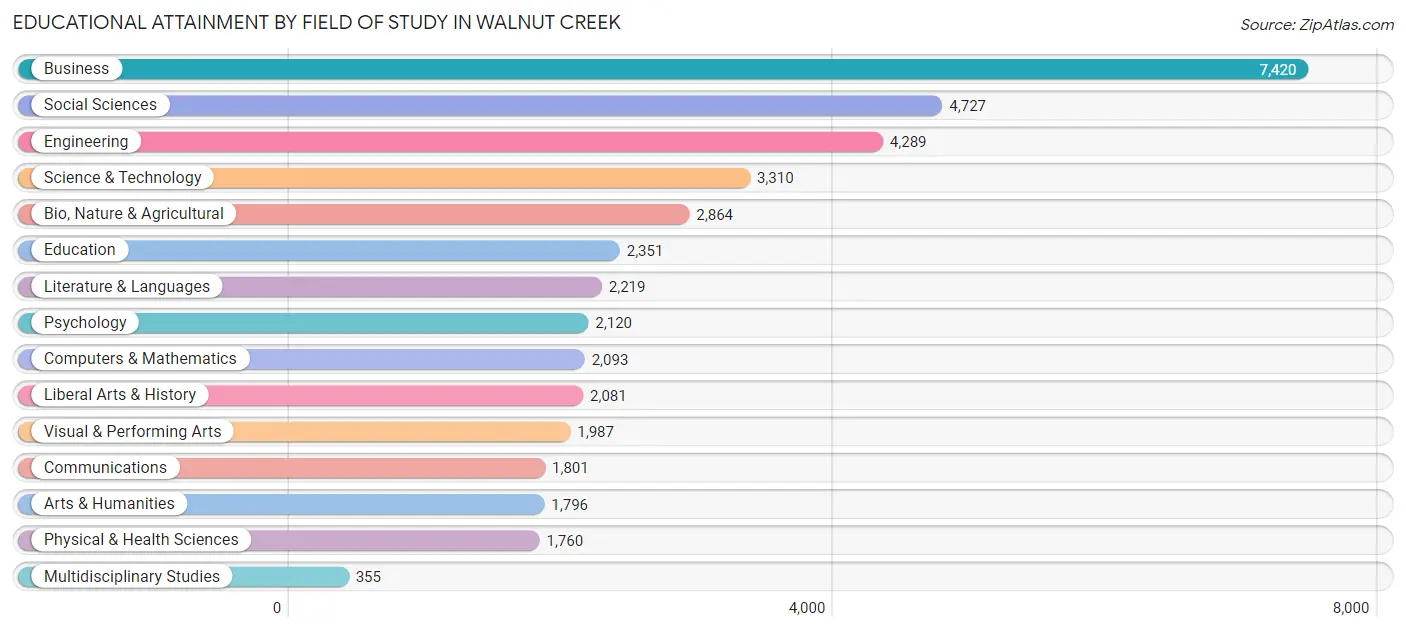
| Field of Study | # Graduates | % Graduates |
| Computers & Mathematics | 2,093 | 5.1% |
| Bio, Nature & Agricultural | 2,864 | 7.0% |
| Physical & Health Sciences | 1,760 | 4.3% |
| Psychology | 2,120 | 5.1% |
| Social Sciences | 4,727 | 11.5% |
| Engineering | 4,289 | 10.4% |
| Multidisciplinary Studies | 355 | 0.9% |
| Science & Technology | 3,310 | 8.0% |
| Business | 7,420 | 18.0% |
| Education | 2,351 | 5.7% |
| Literature & Languages | 2,219 | 5.4% |
| Liberal Arts & History | 2,081 | 5.1% |
| Visual & Performing Arts | 1,987 | 4.8% |
| Communications | 1,801 | 4.4% |
| Arts & Humanities | 1,796 | 4.4% |
| Total | 41,173 | 100.0% |
Transportation & Commute in Walnut Creek
Vehicle Availability by Sex in Walnut Creek
The most prevalent vehicle ownership categories in Walnut Creek are males with 2 vehicles (7,446, accounting for 43.6%) and females with 2 vehicles (6,494, making up 48.7%).
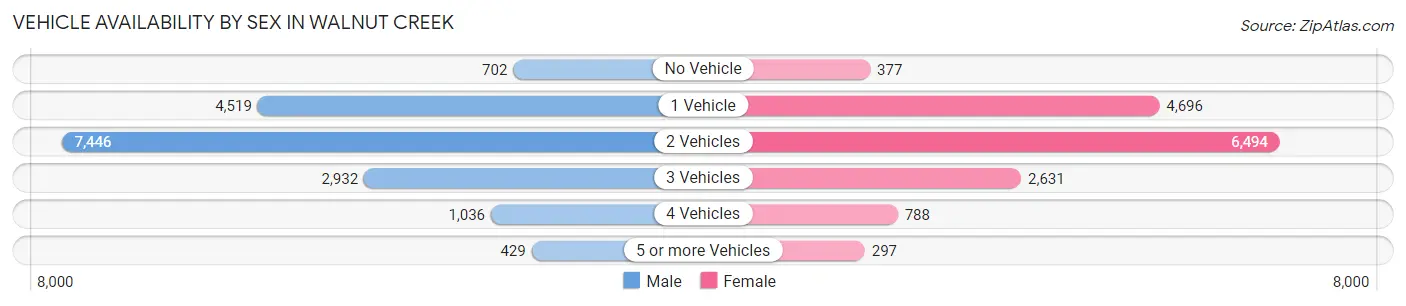
| Vehicles Available | Male | Female |
| No Vehicle | 702 (4.1%) | 377 (2.5%) |
| 1 Vehicle | 4,519 (26.5%) | 4,696 (30.7%) |
| 2 Vehicles | 7,446 (43.6%) | 6,494 (42.5%) |
| 3 Vehicles | 2,932 (17.2%) | 2,631 (17.2%) |
| 4 Vehicles | 1,036 (6.1%) | 788 (5.2%) |
| 5 or more Vehicles | 429 (2.5%) | 297 (1.9%) |
| Total | 17,064 (100.0%) | 15,283 (100.0%) |
Commute Time in Walnut Creek
The most frequently occuring commute durations in Walnut Creek are 15 to 19 minutes (3,658 commuters, 15.1%), 60 to 89 minutes (3,584 commuters, 14.8%), and 10 to 14 minutes (2,939 commuters, 12.1%).
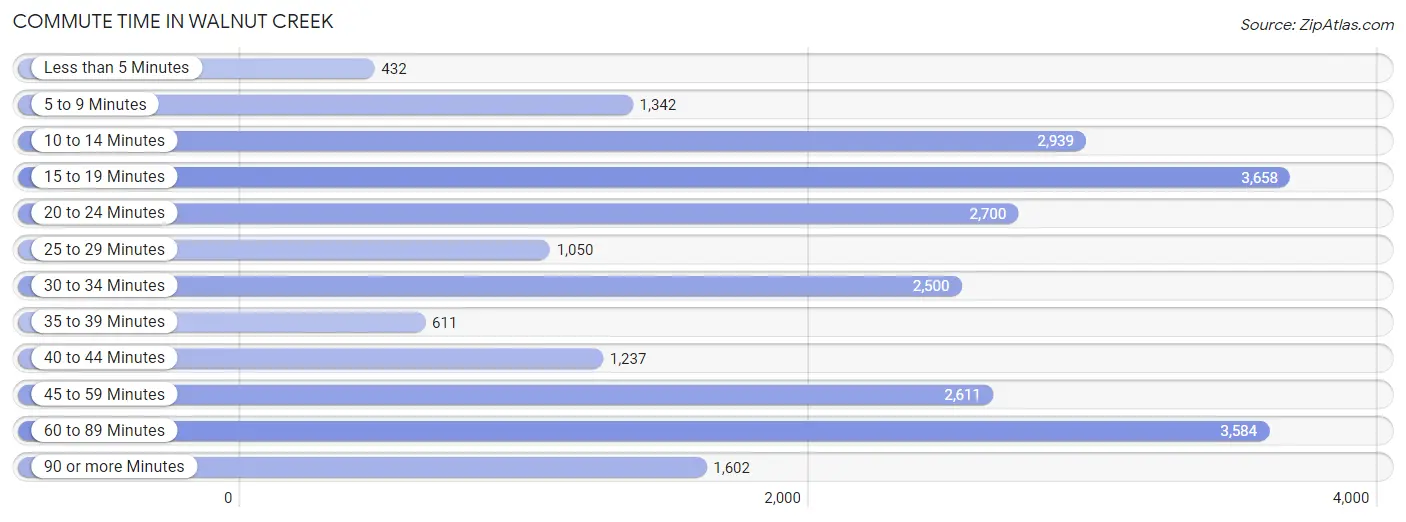
| Commute Time | # Commuters | % Commuters |
| Less than 5 Minutes | 432 | 1.8% |
| 5 to 9 Minutes | 1,342 | 5.5% |
| 10 to 14 Minutes | 2,939 | 12.1% |
| 15 to 19 Minutes | 3,658 | 15.1% |
| 20 to 24 Minutes | 2,700 | 11.1% |
| 25 to 29 Minutes | 1,050 | 4.3% |
| 30 to 34 Minutes | 2,500 | 10.3% |
| 35 to 39 Minutes | 611 | 2.5% |
| 40 to 44 Minutes | 1,237 | 5.1% |
| 45 to 59 Minutes | 2,611 | 10.8% |
| 60 to 89 Minutes | 3,584 | 14.8% |
| 90 or more Minutes | 1,602 | 6.6% |
Commute Time by Sex in Walnut Creek
The most common commute times in Walnut Creek are 60 to 89 minutes (2,119 commuters, 16.7%) for males and 15 to 19 minutes (1,846 commuters, 16.0%) for females.
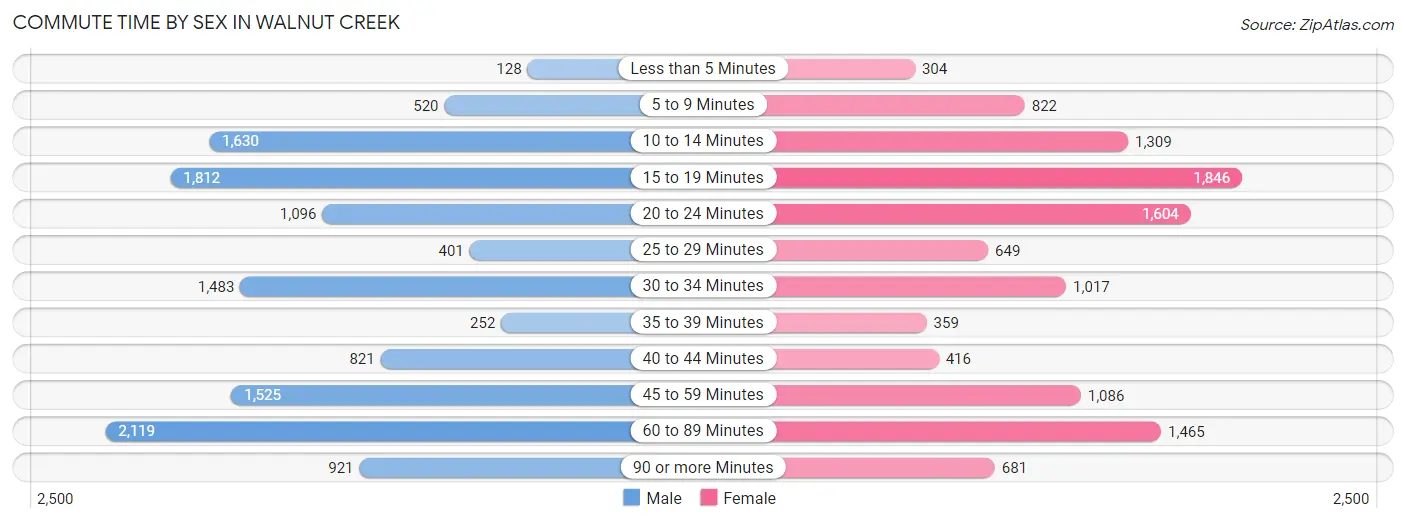
| Commute Time | Male | Female |
| Less than 5 Minutes | 128 (1.0%) | 304 (2.6%) |
| 5 to 9 Minutes | 520 (4.1%) | 822 (7.1%) |
| 10 to 14 Minutes | 1,630 (12.8%) | 1,309 (11.3%) |
| 15 to 19 Minutes | 1,812 (14.3%) | 1,846 (16.0%) |
| 20 to 24 Minutes | 1,096 (8.6%) | 1,604 (13.9%) |
| 25 to 29 Minutes | 401 (3.2%) | 649 (5.6%) |
| 30 to 34 Minutes | 1,483 (11.7%) | 1,017 (8.8%) |
| 35 to 39 Minutes | 252 (2.0%) | 359 (3.1%) |
| 40 to 44 Minutes | 821 (6.5%) | 416 (3.6%) |
| 45 to 59 Minutes | 1,525 (12.0%) | 1,086 (9.4%) |
| 60 to 89 Minutes | 2,119 (16.7%) | 1,465 (12.7%) |
| 90 or more Minutes | 921 (7.2%) | 681 (5.9%) |
Time of Departure to Work by Sex in Walnut Creek
The most frequent times of departure to work in Walnut Creek are 8:00 AM to 8:29 AM (1,986, 15.6%) for males and 8:00 AM to 8:29 AM (2,052, 17.7%) for females.
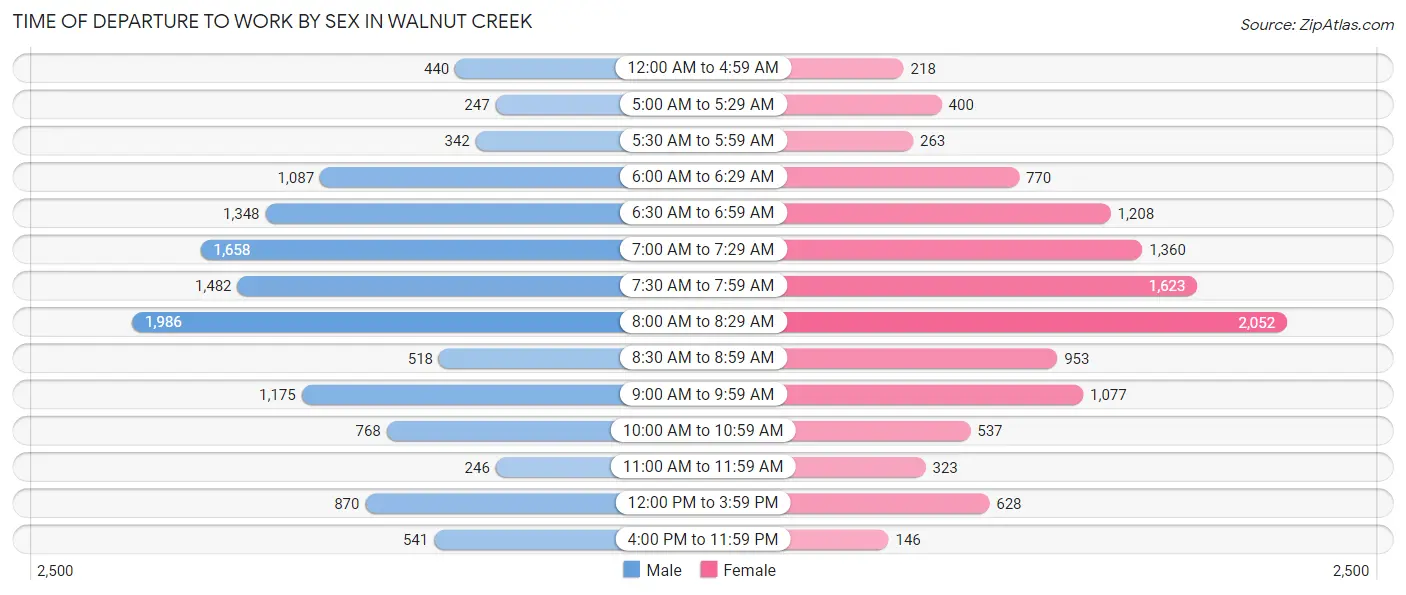
| Time of Departure | Male | Female |
| 12:00 AM to 4:59 AM | 440 (3.5%) | 218 (1.9%) |
| 5:00 AM to 5:29 AM | 247 (1.9%) | 400 (3.5%) |
| 5:30 AM to 5:59 AM | 342 (2.7%) | 263 (2.3%) |
| 6:00 AM to 6:29 AM | 1,087 (8.6%) | 770 (6.7%) |
| 6:30 AM to 6:59 AM | 1,348 (10.6%) | 1,208 (10.4%) |
| 7:00 AM to 7:29 AM | 1,658 (13.1%) | 1,360 (11.8%) |
| 7:30 AM to 7:59 AM | 1,482 (11.7%) | 1,623 (14.0%) |
| 8:00 AM to 8:29 AM | 1,986 (15.6%) | 2,052 (17.7%) |
| 8:30 AM to 8:59 AM | 518 (4.1%) | 953 (8.3%) |
| 9:00 AM to 9:59 AM | 1,175 (9.2%) | 1,077 (9.3%) |
| 10:00 AM to 10:59 AM | 768 (6.0%) | 537 (4.6%) |
| 11:00 AM to 11:59 AM | 246 (1.9%) | 323 (2.8%) |
| 12:00 PM to 3:59 PM | 870 (6.9%) | 628 (5.4%) |
| 4:00 PM to 11:59 PM | 541 (4.3%) | 146 (1.3%) |
| Total | 12,708 (100.0%) | 11,558 (100.0%) |
Housing Occupancy in Walnut Creek
Occupancy by Ownership in Walnut Creek
Of the total 32,205 dwellings in Walnut Creek, owner-occupied units account for 20,763 (64.5%), while renter-occupied units make up 11,442 (35.5%).
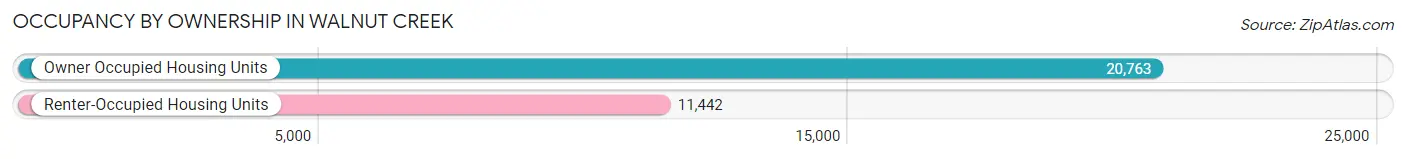
| Occupancy | # Housing Units | % Housing Units |
| Owner Occupied Housing Units | 20,763 | 64.5% |
| Renter-Occupied Housing Units | 11,442 | 35.5% |
| Total Occupied Housing Units | 32,205 | 100.0% |
Occupancy by Household Size in Walnut Creek
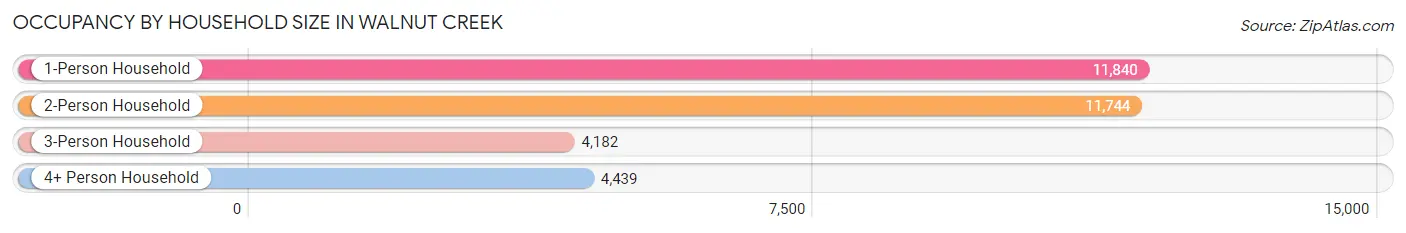
| Household Size | # Housing Units | % Housing Units |
| 1-Person Household | 11,840 | 36.8% |
| 2-Person Household | 11,744 | 36.5% |
| 3-Person Household | 4,182 | 13.0% |
| 4+ Person Household | 4,439 | 13.8% |
| Total Housing Units | 32,205 | 100.0% |
Occupancy by Ownership by Household Size in Walnut Creek
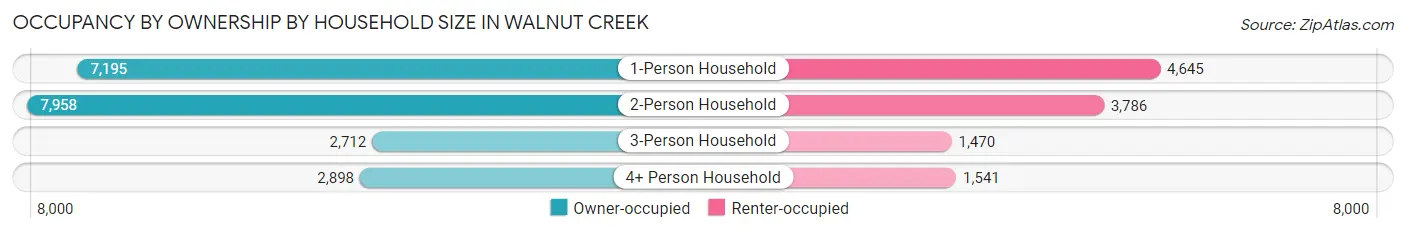
| Household Size | Owner-occupied | Renter-occupied |
| 1-Person Household | 7,195 (60.8%) | 4,645 (39.2%) |
| 2-Person Household | 7,958 (67.8%) | 3,786 (32.2%) |
| 3-Person Household | 2,712 (64.8%) | 1,470 (35.1%) |
| 4+ Person Household | 2,898 (65.3%) | 1,541 (34.7%) |
| Total Housing Units | 20,763 (64.5%) | 11,442 (35.5%) |
Occupancy by Educational Attainment in Walnut Creek
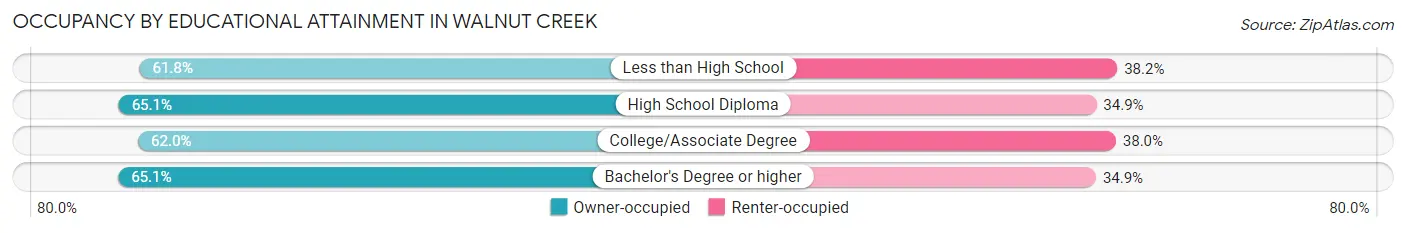
| Household Size | Owner-occupied | Renter-occupied |
| Less than High School | 365 (61.8%) | 226 (38.2%) |
| High School Diploma | 1,382 (65.1%) | 742 (34.9%) |
| College/Associate Degree | 3,801 (62.0%) | 2,332 (38.0%) |
| Bachelor's Degree or higher | 15,215 (65.1%) | 8,142 (34.9%) |
Occupancy by Age of Householder in Walnut Creek
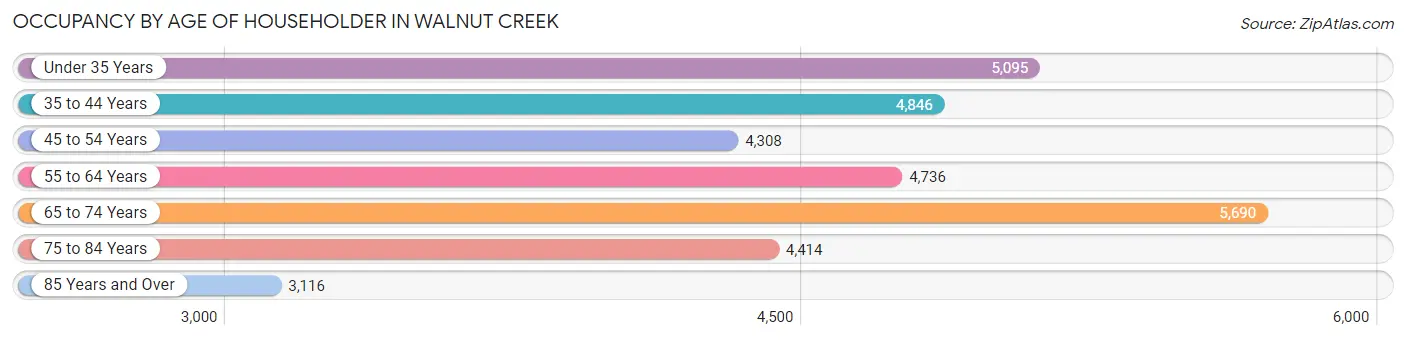
| Age Bracket | # Households | % Households |
| Under 35 Years | 5,095 | 15.8% |
| 35 to 44 Years | 4,846 | 15.0% |
| 45 to 54 Years | 4,308 | 13.4% |
| 55 to 64 Years | 4,736 | 14.7% |
| 65 to 74 Years | 5,690 | 17.7% |
| 75 to 84 Years | 4,414 | 13.7% |
| 85 Years and Over | 3,116 | 9.7% |
| Total | 32,205 | 100.0% |
Housing Finances in Walnut Creek
Median Income by Occupancy in Walnut Creek

| Occupancy Type | # Households | Median Income |
| Owner-Occupied | 20,763 (64.5%) | $146,336 |
| Renter-Occupied | 11,442 (35.5%) | $101,810 |
| Average | 32,205 (100.0%) | $129,971 |
Occupancy by Householder Income Bracket in Walnut Creek
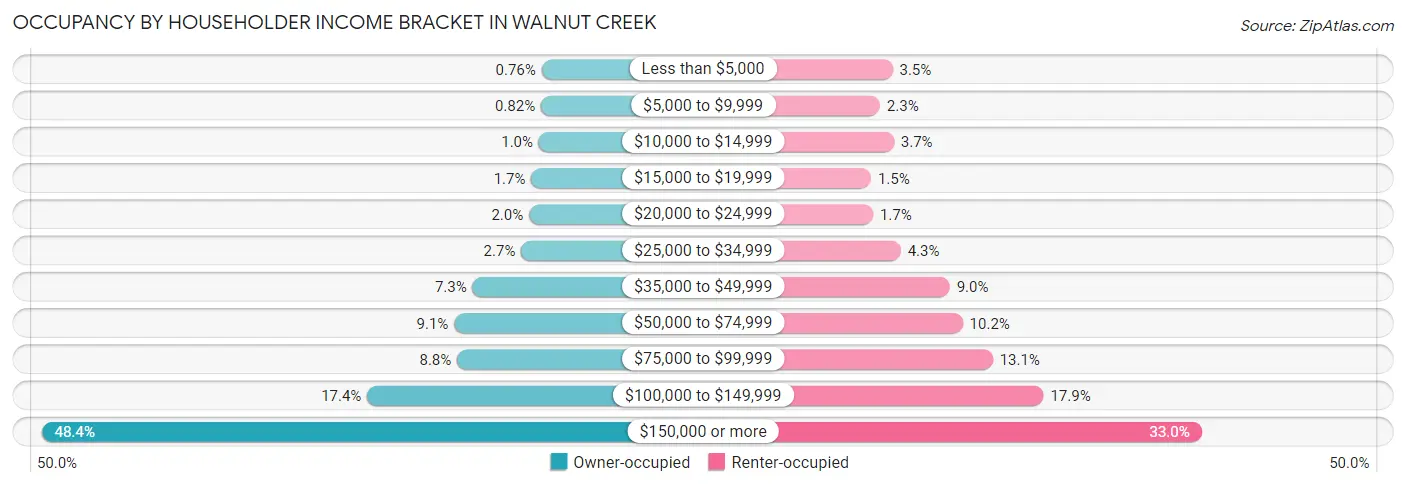
| Income Bracket | Owner-occupied | Renter-occupied |
| Less than $5,000 | 158 (0.8%) | 403 (3.5%) |
| $5,000 to $9,999 | 171 (0.8%) | 266 (2.3%) |
| $10,000 to $14,999 | 212 (1.0%) | 418 (3.6%) |
| $15,000 to $19,999 | 361 (1.7%) | 168 (1.5%) |
| $20,000 to $24,999 | 407 (2.0%) | 190 (1.7%) |
| $25,000 to $34,999 | 560 (2.7%) | 492 (4.3%) |
| $35,000 to $49,999 | 1,524 (7.3%) | 1,026 (9.0%) |
| $50,000 to $74,999 | 1,888 (9.1%) | 1,167 (10.2%) |
| $75,000 to $99,999 | 1,829 (8.8%) | 1,494 (13.1%) |
| $100,000 to $149,999 | 3,607 (17.4%) | 2,048 (17.9%) |
| $150,000 or more | 10,046 (48.4%) | 3,770 (33.0%) |
| Total | 20,763 (100.0%) | 11,442 (100.0%) |
Monthly Housing Cost Tiers in Walnut Creek
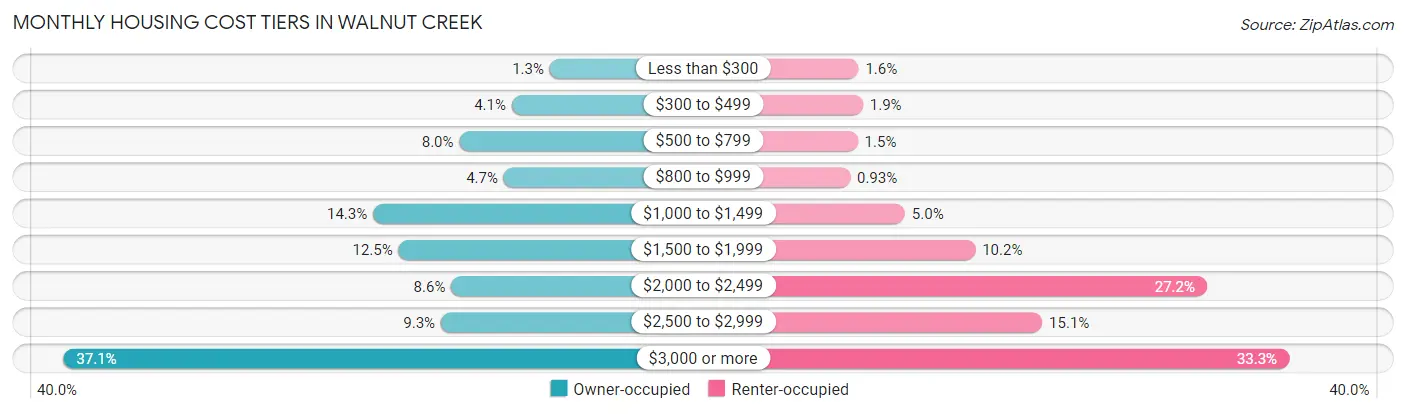
| Monthly Cost | Owner-occupied | Renter-occupied |
| Less than $300 | 275 (1.3%) | 177 (1.5%) |
| $300 to $499 | 856 (4.1%) | 214 (1.9%) |
| $500 to $799 | 1,657 (8.0%) | 170 (1.5%) |
| $800 to $999 | 977 (4.7%) | 106 (0.9%) |
| $1,000 to $1,499 | 2,978 (14.3%) | 569 (5.0%) |
| $1,500 to $1,999 | 2,588 (12.5%) | 1,161 (10.2%) |
| $2,000 to $2,499 | 1,781 (8.6%) | 3,112 (27.2%) |
| $2,500 to $2,999 | 1,939 (9.3%) | 1,725 (15.1%) |
| $3,000 or more | 7,712 (37.1%) | 3,805 (33.3%) |
| Total | 20,763 (100.0%) | 11,442 (100.0%) |
Physical Housing Characteristics in Walnut Creek
Housing Structures in Walnut Creek
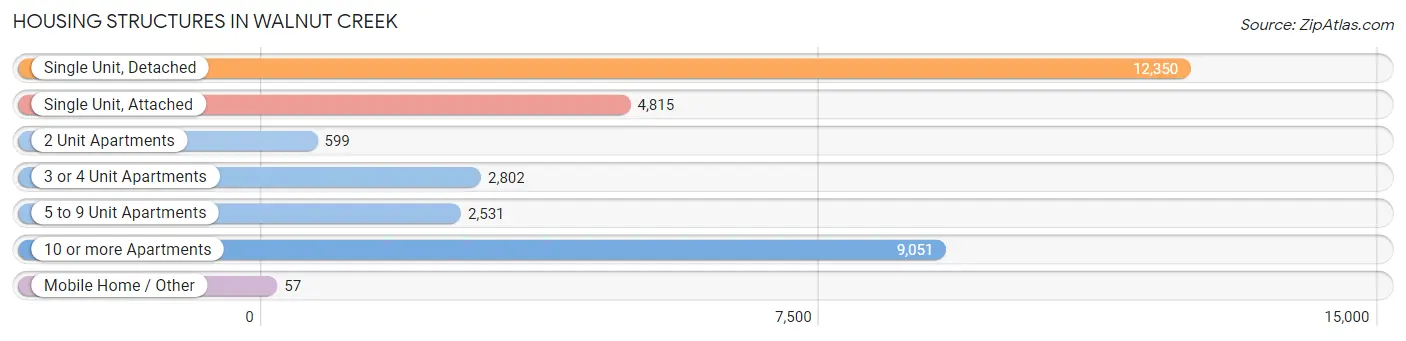
| Structure Type | # Housing Units | % Housing Units |
| Single Unit, Detached | 12,350 | 38.4% |
| Single Unit, Attached | 4,815 | 14.9% |
| 2 Unit Apartments | 599 | 1.9% |
| 3 or 4 Unit Apartments | 2,802 | 8.7% |
| 5 to 9 Unit Apartments | 2,531 | 7.9% |
| 10 or more Apartments | 9,051 | 28.1% |
| Mobile Home / Other | 57 | 0.2% |
| Total | 32,205 | 100.0% |
Housing Structures by Occupancy in Walnut Creek
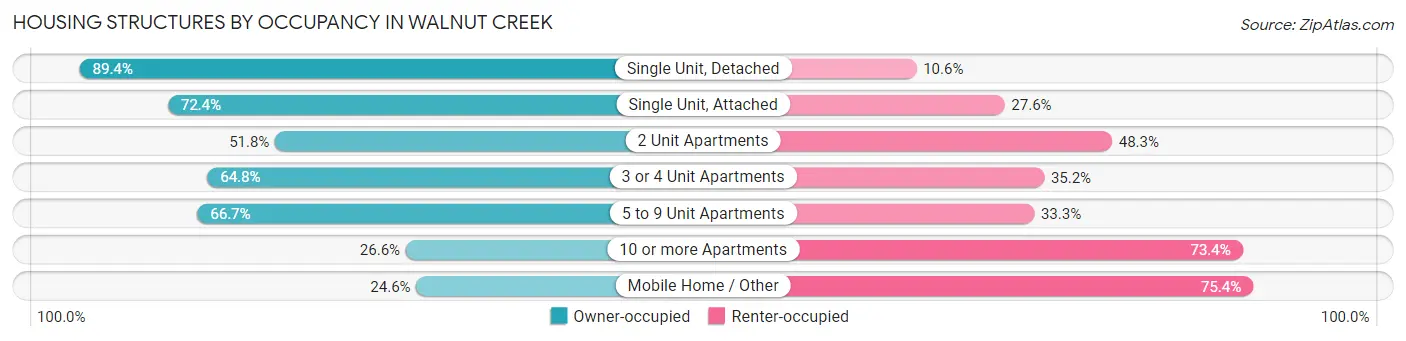
| Structure Type | Owner-occupied | Renter-occupied |
| Single Unit, Detached | 11,041 (89.4%) | 1,309 (10.6%) |
| Single Unit, Attached | 3,487 (72.4%) | 1,328 (27.6%) |
| 2 Unit Apartments | 310 (51.7%) | 289 (48.2%) |
| 3 or 4 Unit Apartments | 1,816 (64.8%) | 986 (35.2%) |
| 5 to 9 Unit Apartments | 1,689 (66.7%) | 842 (33.3%) |
| 10 or more Apartments | 2,406 (26.6%) | 6,645 (73.4%) |
| Mobile Home / Other | 14 (24.6%) | 43 (75.4%) |
| Total | 20,763 (64.5%) | 11,442 (35.5%) |
Housing Structures by Number of Rooms in Walnut Creek
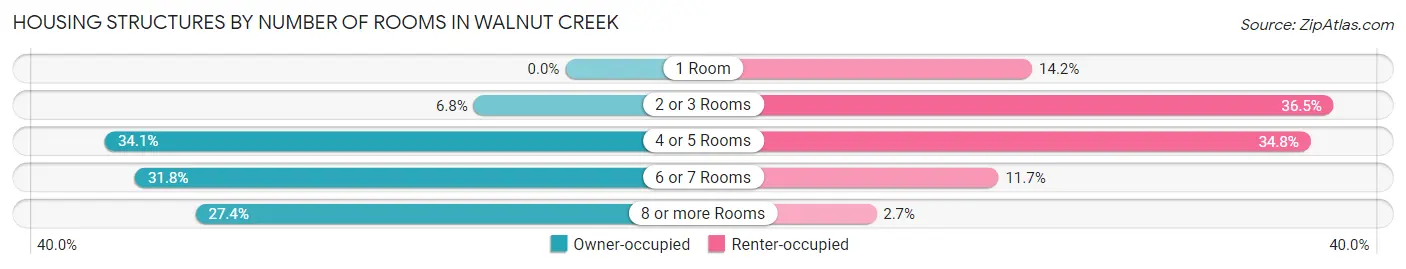
| Number of Rooms | Owner-occupied | Renter-occupied |
| 1 Room | 0 (0.0%) | 1,627 (14.2%) |
| 2 or 3 Rooms | 1,408 (6.8%) | 4,180 (36.5%) |
| 4 or 5 Rooms | 7,070 (34.1%) | 3,985 (34.8%) |
| 6 or 7 Rooms | 6,607 (31.8%) | 1,342 (11.7%) |
| 8 or more Rooms | 5,678 (27.4%) | 308 (2.7%) |
| Total | 20,763 (100.0%) | 11,442 (100.0%) |
Housing Structure by Heating Type in Walnut Creek
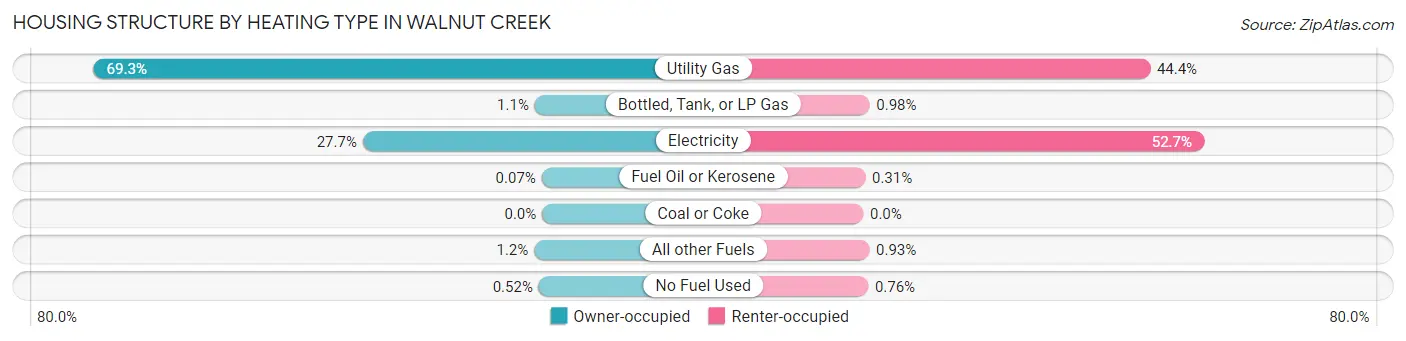
| Heating Type | Owner-occupied | Renter-occupied |
| Utility Gas | 14,392 (69.3%) | 5,075 (44.4%) |
| Bottled, Tank, or LP Gas | 237 (1.1%) | 112 (1.0%) |
| Electricity | 5,758 (27.7%) | 6,027 (52.7%) |
| Fuel Oil or Kerosene | 14 (0.1%) | 35 (0.3%) |
| Coal or Coke | 0 (0.0%) | 0 (0.0%) |
| All other Fuels | 255 (1.2%) | 106 (0.9%) |
| No Fuel Used | 107 (0.5%) | 87 (0.8%) |
| Total | 20,763 (100.0%) | 11,442 (100.0%) |
Household Vehicle Usage in Walnut Creek
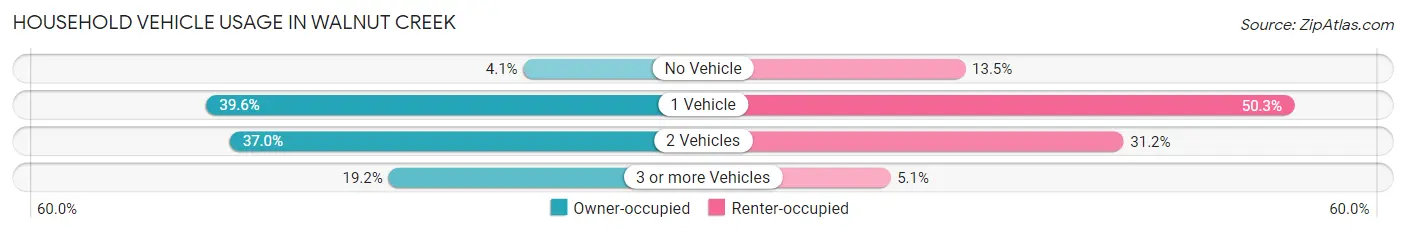
| Vehicles per Household | Owner-occupied | Renter-occupied |
| No Vehicle | 856 (4.1%) | 1,540 (13.5%) |
| 1 Vehicle | 8,229 (39.6%) | 5,753 (50.3%) |
| 2 Vehicles | 7,685 (37.0%) | 3,569 (31.2%) |
| 3 or more Vehicles | 3,993 (19.2%) | 580 (5.1%) |
| Total | 20,763 (100.0%) | 11,442 (100.0%) |
Real Estate & Mortgages in Walnut Creek
Real Estate and Mortgage Overview in Walnut Creek
| Characteristic | Without Mortgage | With Mortgage |
| Housing Units | 8,837 | 11,926 |
| Median Property Value | $861,200 | $1,074,400 |
| Median Household Income | $91,361 | $7,377 |
| Monthly Housing Costs | $1,148 | $7,543 |
| Real Estate Taxes | $4,842 | $156 |
Property Value by Mortgage Status in Walnut Creek
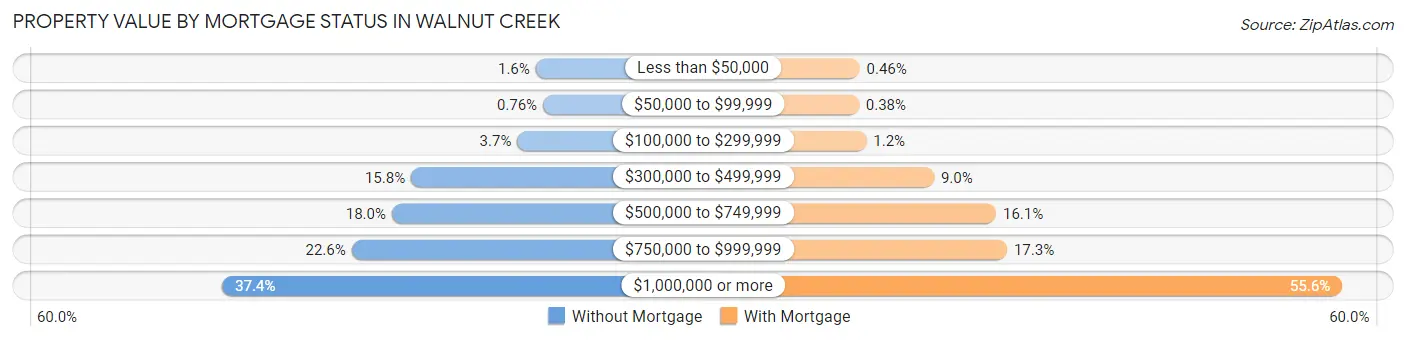
| Property Value | Without Mortgage | With Mortgage |
| Less than $50,000 | 141 (1.6%) | 55 (0.5%) |
| $50,000 to $99,999 | 67 (0.8%) | 45 (0.4%) |
| $100,000 to $299,999 | 327 (3.7%) | 147 (1.2%) |
| $300,000 to $499,999 | 1,400 (15.8%) | 1,068 (9.0%) |
| $500,000 to $749,999 | 1,594 (18.0%) | 1,915 (16.1%) |
| $750,000 to $999,999 | 2,000 (22.6%) | 2,064 (17.3%) |
| $1,000,000 or more | 3,308 (37.4%) | 6,632 (55.6%) |
| Total | 8,837 (100.0%) | 11,926 (100.0%) |
Household Income by Mortgage Status in Walnut Creek
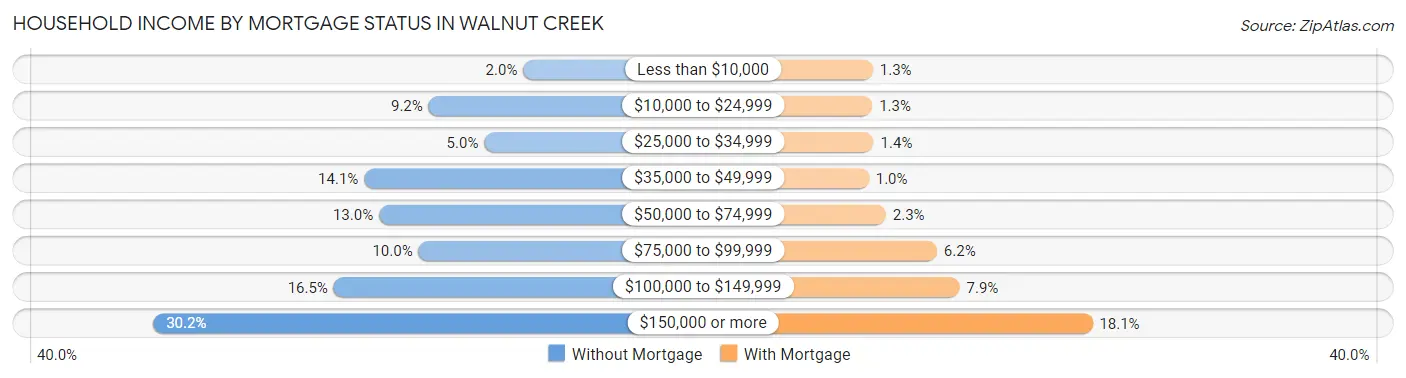
| Household Income | Without Mortgage | With Mortgage |
| Less than $10,000 | 178 (2.0%) | 158 (1.3%) |
| $10,000 to $24,999 | 815 (9.2%) | 151 (1.3%) |
| $25,000 to $34,999 | 440 (5.0%) | 165 (1.4%) |
| $35,000 to $49,999 | 1,249 (14.1%) | 120 (1.0%) |
| $50,000 to $74,999 | 1,149 (13.0%) | 275 (2.3%) |
| $75,000 to $99,999 | 883 (10.0%) | 739 (6.2%) |
| $100,000 to $149,999 | 1,454 (16.5%) | 946 (7.9%) |
| $150,000 or more | 2,669 (30.2%) | 2,153 (18.0%) |
| Total | 8,837 (100.0%) | 11,926 (100.0%) |
Property Value to Household Income Ratio in Walnut Creek
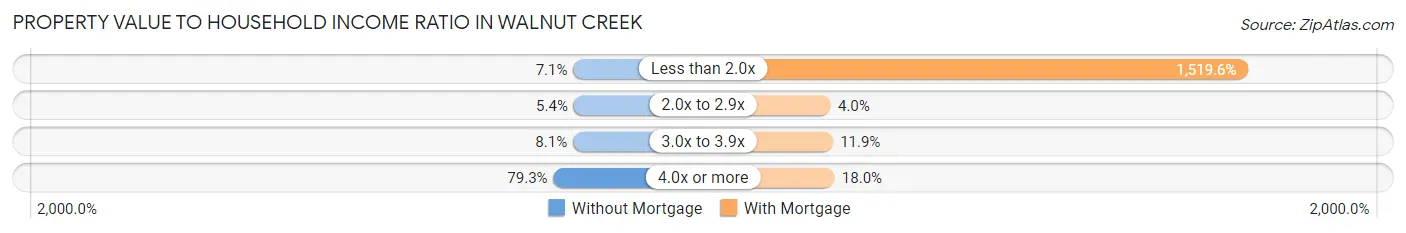
| Value-to-Income Ratio | Without Mortgage | With Mortgage |
| Less than 2.0x | 629 (7.1%) | 181,227 (1,519.6%) |
| 2.0x to 2.9x | 473 (5.3%) | 479 (4.0%) |
| 3.0x to 3.9x | 717 (8.1%) | 1,413 (11.8%) |
| 4.0x or more | 7,005 (79.3%) | 2,150 (18.0%) |
| Total | 8,837 (100.0%) | 11,926 (100.0%) |
Real Estate Taxes by Mortgage Status in Walnut Creek
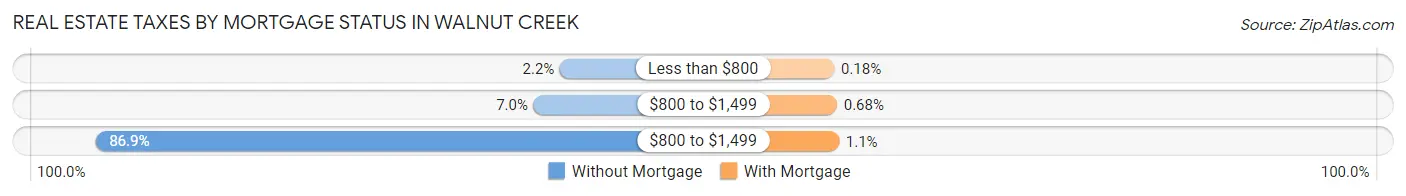
| Property Taxes | Without Mortgage | With Mortgage |
| Less than $800 | 193 (2.2%) | 21 (0.2%) |
| $800 to $1,499 | 619 (7.0%) | 81 (0.7%) |
| $800 to $1,499 | 7,680 (86.9%) | 126 (1.1%) |
| Total | 8,837 (100.0%) | 11,926 (100.0%) |
Health & Disability in Walnut Creek
Health Insurance Coverage by Age in Walnut Creek
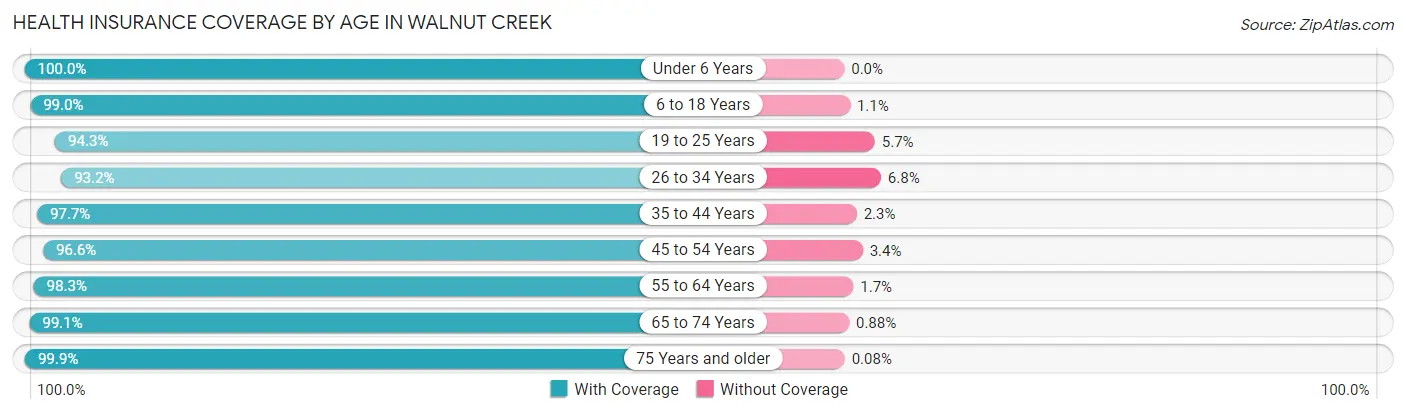
| Age Bracket | With Coverage | Without Coverage |
| Under 6 Years | 3,959 (100.0%) | 0 (0.0%) |
| 6 to 18 Years | 7,237 (99.0%) | 77 (1.1%) |
| 19 to 25 Years | 4,230 (94.3%) | 255 (5.7%) |
| 26 to 34 Years | 8,276 (93.2%) | 607 (6.8%) |
| 35 to 44 Years | 8,272 (97.7%) | 196 (2.3%) |
| 45 to 54 Years | 7,316 (96.6%) | 260 (3.4%) |
| 55 to 64 Years | 8,255 (98.3%) | 142 (1.7%) |
| 65 to 74 Years | 9,263 (99.1%) | 82 (0.9%) |
| 75 Years and older | 10,451 (99.9%) | 8 (0.1%) |
| Total | 67,259 (97.6%) | 1,627 (2.4%) |
Health Insurance Coverage by Citizenship Status in Walnut Creek
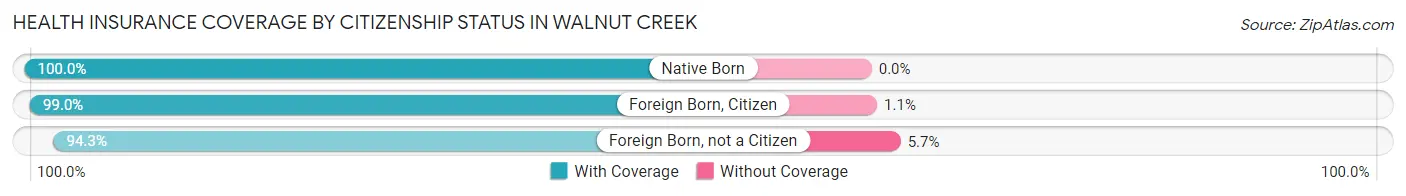
| Citizenship Status | With Coverage | Without Coverage |
| Native Born | 3,959 (100.0%) | 0 (0.0%) |
| Foreign Born, Citizen | 7,237 (99.0%) | 77 (1.1%) |
| Foreign Born, not a Citizen | 4,230 (94.3%) | 255 (5.7%) |
Health Insurance Coverage by Household Income in Walnut Creek
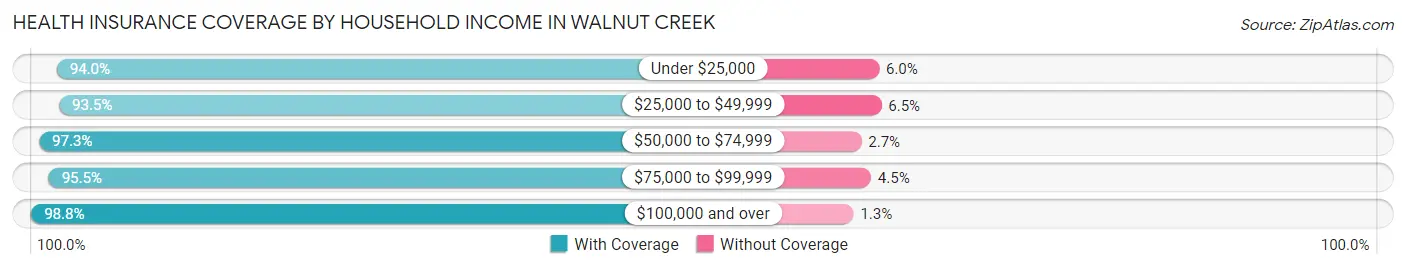
| Household Income | With Coverage | Without Coverage |
| Under $25,000 | 4,106 (94.0%) | 264 (6.0%) |
| $25,000 to $49,999 | 5,222 (93.5%) | 361 (6.5%) |
| $50,000 to $74,999 | 4,966 (97.3%) | 139 (2.7%) |
| $75,000 to $99,999 | 5,195 (95.5%) | 246 (4.5%) |
| $100,000 and over | 47,426 (98.8%) | 602 (1.3%) |
Public vs Private Health Insurance Coverage by Age in Walnut Creek
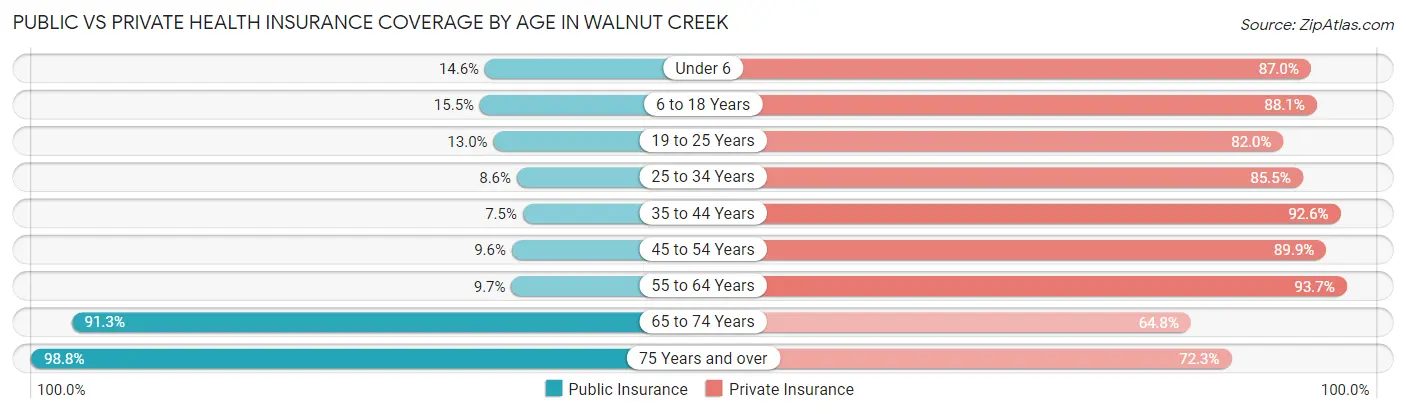
| Age Bracket | Public Insurance | Private Insurance |
| Under 6 | 576 (14.5%) | 3,446 (87.0%) |
| 6 to 18 Years | 1,133 (15.5%) | 6,446 (88.1%) |
| 19 to 25 Years | 582 (13.0%) | 3,676 (82.0%) |
| 25 to 34 Years | 767 (8.6%) | 7,597 (85.5%) |
| 35 to 44 Years | 638 (7.5%) | 7,837 (92.5%) |
| 45 to 54 Years | 724 (9.6%) | 6,811 (89.9%) |
| 55 to 64 Years | 810 (9.7%) | 7,866 (93.7%) |
| 65 to 74 Years | 8,530 (91.3%) | 6,054 (64.8%) |
| 75 Years and over | 10,334 (98.8%) | 7,562 (72.3%) |
| Total | 24,094 (35.0%) | 57,295 (83.2%) |
Disability Status by Sex by Age in Walnut Creek
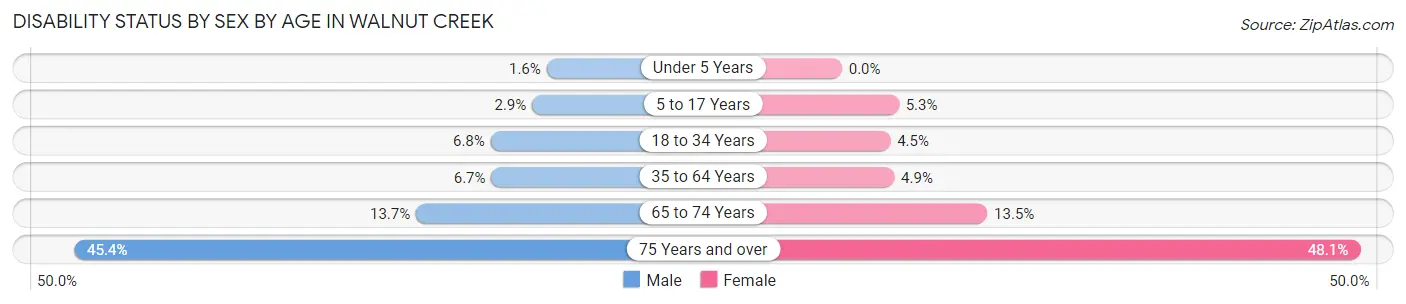
| Age Bracket | Male | Female |
| Under 5 Years | 28 (1.5%) | 0 (0.0%) |
| 5 to 17 Years | 112 (2.9%) | 191 (5.3%) |
| 18 to 34 Years | 469 (6.8%) | 309 (4.5%) |
| 35 to 64 Years | 818 (6.7%) | 593 (4.9%) |
| 65 to 74 Years | 537 (13.7%) | 731 (13.5%) |
| 75 Years and over | 1,856 (45.4%) | 3,064 (48.1%) |
Disability Class by Sex by Age in Walnut Creek
Disability Class: Hearing Difficulty
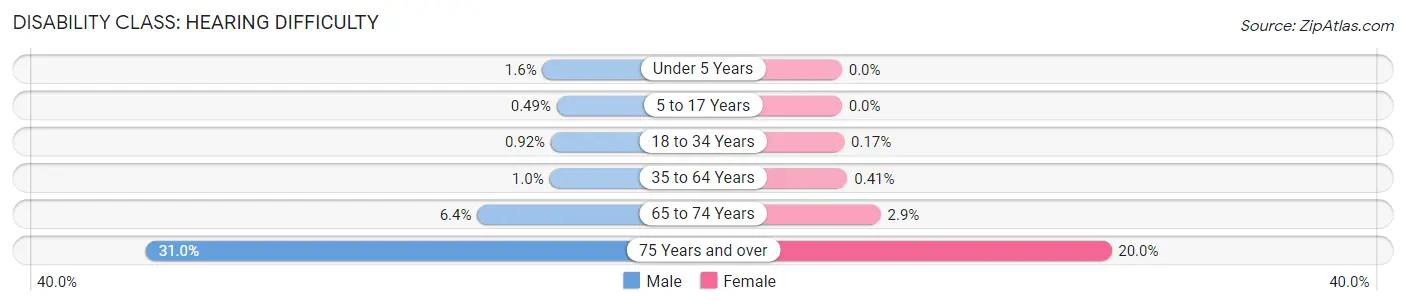
| Age Bracket | Male | Female |
| Under 5 Years | 28 (1.5%) | 0 (0.0%) |
| 5 to 17 Years | 19 (0.5%) | 0 (0.0%) |
| 18 to 34 Years | 64 (0.9%) | 12 (0.2%) |
| 35 to 64 Years | 126 (1.0%) | 50 (0.4%) |
| 65 to 74 Years | 251 (6.4%) | 156 (2.9%) |
| 75 Years and over | 1,267 (31.0%) | 1,275 (20.0%) |
Disability Class: Vision Difficulty
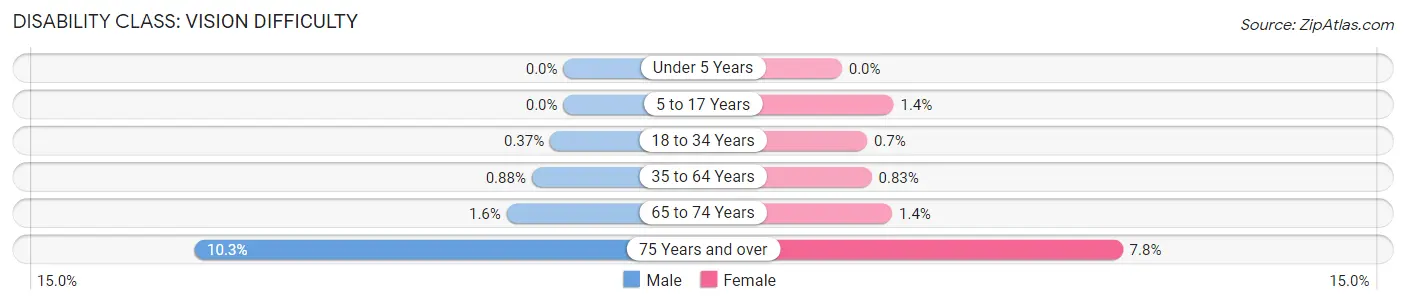
| Age Bracket | Male | Female |
| Under 5 Years | 0 (0.0%) | 0 (0.0%) |
| 5 to 17 Years | 0 (0.0%) | 52 (1.4%) |
| 18 to 34 Years | 26 (0.4%) | 48 (0.7%) |
| 35 to 64 Years | 108 (0.9%) | 101 (0.8%) |
| 65 to 74 Years | 62 (1.6%) | 76 (1.4%) |
| 75 Years and over | 420 (10.3%) | 498 (7.8%) |
Disability Class: Cognitive Difficulty
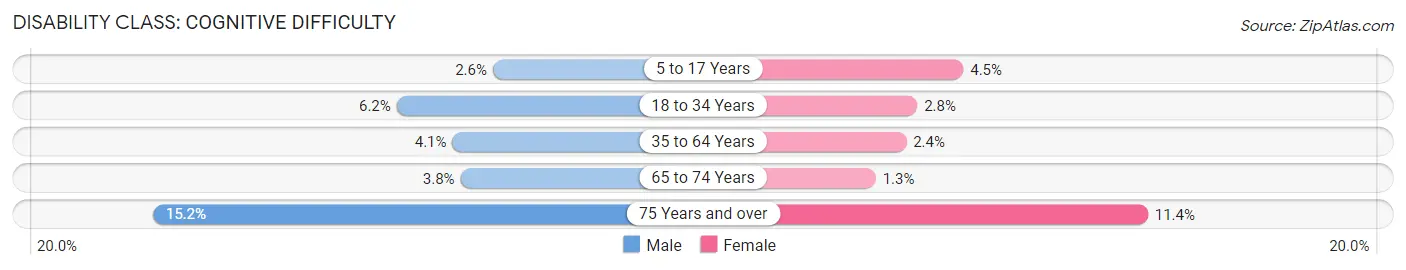
| Age Bracket | Male | Female |
| 5 to 17 Years | 101 (2.6%) | 163 (4.5%) |
| 18 to 34 Years | 430 (6.2%) | 193 (2.8%) |
| 35 to 64 Years | 505 (4.1%) | 291 (2.4%) |
| 65 to 74 Years | 150 (3.8%) | 68 (1.3%) |
| 75 Years and over | 623 (15.2%) | 724 (11.4%) |
Disability Class: Ambulatory Difficulty
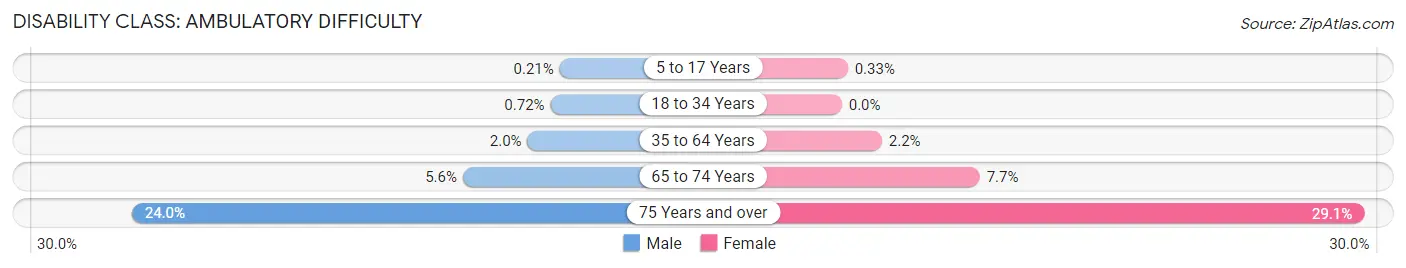
| Age Bracket | Male | Female |
| 5 to 17 Years | 8 (0.2%) | 12 (0.3%) |
| 18 to 34 Years | 50 (0.7%) | 0 (0.0%) |
| 35 to 64 Years | 245 (2.0%) | 272 (2.2%) |
| 65 to 74 Years | 220 (5.6%) | 416 (7.7%) |
| 75 Years and over | 982 (24.0%) | 1,853 (29.1%) |
Disability Class: Self-Care Difficulty
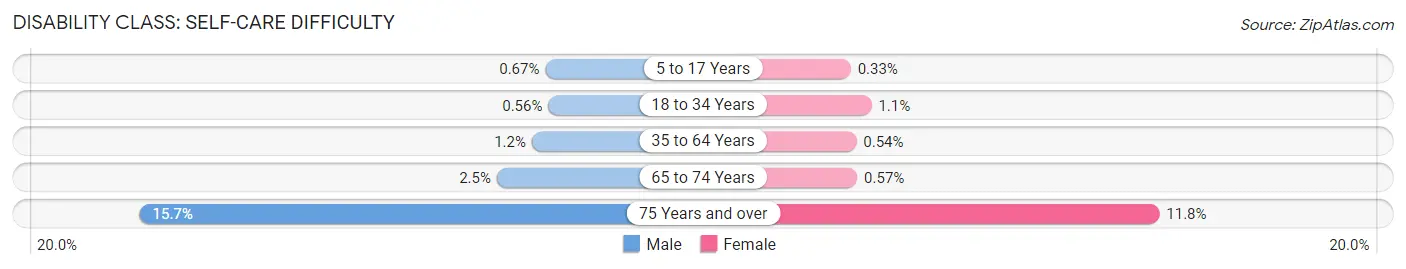
| Age Bracket | Male | Female |
| 5 to 17 Years | 26 (0.7%) | 12 (0.3%) |
| 18 to 34 Years | 39 (0.6%) | 76 (1.1%) |
| 35 to 64 Years | 143 (1.2%) | 66 (0.5%) |
| 65 to 74 Years | 97 (2.5%) | 31 (0.6%) |
| 75 Years and over | 643 (15.7%) | 751 (11.8%) |
Technology Access in Walnut Creek
Computing Device Access in Walnut Creek
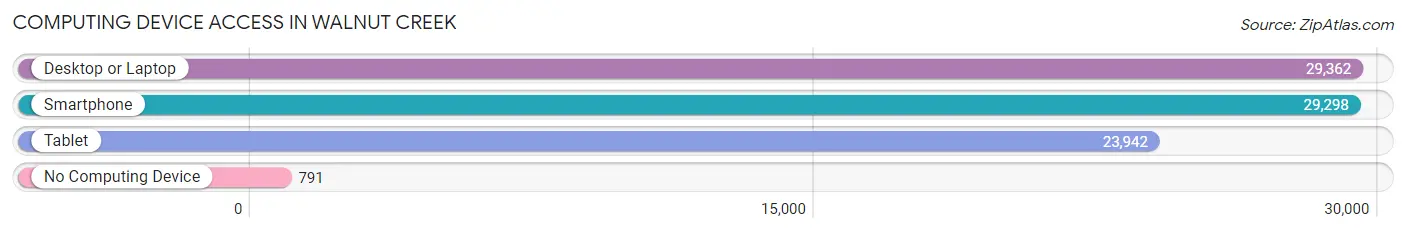
| Device Type | # Households | % Households |
| Desktop or Laptop | 29,362 | 91.2% |
| Smartphone | 29,298 | 91.0% |
| Tablet | 23,942 | 74.3% |
| No Computing Device | 791 | 2.5% |
| Total | 32,205 | 100.0% |
Internet Access in Walnut Creek
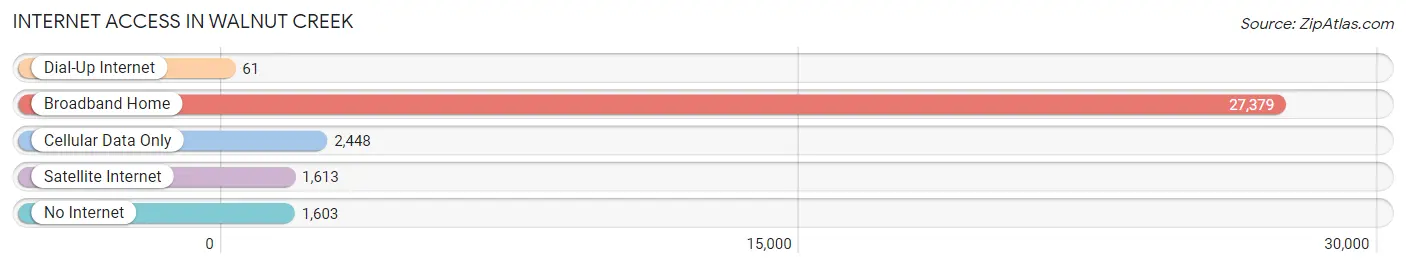
| Internet Type | # Households | % Households |
| Dial-Up Internet | 61 | 0.2% |
| Broadband Home | 27,379 | 85.0% |
| Cellular Data Only | 2,448 | 7.6% |
| Satellite Internet | 1,613 | 5.0% |
| No Internet | 1,603 | 5.0% |
| Total | 32,205 | 100.0% |
Walnut Creek Summary
Walnut Creek, California is a city located in Contra Costa County, in the San Francisco Bay Area. It is situated in the East Bay region of the Bay Area, about 16 miles east of Oakland and 25 miles east of San Francisco. The city is known for its vibrant downtown area, which is home to a variety of shops, restaurants, and entertainment venues.
History
The area that is now Walnut Creek was originally inhabited by the Bay Miwok Native American tribe. The first European settlers arrived in the area in the mid-1800s, and the city was officially incorporated in 1914. The city was named after the large number of walnut trees that grew in the area.
In the early 1900s, the city began to grow rapidly, and by the 1950s, it had become a popular suburban community. The city continued to grow throughout the 20th century, and today it is home to over 70,000 people.
Geography
Walnut Creek is located in the East Bay region of the San Francisco Bay Area. It is situated in the foothills of Mount Diablo, and is bordered by the cities of Concord, Pleasant Hill, and Lafayette. The city covers an area of about 18 square miles, and is located at an elevation of about 500 feet.
The city is home to several parks and open spaces, including Shell Ridge Open Space, Lime Ridge Open Space, and Walnut Creek Open Space. The city is also home to several creeks, including Walnut Creek, which runs through the city.
Economy
Walnut Creek is home to a diverse economy, with a variety of industries represented. The city is home to several corporate headquarters, including Chevron, Safeway, and Kaiser Permanente. The city is also home to several retail and entertainment venues, including Broadway Plaza and the Lesher Center for the Arts.
The city is also home to several educational institutions, including Diablo Valley College and John F. Kennedy University. The city is also home to several medical centers, including John Muir Medical Center and Sutter Health.
Demographics
As of the 2010 census, the population of Walnut Creek was 64,173. The racial makeup of the city was 68.2% White, 11.3% Asian, 8.2% Hispanic or Latino, and 6.2% African American. The median household income was $90,837, and the median age was 42.
Walnut Creek is a diverse city, with a variety of cultures and backgrounds represented. The city is home to a large number of immigrants, with over 20% of the population born outside of the United States. The city is also home to a large number of families, with over 40% of households having children under the age of 18.
Common Questions
What is Per Capita Income in Walnut Creek?
Per Capita income in Walnut Creek is $80,347.
What is the Median Family Income in Walnut Creek?
Median Family Income in Walnut Creek is $167,241.
What is the Median Household income in Walnut Creek?
Median Household Income in Walnut Creek is $129,971.
What is Income or Wage Gap in Walnut Creek?
Income or Wage Gap in Walnut Creek is 25.9%.
Women in Walnut Creek earn 74.1 cents for every dollar earned by a man.
What is Family Income Deficit in Walnut Creek?
Family Income Deficit in Walnut Creek is $13,769.
Families that are below poverty line in Walnut Creek earn $13,769 less on average than the poverty threshold level.
What is Inequality or Gini Index in Walnut Creek?
Inequality or Gini Index in Walnut Creek is 0.46.
What is the Total Population of Walnut Creek?
Total Population of Walnut Creek is 69,809.
What is the Total Male Population of Walnut Creek?
Total Male Population of Walnut Creek is 33,323.
What is the Total Female Population of Walnut Creek?
Total Female Population of Walnut Creek is 36,486.
What is the Ratio of Males per 100 Females in Walnut Creek?
There are 91.33 Males per 100 Females in Walnut Creek.
What is the Ratio of Females per 100 Males in Walnut Creek?
There are 109.49 Females per 100 Males in Walnut Creek.
What is the Median Population Age in Walnut Creek?
Median Population Age in Walnut Creek is 47.2 Years.
What is the Average Family Size in Walnut Creek
Average Family Size in Walnut Creek is 2.8 People.
What is the Average Household Size in Walnut Creek
Average Household Size in Walnut Creek is 2.1 People.
How Large is the Labor Force in Walnut Creek?
There are 34,822 People in the Labor Forcein in Walnut Creek.
What is the Percentage of People in the Labor Force in Walnut Creek?
57.8% of People are in the Labor Force in Walnut Creek.
What is the Unemployment Rate in Walnut Creek?
Unemployment Rate in Walnut Creek is 4.9%.