Cities with the Highest Percentage of Population Employed in Finance & Insurance in Pennsylvania
RELATED REPORTS & OPTIONS
Finance & Insurance
Pennsylvania
Compare Cities
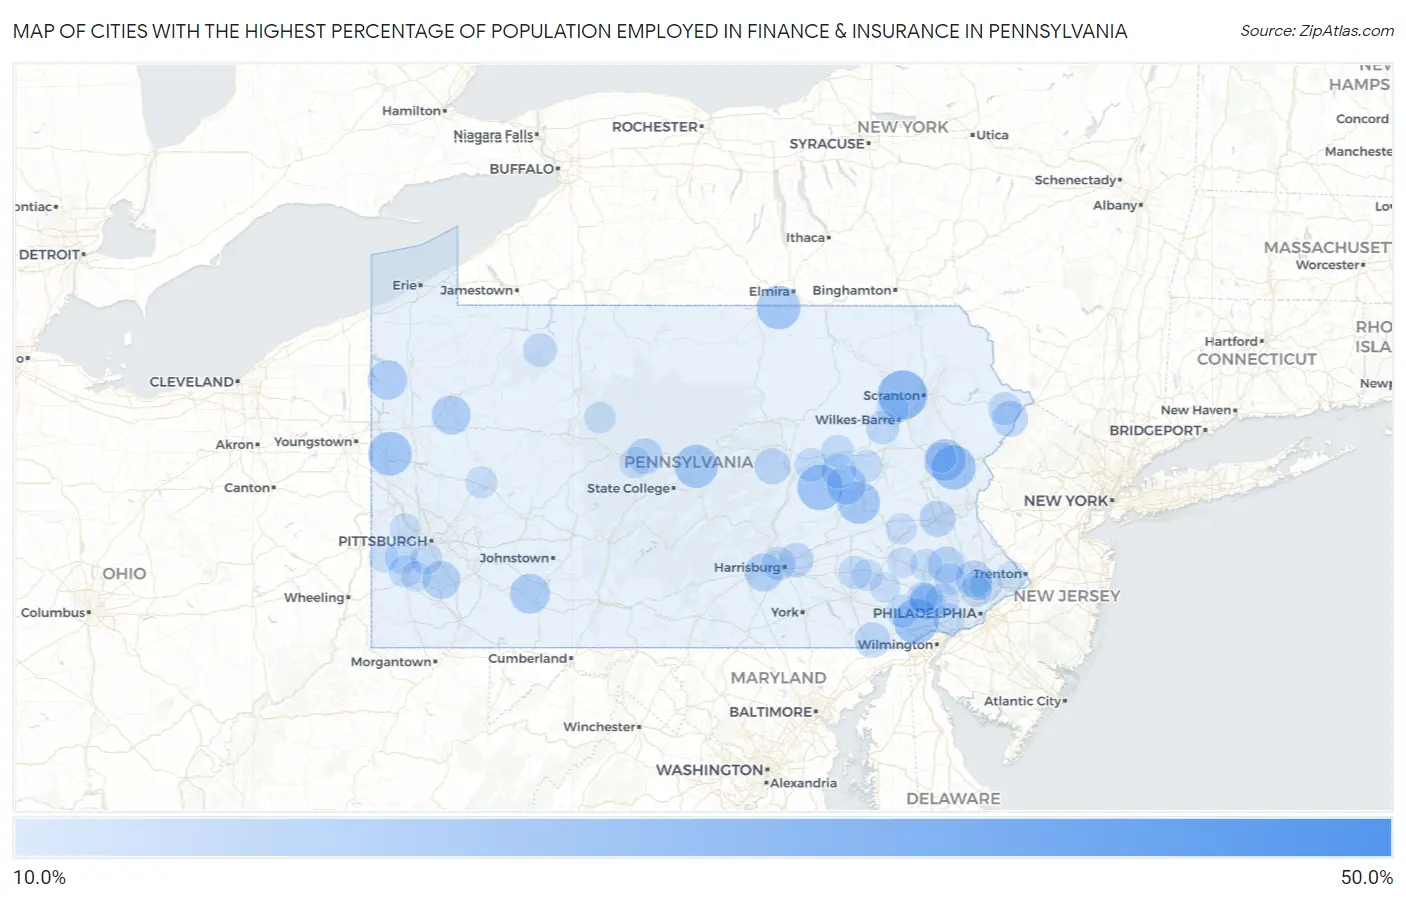
Map of Cities with the Highest Percentage of Population Employed in Finance & Insurance in Pennsylvania
0.0%
50.0%
Cities with the Highest Percentage of Population Employed in Finance & Insurance in Pennsylvania
| City | % Employed | vs State | vs National | |
| 1. | Martinsburg Junction | 50.0% | 5.1%(+44.9)#1 | 4.8%(+45.2)#47 |
| 2. | Fort Fetter | 27.5% | 5.1%(+22.4)#2 | 4.8%(+22.7)#184 |
| 3. | Upper Exeter | 27.3% | 5.1%(+22.2)#3 | 4.8%(+22.6)#185 |
| 4. | Eagles Mere Borough | 27.3% | 5.1%(+22.1)#4 | 4.8%(+22.5)#188 |
| 5. | Tharptown Uniontown | 23.7% | 5.1%(+18.6)#5 | 4.8%(+18.9)#243 |
| 6. | Unionville | 23.5% | 5.1%(+18.4)#6 | 4.8%(+18.7)#248 |
| 7. | St. Davids | 23.5% | 5.1%(+18.3)#7 | 4.8%(+18.7)#249 |
| 8. | New Buffalo Borough | 23.1% | 5.1%(+17.9)#8 | 4.8%(+18.3)#257 |
| 9. | Brodheadsville | 22.6% | 5.1%(+17.5)#9 | 4.8%(+17.8)#271 |
| 10. | New Castle Northwest | 22.1% | 5.1%(+17.0)#10 | 4.8%(+17.3)#285 |
| 11. | Millerton | 22.1% | 5.1%(+16.9)#11 | 4.8%(+17.3)#287 |
| 12. | Mingoville | 21.7% | 5.1%(+16.6)#12 | 4.8%(+17.0)#297 |
| 13. | Seltzer | 21.3% | 5.1%(+16.2)#13 | 4.8%(+16.6)#316 |
| 14. | Sun Valley | 20.5% | 5.1%(+15.4)#14 | 4.8%(+15.7)#344 |
| 15. | Edie | 18.9% | 5.1%(+13.8)#15 | 4.8%(+14.2)#423 |
| 16. | Adamsville | 18.4% | 5.1%(+13.3)#16 | 4.8%(+13.7)#442 |
| 17. | Aristes | 18.3% | 5.1%(+13.2)#17 | 4.8%(+13.5)#449 |
| 18. | Kennerdell | 18.1% | 5.1%(+13.0)#18 | 4.8%(+13.3)#465 |
| 19. | Wheatland Borough | 17.7% | 5.1%(+12.6)#19 | 4.8%(+12.9)#487 |
| 20. | New Kingstown | 17.2% | 5.1%(+12.1)#20 | 4.8%(+12.5)#505 |
| 21. | Wickerham Manor Fisher | 17.1% | 5.1%(+12.0)#21 | 4.8%(+12.4)#511 |
| 22. | Bald Eagle | 17.1% | 5.1%(+11.9)#22 | 4.8%(+12.3)#515 |
| 23. | West Sunbury Borough | 16.7% | 5.1%(+11.5)#23 | 4.8%(+11.9)#540 |
| 24. | Sproul | 16.2% | 5.1%(+11.1)#24 | 4.8%(+11.4)#578 |
| 25. | Spring Mount | 16.2% | 5.1%(+11.1)#25 | 4.8%(+11.4)#579 |
| 26. | Malvern Borough | 16.2% | 5.1%(+11.0)#26 | 4.8%(+11.4)#583 |
| 27. | Spring House | 16.0% | 5.1%(+10.9)#27 | 4.8%(+11.2)#597 |
| 28. | Vicksburg | 15.7% | 5.1%(+10.5)#28 | 4.8%(+10.9)#625 |
| 29. | Cetronia | 15.6% | 5.1%(+10.5)#29 | 4.8%(+10.8)#631 |
| 30. | Birchwood Lakes | 15.3% | 5.1%(+10.2)#30 | 4.8%(+10.6)#665 |
| 31. | Grassflat | 15.3% | 5.1%(+10.2)#31 | 4.8%(+10.5)#666 |
| 32. | Exton | 15.0% | 5.1%(+9.85)#32 | 4.8%(+10.2)#701 |
| 33. | Little Britain | 14.9% | 5.1%(+9.78)#33 | 4.8%(+10.1)#709 |
| 34. | Slabtown | 14.4% | 5.1%(+9.30)#34 | 4.8%(+9.67)#762 |
| 35. | Frazer | 14.4% | 5.1%(+9.25)#35 | 4.8%(+9.61)#768 |
| 36. | Coaldale Borough Bedford County | 14.3% | 5.1%(+9.16)#36 | 4.8%(+9.52)#787 |
| 37. | Sharon Hill Borough | 14.3% | 5.1%(+9.15)#37 | 4.8%(+9.51)#794 |
| 38. | Green Tree Borough | 14.1% | 5.1%(+8.99)#38 | 4.8%(+9.35)#820 |
| 39. | Worthington Borough | 14.1% | 5.1%(+8.97)#39 | 4.8%(+9.34)#823 |
| 40. | Paxtonia | 14.0% | 5.1%(+8.84)#40 | 4.8%(+9.20)#844 |
| 41. | Merion Station | 13.7% | 5.1%(+8.58)#41 | 4.8%(+8.95)#871 |
| 42. | Sheffield | 13.6% | 5.1%(+8.48)#42 | 4.8%(+8.84)#885 |
| 43. | Enola | 13.5% | 5.1%(+8.42)#43 | 4.8%(+8.78)#901 |
| 44. | Sheatown | 13.4% | 5.1%(+8.24)#44 | 4.8%(+8.60)#931 |
| 45. | Gold Key Lake | 13.2% | 5.1%(+8.06)#45 | 4.8%(+8.43)#961 |
| 46. | Paoli | 13.2% | 5.1%(+8.03)#46 | 4.8%(+8.39)#965 |
| 47. | Riverside | 13.0% | 5.1%(+7.91)#47 | 4.8%(+8.28)#987 |
| 48. | Ben Avon Borough | 13.0% | 5.1%(+7.87)#48 | 4.8%(+8.23)#995 |
| 49. | Hopeland | 13.0% | 5.1%(+7.87)#49 | 4.8%(+8.23)#997 |
| 50. | Emsworth Borough | 12.8% | 5.1%(+7.68)#50 | 4.8%(+8.04)#1,031 |
| 51. | Southview | 12.7% | 5.1%(+7.59)#51 | 4.8%(+7.95)#1,050 |
| 52. | Lightstreet | 12.7% | 5.1%(+7.56)#52 | 4.8%(+7.92)#1,055 |
| 53. | Westwood | 12.7% | 5.1%(+7.55)#53 | 4.8%(+7.91)#1,058 |
| 54. | New Hope Borough | 12.6% | 5.1%(+7.49)#54 | 4.8%(+7.85)#1,073 |
| 55. | Shavertown | 12.6% | 5.1%(+7.47)#55 | 4.8%(+7.83)#1,077 |
| 56. | Lionville | 12.5% | 5.1%(+7.38)#56 | 4.8%(+7.75)#1,089 |
| 57. | Willow Grove | 12.4% | 5.1%(+7.23)#57 | 4.8%(+7.60)#1,134 |
| 58. | Halfway House | 12.3% | 5.1%(+7.19)#58 | 4.8%(+7.55)#1,150 |
| 59. | Nuremberg | 12.2% | 5.1%(+7.12)#59 | 4.8%(+7.48)#1,159 |
| 60. | Claysville Borough | 12.2% | 5.1%(+7.11)#60 | 4.8%(+7.47)#1,162 |
| 61. | Mcgovern | 12.2% | 5.1%(+7.02)#61 | 4.8%(+7.38)#1,186 |
| 62. | Avalon Borough | 12.1% | 5.1%(+6.97)#62 | 4.8%(+7.33)#1,203 |
| 63. | Dilworthtown | 12.0% | 5.1%(+6.91)#63 | 4.8%(+7.28)#1,222 |
| 64. | Glenfield Borough | 12.0% | 5.1%(+6.90)#64 | 4.8%(+7.26)#1,224 |
| 65. | Fawn Grove Borough | 12.0% | 5.1%(+6.87)#65 | 4.8%(+7.23)#1,233 |
| 66. | Bethel Park | 11.9% | 5.1%(+6.76)#66 | 4.8%(+7.12)#1,264 |
| 67. | West Hills | 11.8% | 5.1%(+6.68)#67 | 4.8%(+7.04)#1,286 |
| 68. | Flourtown | 11.7% | 5.1%(+6.54)#68 | 4.8%(+6.91)#1,317 |
| 69. | Swedeland | 11.7% | 5.1%(+6.53)#69 | 4.8%(+6.89)#1,324 |
| 70. | Stevens | 11.6% | 5.1%(+6.47)#70 | 4.8%(+6.83)#1,340 |
| 71. | Lima | 11.6% | 5.1%(+6.45)#71 | 4.8%(+6.81)#1,346 |
| 72. | Force | 11.5% | 5.1%(+6.38)#72 | 4.8%(+6.74)#1,363 |
| 73. | Evansburg | 11.5% | 5.1%(+6.36)#73 | 4.8%(+6.72)#1,369 |
| 74. | Eagleview | 11.4% | 5.1%(+6.27)#74 | 4.8%(+6.63)#1,402 |
| 75. | Trappe Borough | 11.4% | 5.1%(+6.25)#75 | 4.8%(+6.61)#1,407 |
| 76. | Allport | 11.3% | 5.1%(+6.20)#76 | 4.8%(+6.56)#1,418 |
| 77. | Elizabethville Borough | 11.3% | 5.1%(+6.19)#77 | 4.8%(+6.55)#1,428 |
| 78. | Virginville | 11.3% | 5.1%(+6.15)#78 | 4.8%(+6.51)#1,438 |
| 79. | Castle Shannon Borough | 11.3% | 5.1%(+6.14)#79 | 4.8%(+6.50)#1,441 |
| 80. | Duboistown Borough | 11.2% | 5.1%(+6.08)#80 | 4.8%(+6.44)#1,461 |
| 81. | Jersey Shore Borough | 11.1% | 5.1%(+5.99)#81 | 4.8%(+6.35)#1,485 |
| 82. | Carnot Moon | 10.9% | 5.1%(+5.81)#82 | 4.8%(+6.18)#1,549 |
| 83. | Indian Mountain Lake | 10.9% | 5.1%(+5.73)#83 | 4.8%(+6.09)#1,584 |
| 84. | Crafton Borough | 10.8% | 5.1%(+5.69)#84 | 4.8%(+6.05)#1,593 |
| 85. | Sewickley Heights Borough | 10.8% | 5.1%(+5.66)#85 | 4.8%(+6.02)#1,602 |
| 86. | Lorane | 10.7% | 5.1%(+5.60)#86 | 4.8%(+5.96)#1,625 |
| 87. | Carnegie Borough | 10.7% | 5.1%(+5.60)#87 | 4.8%(+5.96)#1,627 |
| 88. | Goodville | 10.7% | 5.1%(+5.54)#88 | 4.8%(+5.90)#1,647 |
| 89. | Wylandville | 10.7% | 5.1%(+5.52)#89 | 4.8%(+5.89)#1,651 |
| 90. | Wayne | 10.6% | 5.1%(+5.52)#90 | 4.8%(+5.88)#1,652 |
| 91. | Fort Washington | 10.6% | 5.1%(+5.46)#91 | 4.8%(+5.83)#1,668 |
| 92. | Munhall Borough | 10.5% | 5.1%(+5.32)#92 | 4.8%(+5.69)#1,720 |
| 93. | Cross Creek | 10.4% | 5.1%(+5.31)#93 | 4.8%(+5.67)#1,726 |
| 94. | Swarthmore Borough | 10.4% | 5.1%(+5.28)#94 | 4.8%(+5.64)#1,735 |
| 95. | Phoenixville Borough | 10.3% | 5.1%(+5.21)#95 | 4.8%(+5.57)#1,765 |
| 96. | Indian Lake Borough | 10.2% | 5.1%(+5.10)#96 | 4.8%(+5.46)#1,805 |
| 97. | Woodbourne | 10.2% | 5.1%(+5.09)#97 | 4.8%(+5.45)#1,811 |
| 98. | Collegeville Borough | 10.2% | 5.1%(+5.08)#98 | 4.8%(+5.44)#1,814 |
| 99. | Brentwood Borough | 10.2% | 5.1%(+5.08)#99 | 4.8%(+5.44)#1,817 |
| 100. | Glenmoore | 10.2% | 5.1%(+5.05)#100 | 4.8%(+5.41)#1,831 |
Common Questions
What are the Top 10 Cities with the Highest Percentage of Population Employed in Finance & Insurance in Pennsylvania?
Top 10 Cities with the Highest Percentage of Population Employed in Finance & Insurance in Pennsylvania are:
#1
27.3%
#2
23.7%
#3
23.5%
#4
22.6%
#5
22.1%
#6
22.1%
#7
21.7%
#8
21.3%
#9
20.5%
#10
18.9%
What city has the Highest Percentage of Population Employed in Finance & Insurance in Pennsylvania?
Upper Exeter has the Highest Percentage of Population Employed in Finance & Insurance in Pennsylvania with 27.3%.
What is the Percentage of Population Employed in Finance & Insurance in the State of Pennsylvania?
Percentage of Population Employed in Finance & Insurance in Pennsylvania is 5.1%.
What is the Percentage of Population Employed in Finance & Insurance in the United States?
Percentage of Population Employed in Finance & Insurance in the United States is 4.8%.