Cities with the Highest Percentage of Population Employed in Finance & Insurance in Maryland
RELATED REPORTS & OPTIONS
Finance & Insurance
Maryland
Compare Cities
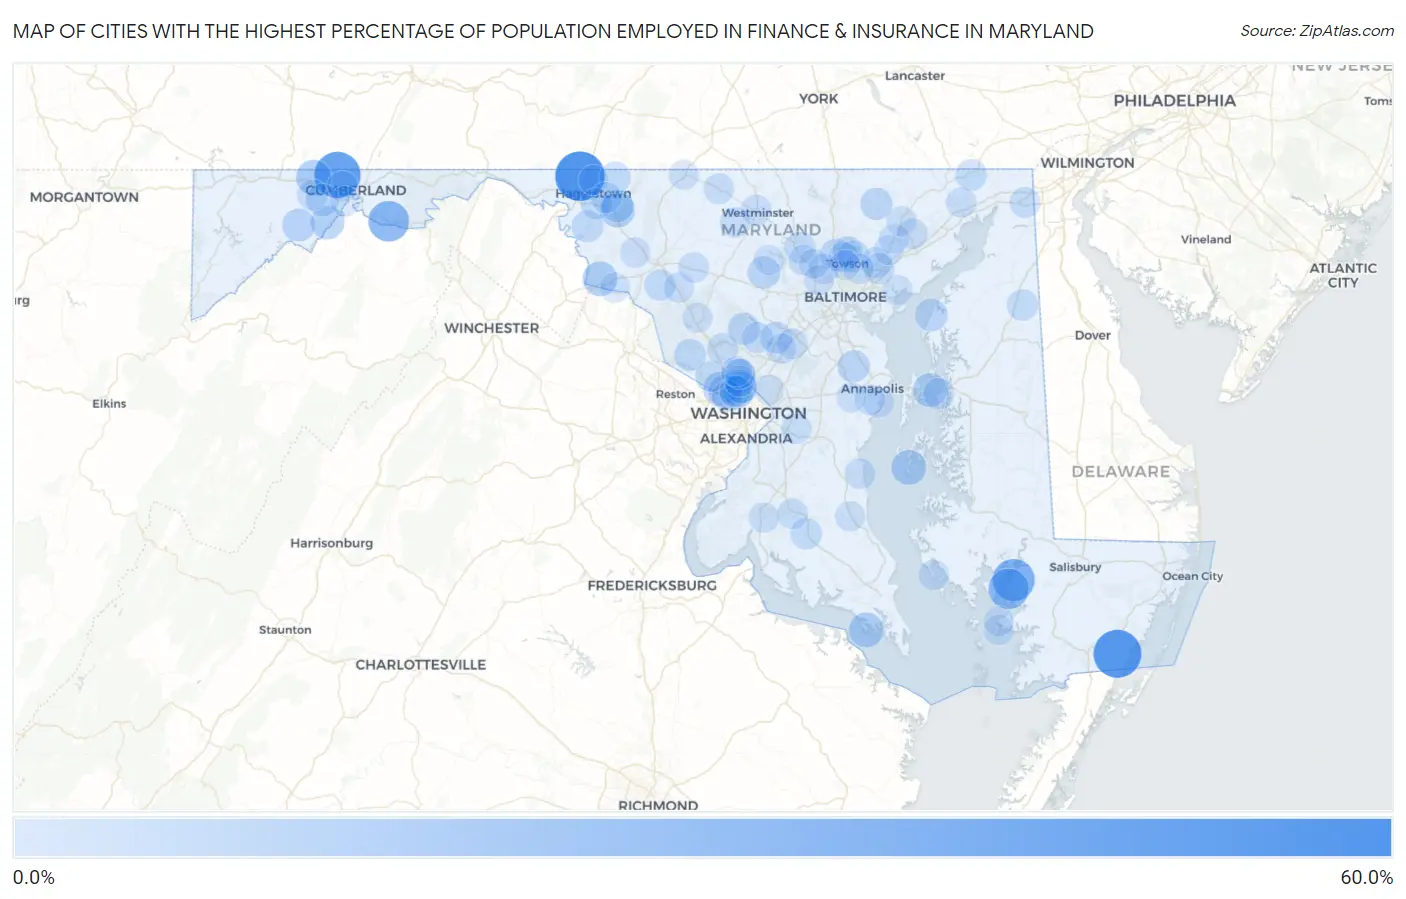
Map of Cities with the Highest Percentage of Population Employed in Finance & Insurance in Maryland
0.0%
60.0%
Cities with the Highest Percentage of Population Employed in Finance & Insurance in Maryland
| City | % Employed | vs State | vs National | |
| 1. | Cearfoss | 51.2% | 3.9%(+47.3)#1 | 4.8%(+46.4)#38 |
| 2. | Stockton | 47.4% | 3.9%(+43.5)#2 | 4.8%(+42.6)#52 |
| 3. | Barrelville | 43.3% | 3.9%(+39.5)#3 | 4.8%(+38.6)#67 |
| 4. | Tyaskin | 33.3% | 3.9%(+29.5)#4 | 4.8%(+28.6)#118 |
| 5. | Oldtown | 29.7% | 3.9%(+25.9)#5 | 4.8%(+25.0)#160 |
| 6. | Jesterville | 29.2% | 3.9%(+25.3)#6 | 4.8%(+24.4)#167 |
| 7. | Maryland Park | 17.8% | 3.9%(+13.9)#7 | 4.8%(+13.0)#481 |
| 8. | Finzel | 17.3% | 3.9%(+13.5)#8 | 4.8%(+12.5)#499 |
| 9. | Bagtown | 16.1% | 3.9%(+12.2)#9 | 4.8%(+11.3)#588 |
| 10. | Tilghman Island | 16.0% | 3.9%(+12.2)#10 | 4.8%(+11.3)#594 |
| 11. | Piney Point | 15.9% | 3.9%(+12.0)#11 | 4.8%(+11.1)#603 |
| 12. | Garretts Mill | 15.6% | 3.9%(+11.7)#12 | 4.8%(+10.8)#633 |
| 13. | Chevy Chase View | 14.7% | 3.9%(+10.8)#13 | 4.8%(+9.90)#738 |
| 14. | Kent Narrows | 14.2% | 3.9%(+10.4)#14 | 4.8%(+9.46)#800 |
| 15. | Rawlings | 13.7% | 3.9%(+9.80)#15 | 4.8%(+8.90)#877 |
| 16. | Cabin John | 13.6% | 3.9%(+9.74)#16 | 4.8%(+8.84)#886 |
| 17. | Chevy Chase Section Five | 12.2% | 3.9%(+8.33)#17 | 4.8%(+7.43)#1,173 |
| 18. | Barton | 11.8% | 3.9%(+7.93)#18 | 4.8%(+7.03)#1,288 |
| 19. | Graceham | 11.7% | 3.9%(+7.85)#19 | 4.8%(+6.95)#1,309 |
| 20. | Glen Echo | 11.7% | 3.9%(+7.81)#20 | 4.8%(+6.91)#1,316 |
| 21. | Friendship Heights Village | 11.5% | 3.9%(+7.59)#21 | 4.8%(+6.69)#1,381 |
| 22. | Vale Summit | 11.2% | 3.9%(+7.37)#22 | 4.8%(+6.47)#1,454 |
| 23. | Tolchester | 11.2% | 3.9%(+7.29)#23 | 4.8%(+6.39)#1,471 |
| 24. | Mays Chapel | 11.1% | 3.9%(+7.26)#24 | 4.8%(+6.35)#1,483 |
| 25. | Sykesville | 11.0% | 3.9%(+7.14)#25 | 4.8%(+6.23)#1,530 |
| 26. | Brown Station | 10.9% | 3.9%(+7.00)#26 | 4.8%(+6.09)#1,582 |
| 27. | Herald Harbor | 10.2% | 3.9%(+6.38)#27 | 4.8%(+5.48)#1,799 |
| 28. | Brookeville | 10.1% | 3.9%(+6.24)#28 | 4.8%(+5.33)#1,867 |
| 29. | Jarrettsville | 10.0% | 3.9%(+6.17)#29 | 4.8%(+5.27)#1,896 |
| 30. | Mount Aetna | 9.9% | 3.9%(+6.07)#30 | 4.8%(+5.17)#1,941 |
| 31. | Darnestown | 9.8% | 3.9%(+5.94)#31 | 4.8%(+5.04)#2,008 |
| 32. | Fulton | 9.8% | 3.9%(+5.93)#32 | 4.8%(+5.02)#2,011 |
| 33. | Hampton | 9.3% | 3.9%(+5.48)#33 | 4.8%(+4.58)#2,277 |
| 34. | Tilghmanton | 9.3% | 3.9%(+5.42)#34 | 4.8%(+4.52)#2,307 |
| 35. | Leitersburg | 8.8% | 3.9%(+4.99)#35 | 4.8%(+4.08)#2,585 |
| 36. | Chevy Chase Village | 8.8% | 3.9%(+4.96)#36 | 4.8%(+4.05)#2,610 |
| 37. | Buckeystown | 8.6% | 3.9%(+4.71)#37 | 4.8%(+3.80)#2,770 |
| 38. | Martin S Additions | 8.6% | 3.9%(+4.70)#38 | 4.8%(+3.80)#2,786 |
| 39. | Rising Sun | 8.5% | 3.9%(+4.66)#39 | 4.8%(+3.76)#2,808 |
| 40. | Millington | 8.5% | 3.9%(+4.60)#40 | 4.8%(+3.70)#2,868 |
| 41. | Reisterstown | 8.4% | 3.9%(+4.55)#41 | 4.8%(+3.64)#2,908 |
| 42. | Funkstown | 8.4% | 3.9%(+4.51)#42 | 4.8%(+3.60)#2,937 |
| 43. | Charlotte Hall | 8.4% | 3.9%(+4.50)#43 | 4.8%(+3.60)#2,940 |
| 44. | Grasonville | 8.3% | 3.9%(+4.39)#44 | 4.8%(+3.49)#3,021 |
| 45. | Brookmont | 8.2% | 3.9%(+4.32)#45 | 4.8%(+3.42)#3,074 |
| 46. | Potomac | 8.1% | 3.9%(+4.28)#46 | 4.8%(+3.37)#3,112 |
| 47. | Perry Hall | 8.1% | 3.9%(+4.27)#47 | 4.8%(+3.37)#3,127 |
| 48. | Somerset | 7.9% | 3.9%(+4.06)#48 | 4.8%(+3.15)#3,323 |
| 49. | Derwood | 7.9% | 3.9%(+4.01)#49 | 4.8%(+3.11)#3,358 |
| 50. | Ashton Sandy Spring | 7.9% | 3.9%(+4.00)#50 | 4.8%(+3.09)#3,377 |
| 51. | North Chevy Chase | 7.7% | 3.9%(+3.85)#51 | 4.8%(+2.95)#3,501 |
| 52. | Elkton | 7.7% | 3.9%(+3.84)#52 | 4.8%(+2.94)#3,510 |
| 53. | Abingdon | 7.6% | 3.9%(+3.76)#53 | 4.8%(+2.86)#3,616 |
| 54. | Robinwood | 7.6% | 3.9%(+3.73)#54 | 4.8%(+2.83)#3,649 |
| 55. | White Marsh | 7.5% | 3.9%(+3.68)#55 | 4.8%(+2.78)#3,691 |
| 56. | Midlothian | 7.3% | 3.9%(+3.41)#56 | 4.8%(+2.51)#3,979 |
| 57. | Bryantown | 7.0% | 3.9%(+3.18)#57 | 4.8%(+2.27)#4,270 |
| 58. | Bel Air South | 7.0% | 3.9%(+3.16)#58 | 4.8%(+2.25)#4,293 |
| 59. | Chesapeake Beach | 7.0% | 3.9%(+3.15)#59 | 4.8%(+2.25)#4,295 |
| 60. | Lutherville | 6.9% | 3.9%(+3.03)#60 | 4.8%(+2.13)#4,470 |
| 61. | North Laurel | 6.9% | 3.9%(+3.01)#61 | 4.8%(+2.11)#4,495 |
| 62. | Taneytown | 6.9% | 3.9%(+3.00)#62 | 4.8%(+2.10)#4,503 |
| 63. | New Windsor | 6.8% | 3.9%(+2.96)#63 | 4.8%(+2.06)#4,566 |
| 64. | Westminster | 6.8% | 3.9%(+2.92)#64 | 4.8%(+2.02)#4,614 |
| 65. | Urbana | 6.7% | 3.9%(+2.84)#65 | 4.8%(+1.93)#4,730 |
| 66. | New Market | 6.6% | 3.9%(+2.78)#66 | 4.8%(+1.87)#4,809 |
| 67. | Owings Mills | 6.6% | 3.9%(+2.77)#67 | 4.8%(+1.87)#4,816 |
| 68. | La Vale | 6.6% | 3.9%(+2.76)#68 | 4.8%(+1.86)#4,830 |
| 69. | Pikesville | 6.6% | 3.9%(+2.76)#69 | 4.8%(+1.85)#4,844 |
| 70. | Middletown | 6.5% | 3.9%(+2.63)#70 | 4.8%(+1.73)#5,018 |
| 71. | Chesapeake Landing | 6.5% | 3.9%(+2.62)#71 | 4.8%(+1.72)#5,032 |
| 72. | Highland Beach | 6.5% | 3.9%(+2.59)#72 | 4.8%(+1.68)#5,100 |
| 73. | West Laurel | 6.4% | 3.9%(+2.57)#73 | 4.8%(+1.67)#5,125 |
| 74. | Timonium | 6.4% | 3.9%(+2.56)#74 | 4.8%(+1.66)#5,138 |
| 75. | Parkville | 6.4% | 3.9%(+2.53)#75 | 4.8%(+1.63)#5,183 |
| 76. | Fishing Creek | 6.4% | 3.9%(+2.52)#76 | 4.8%(+1.62)#5,197 |
| 77. | La Plata | 6.2% | 3.9%(+2.33)#77 | 4.8%(+1.43)#5,471 |
| 78. | Westphalia | 6.1% | 3.9%(+2.27)#78 | 4.8%(+1.37)#5,568 |
| 79. | Port Deposit | 6.1% | 3.9%(+2.26)#79 | 4.8%(+1.36)#5,588 |
| 80. | Garrett Park | 6.1% | 3.9%(+2.19)#80 | 4.8%(+1.29)#5,701 |
| 81. | Kingsville | 6.0% | 3.9%(+2.17)#81 | 4.8%(+1.27)#5,730 |
| 82. | Eldersburg | 6.0% | 3.9%(+2.13)#82 | 4.8%(+1.22)#5,815 |
| 83. | Fountainhead Orchard Hills | 6.0% | 3.9%(+2.11)#83 | 4.8%(+1.21)#5,846 |
| 84. | Emmitsburg | 6.0% | 3.9%(+2.09)#84 | 4.8%(+1.18)#5,879 |
| 85. | Deal Island | 6.0% | 3.9%(+2.09)#85 | 4.8%(+1.18)#5,883 |
| 86. | Potomac Park | 5.9% | 3.9%(+2.06)#86 | 4.8%(+1.16)#5,930 |
| 87. | Annapolis Neck | 5.9% | 3.9%(+2.05)#87 | 4.8%(+1.14)#5,947 |
| 88. | Brunswick | 5.8% | 3.9%(+1.96)#88 | 4.8%(+1.05)#6,109 |
| 89. | Bel Air North | 5.8% | 3.9%(+1.94)#89 | 4.8%(+1.03)#6,143 |
| 90. | Clarksburg | 5.8% | 3.9%(+1.94)#90 | 4.8%(+1.03)#6,147 |
| 91. | Chance | 5.8% | 3.9%(+1.92)#91 | 4.8%(+1.02)#6,172 |
| 92. | Prince Frederick | 5.8% | 3.9%(+1.89)#92 | 4.8%(+0.989)#6,219 |
| 93. | Towson | 5.7% | 3.9%(+1.88)#93 | 4.8%(+0.978)#6,240 |
| 94. | Kensington | 5.7% | 3.9%(+1.87)#94 | 4.8%(+0.969)#6,252 |
| 95. | Pleasant Hills | 5.7% | 3.9%(+1.86)#95 | 4.8%(+0.954)#6,274 |
| 96. | Riva | 5.7% | 3.9%(+1.83)#96 | 4.8%(+0.927)#6,325 |
| 97. | Lochearn | 5.7% | 3.9%(+1.83)#97 | 4.8%(+0.925)#6,332 |
| 98. | Bowleys Quarters | 5.7% | 3.9%(+1.82)#98 | 4.8%(+0.917)#6,350 |
| 99. | Garrison | 5.7% | 3.9%(+1.81)#99 | 4.8%(+0.905)#6,375 |
| 100. | University Park | 5.7% | 3.9%(+1.80)#100 | 4.8%(+0.902)#6,385 |
Common Questions
What are the Top 10 Cities with the Highest Percentage of Population Employed in Finance & Insurance in Maryland?
Top 10 Cities with the Highest Percentage of Population Employed in Finance & Insurance in Maryland are:
#1
51.2%
#2
47.4%
#3
43.3%
#4
33.3%
#5
29.7%
#6
29.2%
#7
17.3%
#8
16.1%
#9
16.0%
#10
15.9%
What city has the Highest Percentage of Population Employed in Finance & Insurance in Maryland?
Cearfoss has the Highest Percentage of Population Employed in Finance & Insurance in Maryland with 51.2%.
What is the Percentage of Population Employed in Finance & Insurance in the State of Maryland?
Percentage of Population Employed in Finance & Insurance in Maryland is 3.9%.
What is the Percentage of Population Employed in Finance & Insurance in the United States?
Percentage of Population Employed in Finance & Insurance in the United States is 4.8%.