Cities with the Highest Percentage of Population Employed in Finance & Insurance in Tennessee
RELATED REPORTS & OPTIONS
Finance & Insurance
Tennessee
Compare Cities
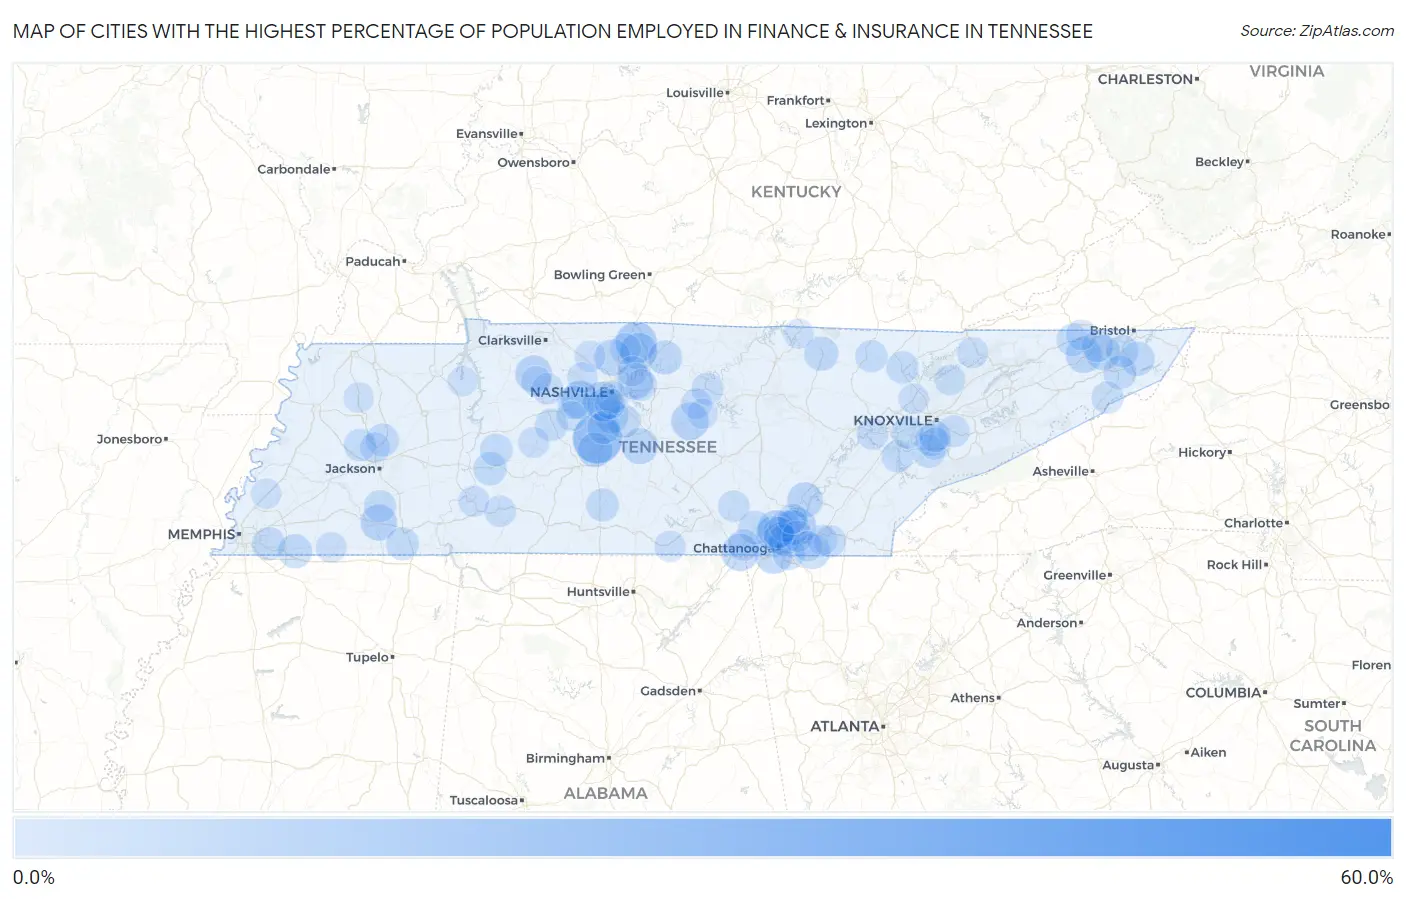
Map of Cities with the Highest Percentage of Population Employed in Finance & Insurance in Tennessee
0.0%
60.0%
Cities with the Highest Percentage of Population Employed in Finance & Insurance in Tennessee
| City | % Employed | vs State | vs National | |
| 1. | Griffith Creek | 55.2% | 4.3%(+50.9)#1 | 4.8%(+50.5)#32 |
| 2. | Thompson S Station | 25.2% | 4.3%(+20.9)#2 | 4.8%(+20.4)#216 |
| 3. | New Deal | 16.7% | 4.3%(+12.3)#3 | 4.8%(+11.9)#539 |
| 4. | Dellrose | 16.2% | 4.3%(+11.9)#4 | 4.8%(+11.4)#576 |
| 5. | Belle Meade | 14.3% | 4.3%(+10.0)#5 | 4.8%(+9.57)#770 |
| 6. | Pegram | 13.3% | 4.3%(+8.99)#6 | 4.8%(+8.55)#944 |
| 7. | Auburntown | 12.9% | 4.3%(+8.59)#7 | 4.8%(+8.15)#1,006 |
| 8. | Lookout Mountain | 12.8% | 4.3%(+8.47)#8 | 4.8%(+8.03)#1,033 |
| 9. | Lakesite | 12.7% | 4.3%(+8.37)#9 | 4.8%(+7.93)#1,054 |
| 10. | New Hope | 12.5% | 4.3%(+8.14)#10 | 4.8%(+7.70)#1,108 |
| 11. | Fairmount | 12.3% | 4.3%(+7.96)#11 | 4.8%(+7.52)#1,153 |
| 12. | Slayden | 12.2% | 4.3%(+7.83)#12 | 4.8%(+7.39)#1,185 |
| 13. | Cottontown | 12.0% | 4.3%(+7.70)#13 | 4.8%(+7.26)#1,227 |
| 14. | Delano | 12.0% | 4.3%(+7.69)#14 | 4.8%(+7.25)#1,229 |
| 15. | Green Hill | 11.8% | 4.3%(+7.44)#15 | 4.8%(+7.00)#1,293 |
| 16. | Hornsby | 11.5% | 4.3%(+7.15)#16 | 4.8%(+6.71)#1,374 |
| 17. | Ridgetop | 11.4% | 4.3%(+7.11)#17 | 4.8%(+6.67)#1,389 |
| 18. | Fall Branch | 11.3% | 4.3%(+7.01)#18 | 4.8%(+6.57)#1,416 |
| 19. | Sullivan Gardens | 11.0% | 4.3%(+6.64)#19 | 4.8%(+6.20)#1,539 |
| 20. | Rockvale | 11.0% | 4.3%(+6.63)#20 | 4.8%(+6.19)#1,542 |
| 21. | Sale Creek | 10.7% | 4.3%(+6.34)#21 | 4.8%(+5.91)#1,644 |
| 22. | Apison | 10.6% | 4.3%(+6.27)#22 | 4.8%(+5.83)#1,666 |
| 23. | Signal Mountain | 10.6% | 4.3%(+6.24)#23 | 4.8%(+5.80)#1,677 |
| 24. | Spurgeon | 10.3% | 4.3%(+6.02)#24 | 4.8%(+5.58)#1,754 |
| 25. | Middle Valley | 9.9% | 4.3%(+5.60)#25 | 4.8%(+5.17)#1,944 |
| 26. | Spring Hill | 9.9% | 4.3%(+5.57)#26 | 4.8%(+5.13)#1,964 |
| 27. | Hunter | 9.5% | 4.3%(+5.19)#27 | 4.8%(+4.75)#2,180 |
| 28. | Brentwood | 9.4% | 4.3%(+5.08)#28 | 4.8%(+4.64)#2,248 |
| 29. | Rossville | 9.3% | 4.3%(+4.93)#29 | 4.8%(+4.49)#2,323 |
| 30. | Jamestown | 9.3% | 4.3%(+4.93)#30 | 4.8%(+4.49)#2,328 |
| 31. | Castalian Springs | 9.2% | 4.3%(+4.92)#31 | 4.8%(+4.48)#2,334 |
| 32. | Pine Crest | 8.8% | 4.3%(+4.52)#32 | 4.8%(+4.08)#2,587 |
| 33. | Whitwell | 8.5% | 4.3%(+4.19)#33 | 4.8%(+3.75)#2,810 |
| 34. | Nolensville | 8.5% | 4.3%(+4.19)#34 | 4.8%(+3.75)#2,812 |
| 35. | Germantown | 8.5% | 4.3%(+4.17)#35 | 4.8%(+3.73)#2,841 |
| 36. | Linden | 8.5% | 4.3%(+4.16)#36 | 4.8%(+3.72)#2,850 |
| 37. | Kingston Springs | 8.5% | 4.3%(+4.14)#37 | 4.8%(+3.70)#2,865 |
| 38. | Medina | 8.2% | 4.3%(+3.88)#38 | 4.8%(+3.44)#3,058 |
| 39. | Maryville | 8.2% | 4.3%(+3.87)#39 | 4.8%(+3.43)#3,060 |
| 40. | Forest Hills | 8.2% | 4.3%(+3.87)#40 | 4.8%(+3.43)#3,067 |
| 41. | Ramer | 8.1% | 4.3%(+3.82)#41 | 4.8%(+3.38)#3,108 |
| 42. | Cornersville | 8.1% | 4.3%(+3.81)#42 | 4.8%(+3.37)#3,121 |
| 43. | Franklin | 8.0% | 4.3%(+3.67)#43 | 4.8%(+3.23)#3,242 |
| 44. | Red Bank | 7.9% | 4.3%(+3.62)#44 | 4.8%(+3.18)#3,297 |
| 45. | Bon Aqua Junction | 7.9% | 4.3%(+3.57)#45 | 4.8%(+3.13)#3,335 |
| 46. | Lobelville | 7.9% | 4.3%(+3.54)#46 | 4.8%(+3.10)#3,371 |
| 47. | Caryville | 7.7% | 4.3%(+3.40)#47 | 4.8%(+2.96)#3,494 |
| 48. | Gadsden | 7.6% | 4.3%(+3.26)#48 | 4.8%(+2.82)#3,660 |
| 49. | Bluff City | 7.5% | 4.3%(+3.20)#49 | 4.8%(+2.76)#3,717 |
| 50. | Alcoa | 7.5% | 4.3%(+3.13)#50 | 4.8%(+2.69)#3,772 |
| 51. | Tellico Village | 7.5% | 4.3%(+3.13)#51 | 4.8%(+2.69)#3,779 |
| 52. | East Ridge | 7.4% | 4.3%(+3.11)#52 | 4.8%(+2.67)#3,796 |
| 53. | Farragut | 7.4% | 4.3%(+3.09)#53 | 4.8%(+2.65)#3,825 |
| 54. | Huntsville | 7.3% | 4.3%(+2.99)#54 | 4.8%(+2.55)#3,920 |
| 55. | Silerton | 7.3% | 4.3%(+2.99)#55 | 4.8%(+2.55)#3,933 |
| 56. | Church Hill | 7.3% | 4.3%(+2.97)#56 | 4.8%(+2.53)#3,958 |
| 57. | Banner Hill | 7.3% | 4.3%(+2.95)#57 | 4.8%(+2.51)#3,974 |
| 58. | Wildwood Lake | 7.3% | 4.3%(+2.92)#58 | 4.8%(+2.49)#4,003 |
| 59. | Gordonsville | 7.2% | 4.3%(+2.89)#59 | 4.8%(+2.45)#4,041 |
| 60. | Eagleton Village | 7.1% | 4.3%(+2.78)#60 | 4.8%(+2.34)#4,190 |
| 61. | Seymour | 7.1% | 4.3%(+2.73)#61 | 4.8%(+2.29)#4,245 |
| 62. | Jasper | 7.0% | 4.3%(+2.70)#62 | 4.8%(+2.26)#4,289 |
| 63. | Berry Hill | 7.0% | 4.3%(+2.68)#63 | 4.8%(+2.24)#4,317 |
| 64. | Colonial Heights | 7.0% | 4.3%(+2.64)#64 | 4.8%(+2.20)#4,374 |
| 65. | Rockford | 6.8% | 4.3%(+2.50)#65 | 4.8%(+2.06)#4,559 |
| 66. | Mount Juliet | 6.8% | 4.3%(+2.42)#66 | 4.8%(+1.98)#4,667 |
| 67. | Kingston | 6.7% | 4.3%(+2.34)#67 | 4.8%(+1.90)#4,756 |
| 68. | Coalmont | 6.6% | 4.3%(+2.23)#68 | 4.8%(+1.80)#4,920 |
| 69. | Falling Water | 6.5% | 4.3%(+2.21)#69 | 4.8%(+1.77)#4,956 |
| 70. | Charlotte | 6.5% | 4.3%(+2.19)#70 | 4.8%(+1.75)#4,982 |
| 71. | Chattanooga | 6.5% | 4.3%(+2.16)#71 | 4.8%(+1.72)#5,026 |
| 72. | Waynesboro | 6.5% | 4.3%(+2.16)#72 | 4.8%(+1.72)#5,030 |
| 73. | Walden | 6.5% | 4.3%(+2.15)#73 | 4.8%(+1.71)#5,044 |
| 74. | Huntland | 6.4% | 4.3%(+2.06)#74 | 4.8%(+1.62)#5,186 |
| 75. | New Tazewell | 6.3% | 4.3%(+1.94)#75 | 4.8%(+1.50)#5,354 |
| 76. | White House | 6.2% | 4.3%(+1.87)#76 | 4.8%(+1.43)#5,459 |
| 77. | Centerville | 6.1% | 4.3%(+1.74)#77 | 4.8%(+1.30)#5,678 |
| 78. | Coopertown | 6.0% | 4.3%(+1.72)#78 | 4.8%(+1.28)#5,707 |
| 79. | Harrison | 6.0% | 4.3%(+1.72)#79 | 4.8%(+1.28)#5,714 |
| 80. | Clifton | 6.0% | 4.3%(+1.70)#80 | 4.8%(+1.26)#5,747 |
| 81. | Alexandria | 5.9% | 4.3%(+1.53)#81 | 4.8%(+1.09)#6,045 |
| 82. | Ashland City | 5.8% | 4.3%(+1.47)#82 | 4.8%(+1.03)#6,149 |
| 83. | La Grange | 5.7% | 4.3%(+1.39)#83 | 4.8%(+0.947)#6,292 |
| 84. | Clinton | 5.7% | 4.3%(+1.37)#84 | 4.8%(+0.930)#6,320 |
| 85. | Oak Hill | 5.7% | 4.3%(+1.36)#85 | 4.8%(+0.920)#6,347 |
| 86. | Maynardville | 5.7% | 4.3%(+1.35)#86 | 4.8%(+0.912)#6,364 |
| 87. | Three Way | 5.7% | 4.3%(+1.34)#87 | 4.8%(+0.903)#6,378 |
| 88. | Mount Carmel | 5.6% | 4.3%(+1.31)#88 | 4.8%(+0.871)#6,443 |
| 89. | Karns | 5.6% | 4.3%(+1.31)#89 | 4.8%(+0.871)#6,445 |
| 90. | Munford | 5.5% | 4.3%(+1.22)#90 | 4.8%(+0.777)#6,643 |
| 91. | Rutherford | 5.5% | 4.3%(+1.18)#91 | 4.8%(+0.743)#6,711 |
| 92. | South Cleveland | 5.4% | 4.3%(+1.12)#92 | 4.8%(+0.681)#6,830 |
| 93. | Vanleer | 5.4% | 4.3%(+1.12)#93 | 4.8%(+0.681)#6,831 |
| 94. | Hendersonville | 5.4% | 4.3%(+1.10)#94 | 4.8%(+0.658)#6,873 |
| 95. | Liberty | 5.4% | 4.3%(+1.08)#95 | 4.8%(+0.638)#6,906 |
| 96. | Byrdstown | 5.3% | 4.3%(+1.01)#96 | 4.8%(+0.566)#7,040 |
| 97. | Collegedale | 5.3% | 4.3%(+0.958)#97 | 4.8%(+0.519)#7,145 |
| 98. | Big Sandy | 5.3% | 4.3%(+0.935)#98 | 4.8%(+0.496)#7,186 |
| 99. | Fairview | 5.2% | 4.3%(+0.910)#99 | 4.8%(+0.470)#7,250 |
| 100. | Soddy Daisy | 5.2% | 4.3%(+0.870)#100 | 4.8%(+0.430)#7,327 |
Common Questions
What are the Top 10 Cities with the Highest Percentage of Population Employed in Finance & Insurance in Tennessee?
Top 10 Cities with the Highest Percentage of Population Employed in Finance & Insurance in Tennessee are:
#1
25.2%
#2
16.7%
#3
14.3%
#4
13.3%
#5
12.9%
#6
12.8%
#7
12.7%
#8
12.5%
#9
12.3%
#10
12.2%
What city has the Highest Percentage of Population Employed in Finance & Insurance in Tennessee?
Thompson s Station has the Highest Percentage of Population Employed in Finance & Insurance in Tennessee with 25.2%.
What is the Percentage of Population Employed in Finance & Insurance in the State of Tennessee?
Percentage of Population Employed in Finance & Insurance in Tennessee is 4.3%.
What is the Percentage of Population Employed in Finance & Insurance in the United States?
Percentage of Population Employed in Finance & Insurance in the United States is 4.8%.