Temple City, CA Map & Demographics
Temple City Map
Temple City Overview
$40,134
PER CAPITA INCOME
$104,000
AVG FAMILY INCOME
$95,263
AVG HOUSEHOLD INCOME
24.9%
WAGE / INCOME GAP [ % ]
75.1¢/ $1
WAGE / INCOME GAP [ $ ]
$11,005
FAMILY INCOME DEFICIT
0.45
INEQUALITY / GINI INDEX
36,165
TOTAL POPULATION
17,177
MALE POPULATION
18,988
FEMALE POPULATION
90.46
MALES / 100 FEMALES
110.54
FEMALES / 100 MALES
42.9
MEDIAN AGE
3.4
AVG FAMILY SIZE
3.0
AVG HOUSEHOLD SIZE
17,905
LABOR FORCE [ PEOPLE ]
61.1%
PERCENT IN LABOR FORCE
6.2%
UNEMPLOYMENT RATE
Temple City Zip Codes
Income in Temple City
Income Overview in Temple City
Per Capita Income in Temple City is $40,134, while median incomes of families and households are $104,000 and $95,263 respectively.
| Characteristic | Number | Measure |
| Per Capita Income | 36,165 | $40,134 |
| Median Family Income | 9,300 | $104,000 |
| Mean Family Income | 9,300 | $129,703 |
| Median Household Income | 11,722 | $95,263 |
| Mean Household Income | 11,722 | $120,229 |
| Income Deficit | 9,300 | $11,005 |
| Wage / Income Gap (%) | 36,165 | 24.87% |
| Wage / Income Gap ($) | 36,165 | 75.13¢ per $1 |
| Gini / Inequality Index | 36,165 | 0.45 |
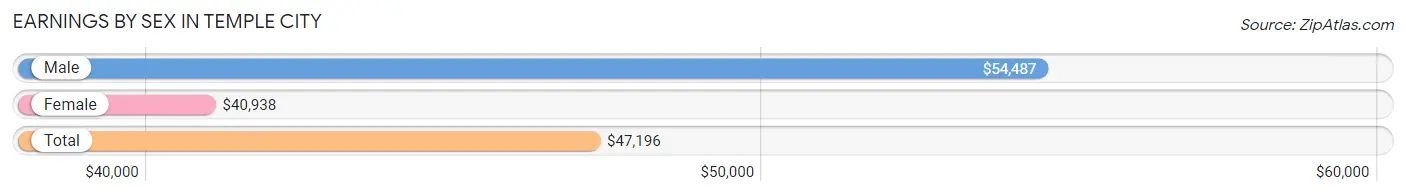
Earnings by Sex in Temple City
Average Earnings in Temple City are $47,196, $54,487 for men and $40,938 for women, a difference of 24.9%.
| Sex | Number | Average Earnings |
| Male | 9,634 (52.6%) | $54,487 |
| Female | 8,663 (47.3%) | $40,938 |
| Total | 18,297 (100.0%) | $47,196 |
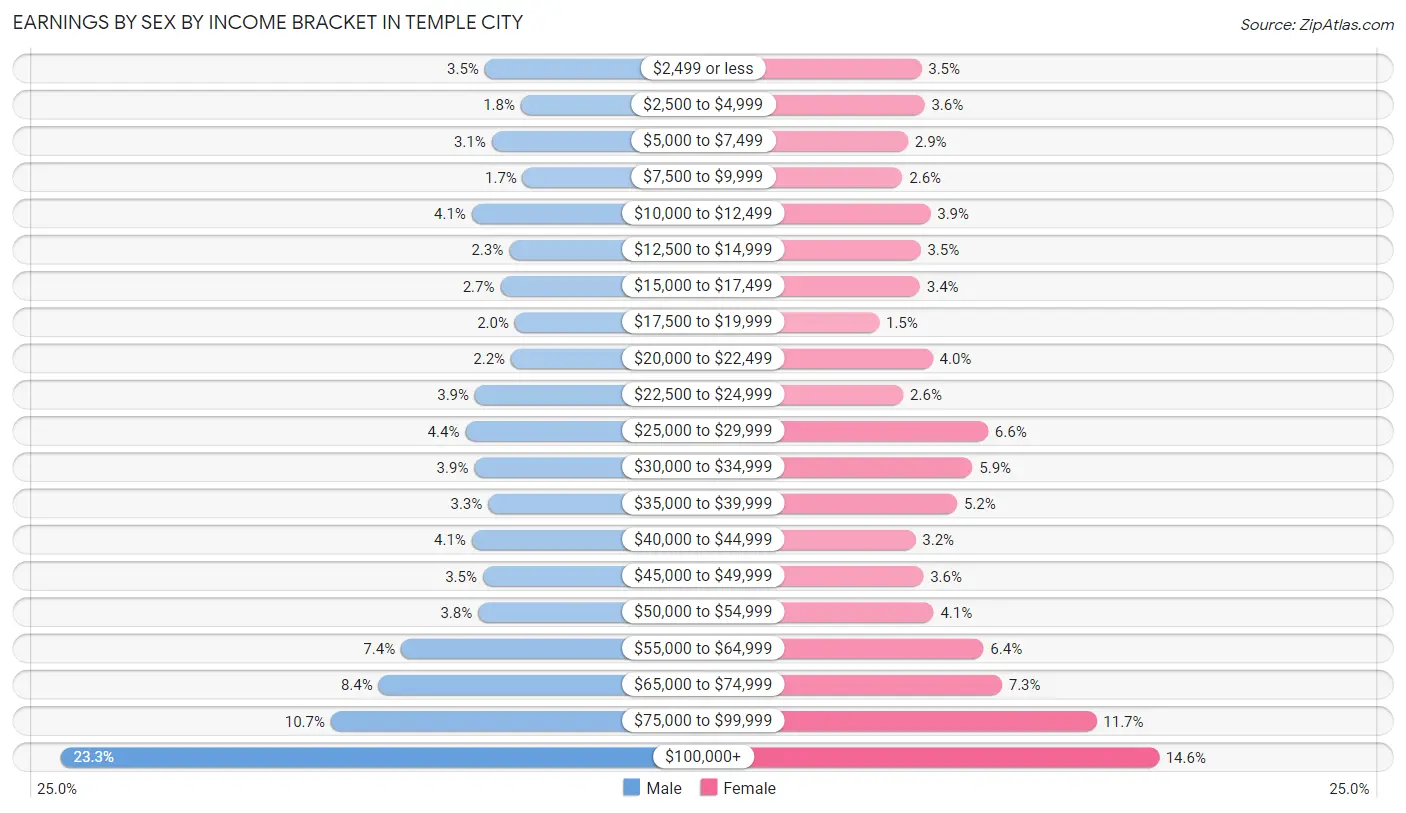
Earnings by Sex by Income Bracket in Temple City
The most common earnings brackets in Temple City are $100,000+ for men (2,246 | 23.3%) and $100,000+ for women (1,266 | 14.6%).
| Income | Male | Female |
| $2,499 or less | 332 (3.5%) | 302 (3.5%) |
| $2,500 to $4,999 | 170 (1.8%) | 315 (3.6%) |
| $5,000 to $7,499 | 302 (3.1%) | 248 (2.9%) |
| $7,500 to $9,999 | 161 (1.7%) | 225 (2.6%) |
| $10,000 to $12,499 | 391 (4.1%) | 339 (3.9%) |
| $12,500 to $14,999 | 223 (2.3%) | 299 (3.5%) |
| $15,000 to $17,499 | 262 (2.7%) | 296 (3.4%) |
| $17,500 to $19,999 | 197 (2.0%) | 131 (1.5%) |
| $20,000 to $22,499 | 214 (2.2%) | 348 (4.0%) |
| $22,500 to $24,999 | 377 (3.9%) | 229 (2.6%) |
| $25,000 to $29,999 | 420 (4.4%) | 573 (6.6%) |
| $30,000 to $34,999 | 380 (3.9%) | 509 (5.9%) |
| $35,000 to $39,999 | 317 (3.3%) | 447 (5.2%) |
| $40,000 to $44,999 | 391 (4.1%) | 278 (3.2%) |
| $45,000 to $49,999 | 341 (3.5%) | 310 (3.6%) |
| $50,000 to $54,999 | 362 (3.8%) | 352 (4.1%) |
| $55,000 to $64,999 | 710 (7.4%) | 554 (6.4%) |
| $65,000 to $74,999 | 811 (8.4%) | 629 (7.3%) |
| $75,000 to $99,999 | 1,027 (10.7%) | 1,013 (11.7%) |
| $100,000+ | 2,246 (23.3%) | 1,266 (14.6%) |
| Total | 9,634 (100.0%) | 8,663 (100.0%) |
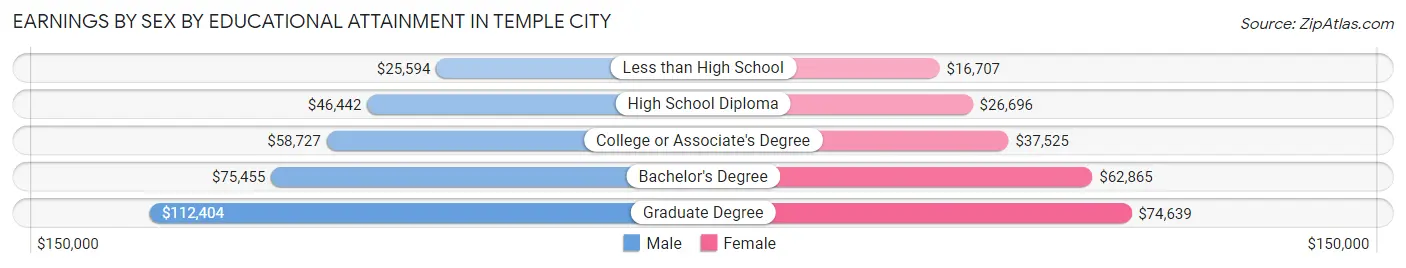
Earnings by Sex by Educational Attainment in Temple City
Average earnings in Temple City are $59,080 for men and $45,811 for women, a difference of 22.5%. Men with an educational attainment of graduate degree enjoy the highest average annual earnings of $112,404, while those with less than high school education earn the least with $25,594. Women with an educational attainment of graduate degree earn the most with the average annual earnings of $74,639, while those with less than high school education have the smallest earnings of $16,707.
| Educational Attainment | Male Income | Female Income |
| Less than High School | $25,594 | $16,707 |
| High School Diploma | $46,442 | $26,696 |
| College or Associate's Degree | $58,727 | $37,525 |
| Bachelor's Degree | $75,455 | $62,865 |
| Graduate Degree | $112,404 | $74,639 |
| Total | $59,080 | $45,811 |
Family Income in Temple City
Family Income Brackets in Temple City
According to the Temple City family income data, there are 1,925 families falling into the $100,000 to $149,999 income range, which is the most common income bracket and makes up 20.7% of all families. Conversely, the $10,000 to $14,999 income bracket is the least frequent group with only 186 families (2.0%) belonging to this category.
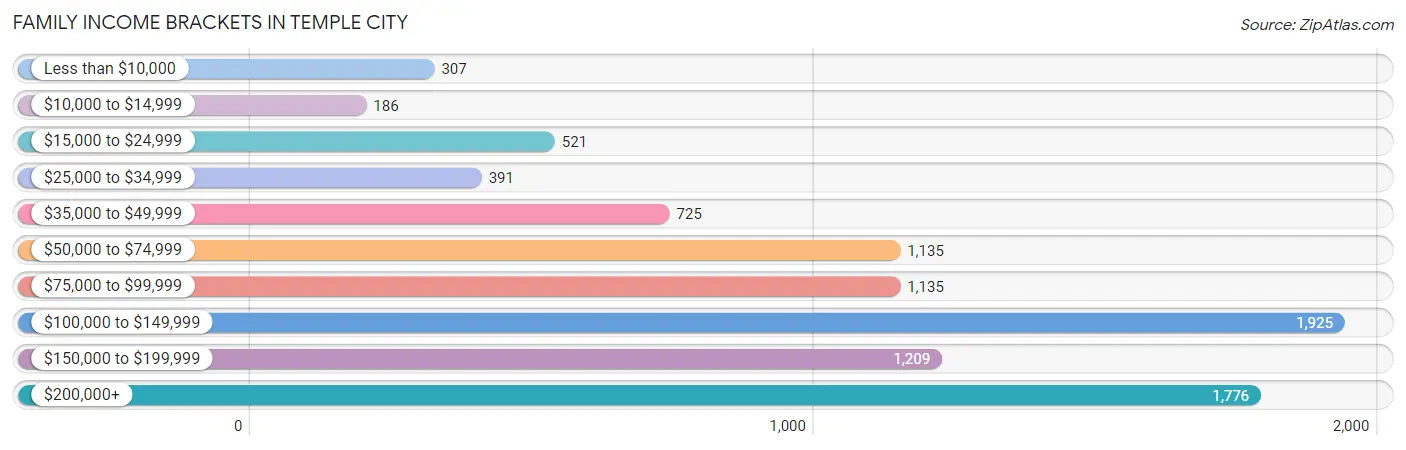
| Income Bracket | # Families | % Families |
| Less than $10,000 | 307 | 3.3% |
| $10,000 to $14,999 | 186 | 2.0% |
| $15,000 to $24,999 | 521 | 5.6% |
| $25,000 to $34,999 | 391 | 4.2% |
| $35,000 to $49,999 | 725 | 7.8% |
| $50,000 to $74,999 | 1,135 | 12.2% |
| $75,000 to $99,999 | 1,135 | 12.2% |
| $100,000 to $149,999 | 1,925 | 20.7% |
| $150,000 to $199,999 | 1,209 | 13.0% |
| $200,000+ | 1,776 | 19.1% |
Family Income by Famaliy Size in Temple City
6-person families (184 | 2.0%) account for the highest median family income in Temple City with $172,685 per family, while 2-person families (3,082 | 33.1%) have the highest median income of $36,689 per family member.
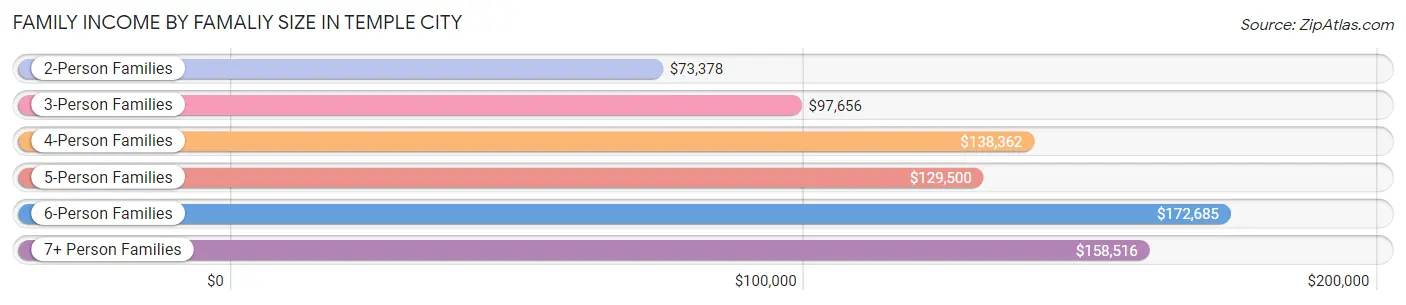
| Income Bracket | # Families | Median Income |
| 2-Person Families | 3,082 (33.1%) | $73,378 |
| 3-Person Families | 2,703 (29.1%) | $97,656 |
| 4-Person Families | 2,294 (24.7%) | $138,362 |
| 5-Person Families | 880 (9.5%) | $129,500 |
| 6-Person Families | 184 (2.0%) | $172,685 |
| 7+ Person Families | 157 (1.7%) | $158,516 |
| Total | 9,300 (100.0%) | $104,000 |
Family Income by Number of Earners in Temple City
The median family income in Temple City is $104,000, with families comprising 3+ earners (1,504) having the highest median family income of $144,474, while families with no earners (1,182) have the lowest median family income of $35,556, accounting for 16.2% and 12.7% of families, respectively.
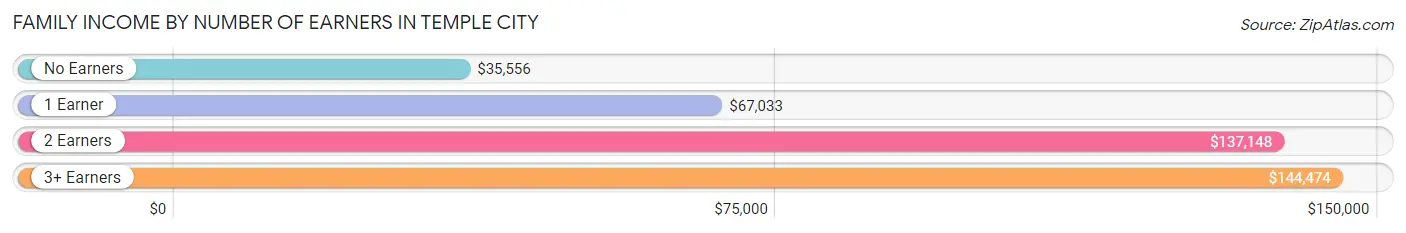
| Number of Earners | # Families | Median Income |
| No Earners | 1,182 (12.7%) | $35,556 |
| 1 Earner | 2,689 (28.9%) | $67,033 |
| 2 Earners | 3,925 (42.2%) | $137,148 |
| 3+ Earners | 1,504 (16.2%) | $144,474 |
| Total | 9,300 (100.0%) | $104,000 |
Household Income in Temple City
Household Income Brackets in Temple City
With 2,204 households falling in the category, the $100,000 to $149,999 income range is the most frequent in Temple City, accounting for 18.8% of all households. In contrast, only 305 households (2.6%) fall into the $10,000 to $14,999 income bracket, making it the least populous group.
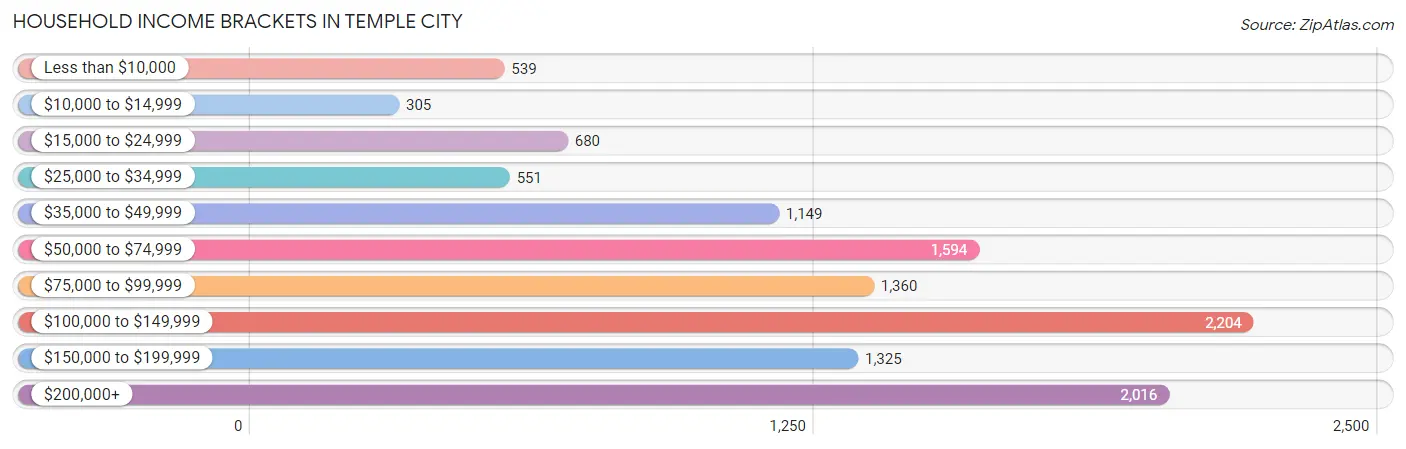
| Income Bracket | # Households | % Households |
| Less than $10,000 | 539 | 4.6% |
| $10,000 to $14,999 | 305 | 2.6% |
| $15,000 to $24,999 | 680 | 5.8% |
| $25,000 to $34,999 | 551 | 4.7% |
| $35,000 to $49,999 | 1,149 | 9.8% |
| $50,000 to $74,999 | 1,594 | 13.6% |
| $75,000 to $99,999 | 1,360 | 11.6% |
| $100,000 to $149,999 | 2,204 | 18.8% |
| $150,000 to $199,999 | 1,325 | 11.3% |
| $200,000+ | 2,016 | 17.2% |
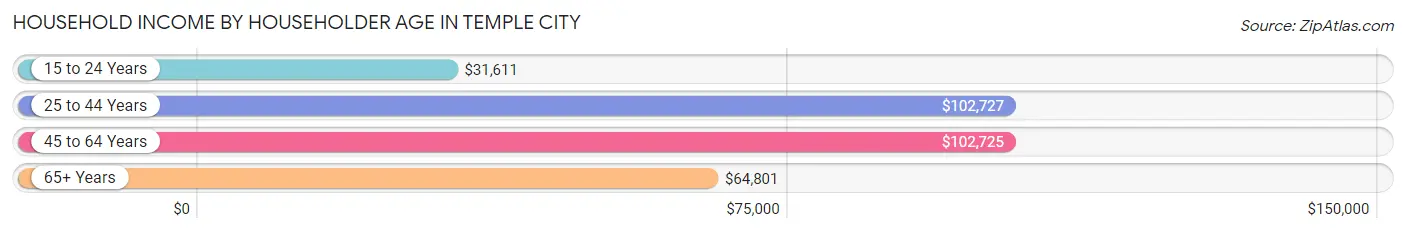
Household Income by Householder Age in Temple City
The median household income in Temple City is $95,263, with the highest median household income of $102,727 found in the 25 to 44 years age bracket for the primary householder. A total of 3,282 households (28.0%) fall into this category. Meanwhile, the 15 to 24 years age bracket for the primary householder has the lowest median household income of $31,611, with 119 households (1.0%) in this group.
| Income Bracket | # Households | Median Income |
| 15 to 24 Years | 119 (1.0%) | $31,611 |
| 25 to 44 Years | 3,282 (28.0%) | $102,727 |
| 45 to 64 Years | 5,414 (46.2%) | $102,725 |
| 65+ Years | 2,907 (24.8%) | $64,801 |
| Total | 11,722 (100.0%) | $95,263 |
Poverty in Temple City
Income Below Poverty by Sex and Age in Temple City
With 9.7% poverty level for males and 10.5% for females among the residents of Temple City, 15 year old males and 5 year old females are the most vulnerable to poverty, with 28 males (19.1%) and 17 females (26.6%) in their respective age groups living below the poverty level.
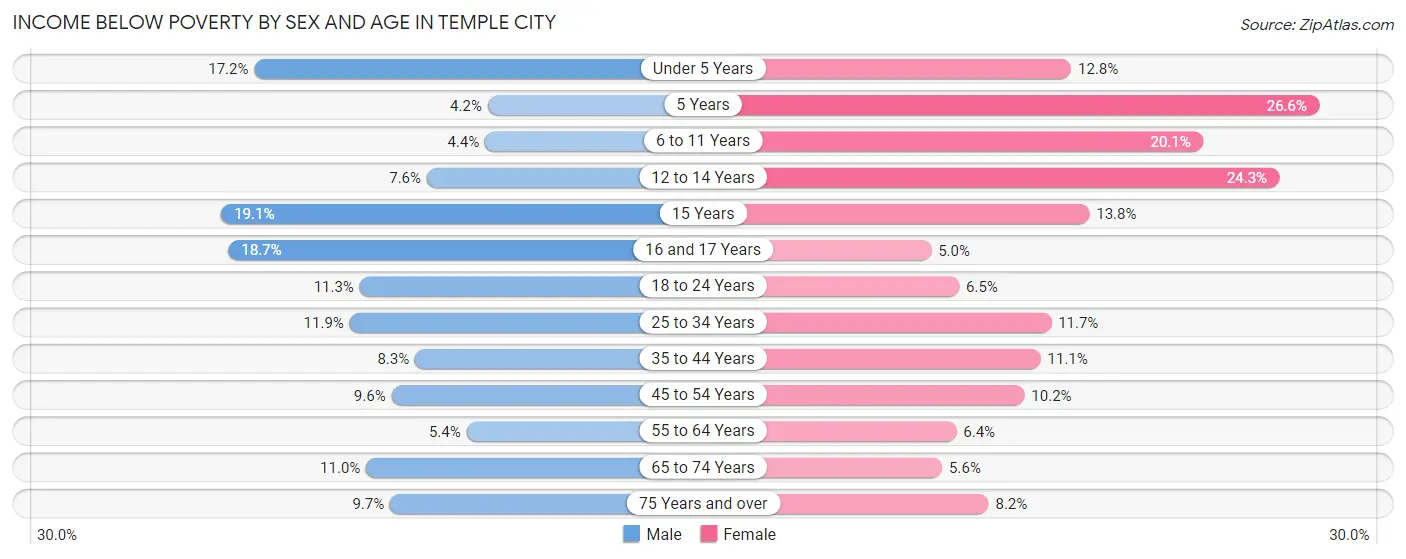
| Age Bracket | Male | Female |
| Under 5 Years | 170 (17.2%) | 119 (12.8%) |
| 5 Years | 9 (4.2%) | 17 (26.6%) |
| 6 to 11 Years | 46 (4.4%) | 303 (20.1%) |
| 12 to 14 Years | 52 (7.6%) | 174 (24.3%) |
| 15 Years | 28 (19.1%) | 47 (13.8%) |
| 16 and 17 Years | 80 (18.6%) | 20 (5.0%) |
| 18 to 24 Years | 159 (11.3%) | 77 (6.5%) |
| 25 to 34 Years | 230 (11.9%) | 240 (11.7%) |
| 35 to 44 Years | 190 (8.3%) | 269 (11.1%) |
| 45 to 54 Years | 255 (9.6%) | 303 (10.2%) |
| 55 to 64 Years | 126 (5.4%) | 152 (6.4%) |
| 65 to 74 Years | 189 (11.0%) | 117 (5.6%) |
| 75 Years and over | 98 (9.7%) | 126 (8.2%) |
| Total | 1,632 (9.7%) | 1,964 (10.5%) |
Income Above Poverty by Sex and Age in Temple City
According to the poverty statistics in Temple City, males aged 5 years and females aged 16 and 17 years are the age groups that are most secure financially, with 95.8% of males and 95.0% of females in these age groups living above the poverty line.
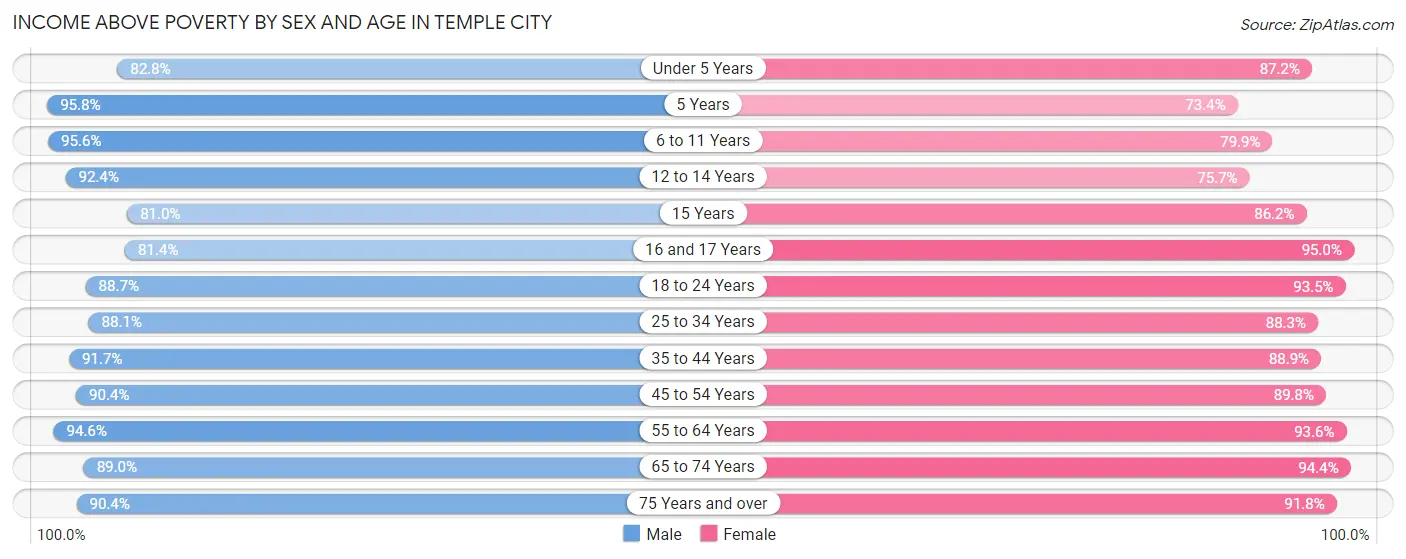
| Age Bracket | Male | Female |
| Under 5 Years | 818 (82.8%) | 813 (87.2%) |
| 5 Years | 205 (95.8%) | 47 (73.4%) |
| 6 to 11 Years | 1,008 (95.6%) | 1,205 (79.9%) |
| 12 to 14 Years | 632 (92.4%) | 541 (75.7%) |
| 15 Years | 119 (80.9%) | 294 (86.2%) |
| 16 and 17 Years | 349 (81.4%) | 382 (95.0%) |
| 18 to 24 Years | 1,243 (88.7%) | 1,103 (93.5%) |
| 25 to 34 Years | 1,702 (88.1%) | 1,819 (88.3%) |
| 35 to 44 Years | 2,109 (91.7%) | 2,161 (88.9%) |
| 45 to 54 Years | 2,409 (90.4%) | 2,675 (89.8%) |
| 55 to 64 Years | 2,212 (94.6%) | 2,231 (93.6%) |
| 65 to 74 Years | 1,532 (89.0%) | 1,977 (94.4%) |
| 75 Years and over | 918 (90.3%) | 1,416 (91.8%) |
| Total | 15,256 (90.3%) | 16,664 (89.5%) |
Income Below Poverty Among Married-Couple Families in Temple City
The poverty statistics for married-couple families in Temple City show that 5.2% or 346 of the total 6,619 families live below the poverty line. Families with 3 or 4 children have the highest poverty rate of 17.4%, comprising of 64 families. On the other hand, families with 5 or more children have the lowest poverty rate of 0.0%, which includes 0 families.
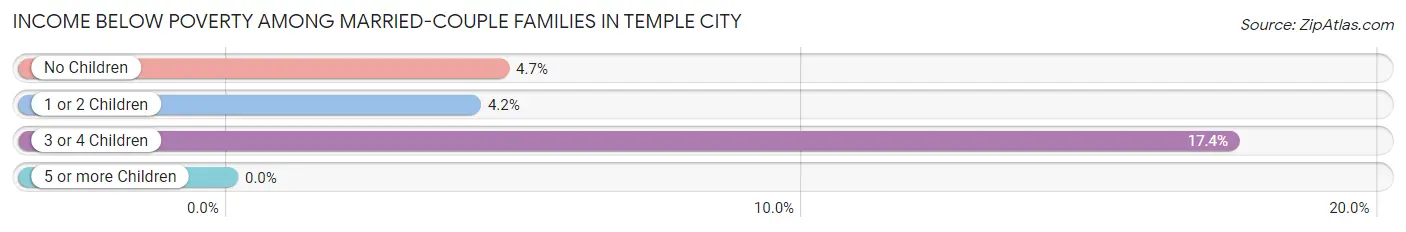
| Children | Above Poverty | Below Poverty |
| No Children | 3,408 (95.3%) | 169 (4.7%) |
| 1 or 2 Children | 2,557 (95.8%) | 113 (4.2%) |
| 3 or 4 Children | 303 (82.6%) | 64 (17.4%) |
| 5 or more Children | 5 (100.0%) | 0 (0.0%) |
| Total | 6,273 (94.8%) | 346 (5.2%) |
Income Below Poverty Among Single-Parent Households in Temple City
According to the poverty data in Temple City, 14.8% or 158 single-father households and 17.0% or 275 single-mother households are living below the poverty line. Among single-father households, those with 3 or 4 children have the highest poverty rate, with 63 households (74.1%) experiencing poverty. Likewise, among single-mother households, those with 3 or 4 children have the highest poverty rate, with 48 households (66.7%) falling below the poverty line.
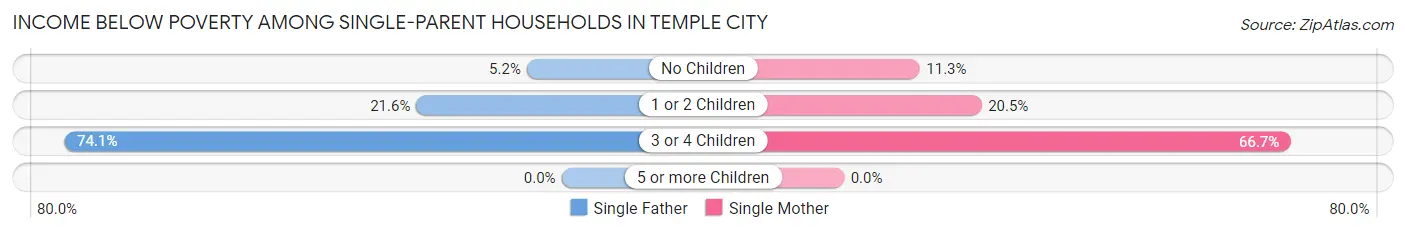
| Children | Single Father | Single Mother |
| No Children | 37 (5.2%) | 109 (11.3%) |
| 1 or 2 Children | 58 (21.6%) | 118 (20.5%) |
| 3 or 4 Children | 63 (74.1%) | 48 (66.7%) |
| 5 or more Children | 0 (0.0%) | 0 (0.0%) |
| Total | 158 (14.8%) | 275 (17.0%) |
Income Below Poverty Among Married-Couple vs Single-Parent Households in Temple City
The poverty data for Temple City shows that 346 of the married-couple family households (5.2%) and 433 of the single-parent households (16.2%) are living below the poverty level. Within the married-couple family households, those with 3 or 4 children have the highest poverty rate, with 64 households (17.4%) falling below the poverty line. Among the single-parent households, those with 3 or 4 children have the highest poverty rate, with 111 household (70.7%) living below poverty.
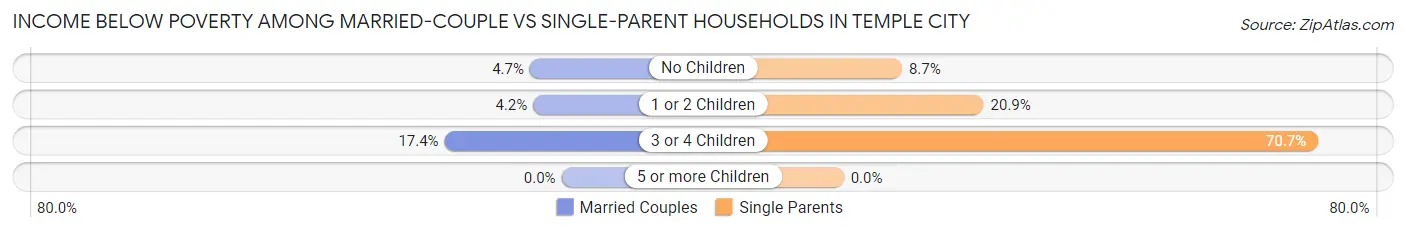
| Children | Married-Couple Families | Single-Parent Households |
| No Children | 169 (4.7%) | 146 (8.7%) |
| 1 or 2 Children | 113 (4.2%) | 176 (20.8%) |
| 3 or 4 Children | 64 (17.4%) | 111 (70.7%) |
| 5 or more Children | 0 (0.0%) | 0 (0.0%) |
| Total | 346 (5.2%) | 433 (16.2%) |
Race in Temple City
The most populous races in Temple City are Asian (23,689 | 65.5%), White / Caucasian (6,846 | 18.9%), and Hispanic or Latino (6,403 | 17.7%).
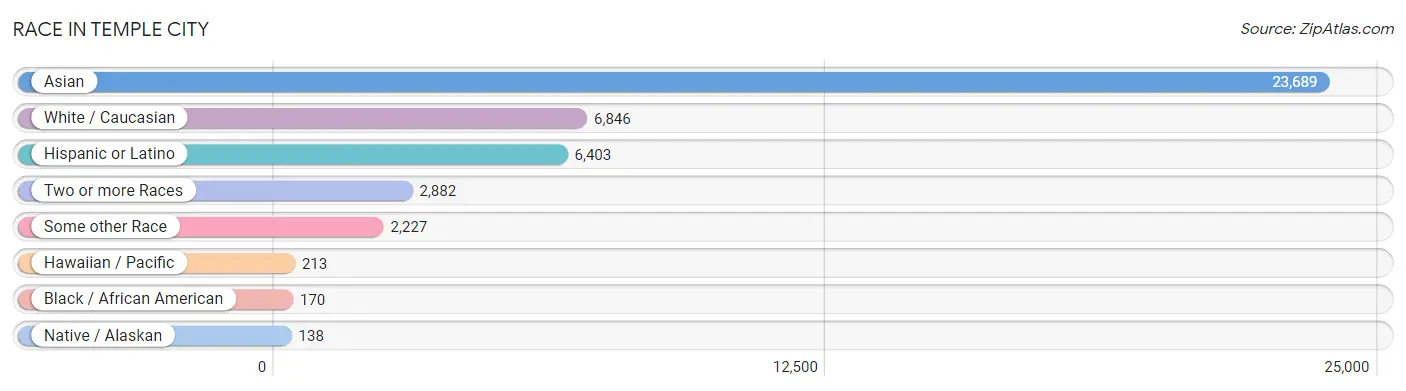
| Race | # Population | % Population |
| Asian | 23,689 | 65.5% |
| Black / African American | 170 | 0.5% |
| Hawaiian / Pacific | 213 | 0.6% |
| Hispanic or Latino | 6,403 | 17.7% |
| Native / Alaskan | 138 | 0.4% |
| White / Caucasian | 6,846 | 18.9% |
| Two or more Races | 2,882 | 8.0% |
| Some other Race | 2,227 | 6.2% |
| Total | 36,165 | 100.0% |
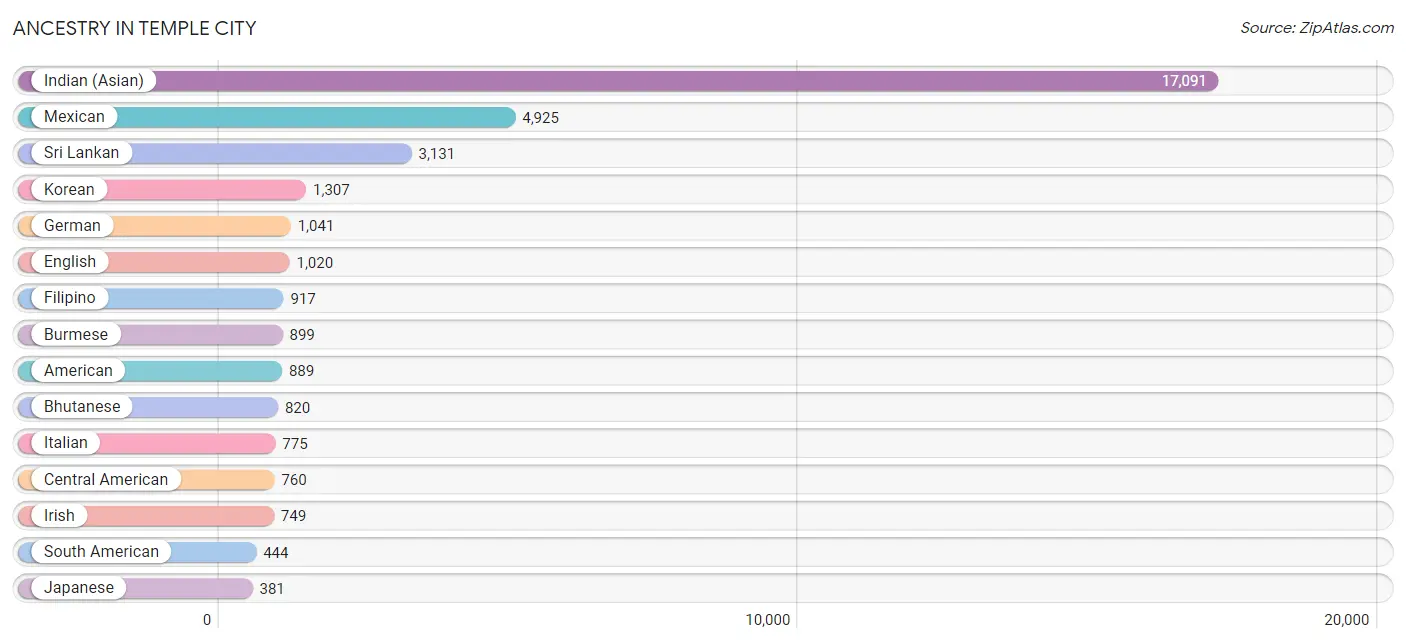
Ancestry in Temple City
The most populous ancestries reported in Temple City are Indian (Asian) (17,091 | 47.3%), Mexican (4,925 | 13.6%), Sri Lankan (3,131 | 8.7%), Korean (1,307 | 3.6%), and German (1,041 | 2.9%), together accounting for 76.0% of all Temple City residents.
| Ancestry | # Population | % Population |
| Afghan | 8 | 0.0% |
| American | 889 | 2.5% |
| Arab | 79 | 0.2% |
| Argentinean | 49 | 0.1% |
| Armenian | 78 | 0.2% |
| Austrian | 9 | 0.0% |
| Bangladeshi | 18 | 0.1% |
| Belgian | 9 | 0.0% |
| Bhutanese | 820 | 2.3% |
| Brazilian | 5 | 0.0% |
| British | 83 | 0.2% |
| Burmese | 899 | 2.5% |
| Canadian | 8 | 0.0% |
| Central American | 760 | 2.1% |
| Cherokee | 90 | 0.3% |
| Chilean | 107 | 0.3% |
| Colombian | 82 | 0.2% |
| Costa Rican | 56 | 0.2% |
| Creek | 16 | 0.0% |
| Croatian | 10 | 0.0% |
| Cuban | 46 | 0.1% |
| Czech | 17 | 0.1% |
| Danish | 32 | 0.1% |
| Dutch | 208 | 0.6% |
| Eastern European | 52 | 0.1% |
| Ecuadorian | 20 | 0.1% |
| Egyptian | 16 | 0.0% |
| English | 1,020 | 2.8% |
| European | 228 | 0.6% |
| Filipino | 917 | 2.5% |
| Finnish | 63 | 0.2% |
| French | 209 | 0.6% |
| French Canadian | 48 | 0.1% |
| German | 1,041 | 2.9% |
| Greek | 58 | 0.2% |
| Guatemalan | 223 | 0.6% |
| Hungarian | 90 | 0.3% |
| Indian (Asian) | 17,091 | 47.3% |
| Indonesian | 110 | 0.3% |
| Iranian | 133 | 0.4% |
| Irish | 749 | 2.1% |
| Italian | 775 | 2.1% |
| Jamaican | 62 | 0.2% |
| Japanese | 381 | 1.1% |
| Korean | 1,307 | 3.6% |
| Laotian | 306 | 0.9% |
| Lithuanian | 36 | 0.1% |
| Malaysian | 18 | 0.1% |
| Mexican | 4,925 | 13.6% |
| Mexican American Indian | 237 | 0.7% |
| Mongolian | 89 | 0.3% |
| Native Hawaiian | 5 | 0.0% |
| Navajo | 66 | 0.2% |
| Nicaraguan | 168 | 0.5% |
| Nigerian | 26 | 0.1% |
| Northern European | 51 | 0.1% |
| Norwegian | 89 | 0.3% |
| Pakistani | 105 | 0.3% |
| Panamanian | 21 | 0.1% |
| Peruvian | 186 | 0.5% |
| Polish | 260 | 0.7% |
| Portuguese | 55 | 0.2% |
| Puerto Rican | 18 | 0.1% |
| Russian | 71 | 0.2% |
| Salvadoran | 292 | 0.8% |
| Samoan | 1 | 0.0% |
| Scandinavian | 19 | 0.1% |
| Scotch-Irish | 37 | 0.1% |
| Scottish | 183 | 0.5% |
| Serbian | 18 | 0.1% |
| Slavic | 8 | 0.0% |
| Slovene | 9 | 0.0% |
| South African | 156 | 0.4% |
| South American | 444 | 1.2% |
| South American Indian | 43 | 0.1% |
| Spaniard | 30 | 0.1% |
| Spanish | 30 | 0.1% |
| Spanish American Indian | 104 | 0.3% |
| Sri Lankan | 3,131 | 8.7% |
| Subsaharan African | 187 | 0.5% |
| Swedish | 111 | 0.3% |
| Swiss | 18 | 0.1% |
| Syrian | 63 | 0.2% |
| Thai | 310 | 0.9% |
| Ukrainian | 38 | 0.1% |
| Vietnamese | 41 | 0.1% |
| Welsh | 61 | 0.2% |
| Yaqui | 69 | 0.2% |
| Yugoslavian | 10 | 0.0% | View All 89 Rows |
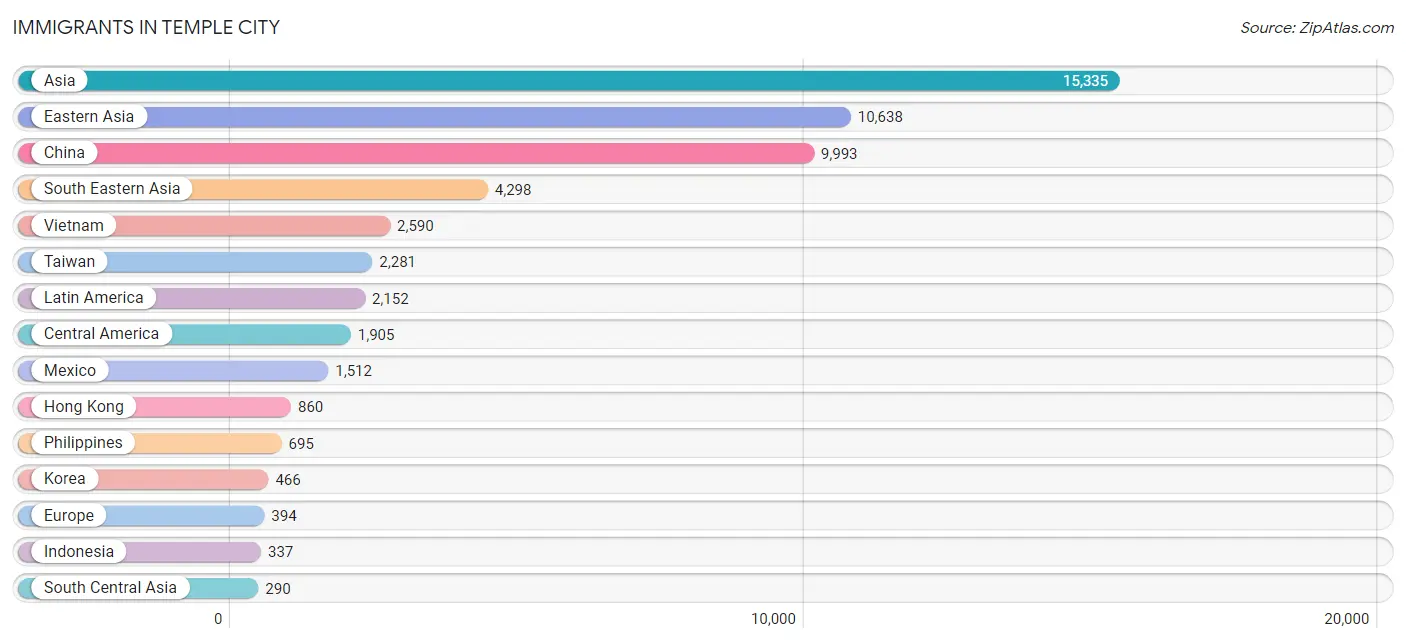
Immigrants in Temple City
The most numerous immigrant groups reported in Temple City came from Asia (15,335 | 42.4%), Eastern Asia (10,638 | 29.4%), China (9,993 | 27.6%), South Eastern Asia (4,298 | 11.9%), and Vietnam (2,590 | 7.2%), together accounting for 118.5% of all Temple City residents.
| Immigration Origin | # Population | % Population |
| Afghanistan | 8 | 0.0% |
| Africa | 141 | 0.4% |
| Argentina | 49 | 0.1% |
| Armenia | 17 | 0.1% |
| Asia | 15,335 | 42.4% |
| Bangladesh | 27 | 0.1% |
| Brazil | 28 | 0.1% |
| Cambodia | 252 | 0.7% |
| Canada | 43 | 0.1% |
| Central America | 1,905 | 5.3% |
| Chile | 51 | 0.1% |
| China | 9,993 | 27.6% |
| Colombia | 28 | 0.1% |
| Croatia | 4 | 0.0% |
| Czechoslovakia | 16 | 0.0% |
| Eastern Africa | 2 | 0.0% |
| Eastern Asia | 10,638 | 29.4% |
| Eastern Europe | 173 | 0.5% |
| Egypt | 16 | 0.0% |
| El Salvador | 112 | 0.3% |
| England | 14 | 0.0% |
| Europe | 394 | 1.1% |
| Fiji | 109 | 0.3% |
| Greece | 102 | 0.3% |
| Guatemala | 118 | 0.3% |
| Hong Kong | 860 | 2.4% |
| Hungary | 59 | 0.2% |
| India | 145 | 0.4% |
| Indonesia | 337 | 0.9% |
| Iran | 95 | 0.3% |
| Iraq | 12 | 0.0% |
| Italy | 15 | 0.0% |
| Japan | 179 | 0.5% |
| Korea | 466 | 1.3% |
| Kuwait | 17 | 0.1% |
| Laos | 7 | 0.0% |
| Latin America | 2,152 | 5.9% |
| Lebanon | 25 | 0.1% |
| Malaysia | 144 | 0.4% |
| Mexico | 1,512 | 4.2% |
| Netherlands | 69 | 0.2% |
| Nicaragua | 142 | 0.4% |
| Nigeria | 26 | 0.1% |
| Northern Africa | 16 | 0.0% |
| Northern Europe | 26 | 0.1% |
| Oceania | 110 | 0.3% |
| Pakistan | 15 | 0.0% |
| Panama | 21 | 0.1% |
| Peru | 91 | 0.3% |
| Philippines | 695 | 1.9% |
| Poland | 13 | 0.0% |
| Russia | 35 | 0.1% |
| Singapore | 14 | 0.0% |
| South Africa | 97 | 0.3% |
| South America | 247 | 0.7% |
| South Central Asia | 290 | 0.8% |
| South Eastern Asia | 4,298 | 11.9% |
| Southern Europe | 126 | 0.4% |
| Spain | 9 | 0.0% |
| Sweden | 5 | 0.0% |
| Syria | 18 | 0.1% |
| Taiwan | 2,281 | 6.3% |
| Thailand | 87 | 0.2% |
| Ukraine | 46 | 0.1% |
| Vietnam | 2,590 | 7.2% |
| Western Africa | 26 | 0.1% |
| Western Asia | 89 | 0.3% |
| Western Europe | 69 | 0.2% | View All 68 Rows |
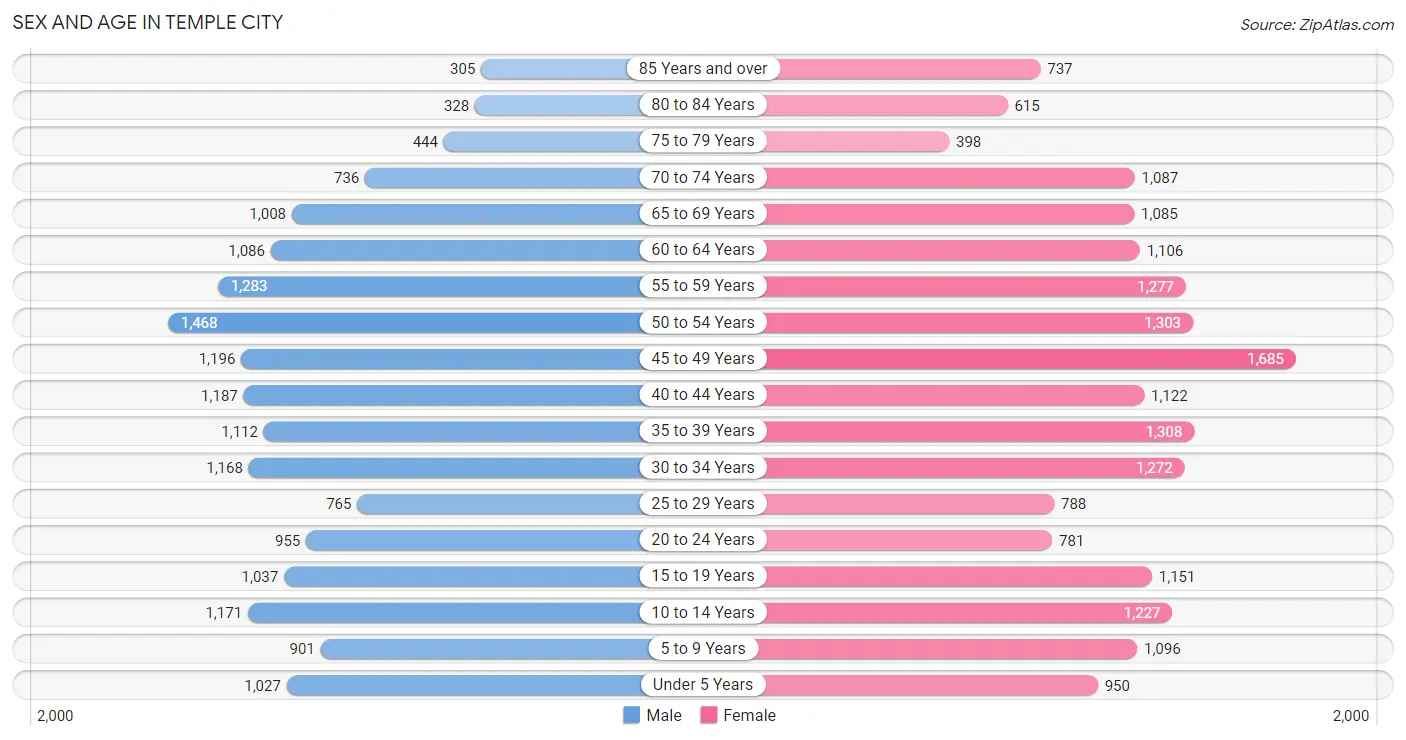
Sex and Age in Temple City
Sex and Age in Temple City
The most populous age groups in Temple City are 50 to 54 Years (1,468 | 8.6%) for men and 45 to 49 Years (1,685 | 8.9%) for women.
| Age Bracket | Male | Female |
| Under 5 Years | 1,027 (6.0%) | 950 (5.0%) |
| 5 to 9 Years | 901 (5.2%) | 1,096 (5.8%) |
| 10 to 14 Years | 1,171 (6.8%) | 1,227 (6.5%) |
| 15 to 19 Years | 1,037 (6.0%) | 1,151 (6.1%) |
| 20 to 24 Years | 955 (5.6%) | 781 (4.1%) |
| 25 to 29 Years | 765 (4.4%) | 788 (4.2%) |
| 30 to 34 Years | 1,168 (6.8%) | 1,272 (6.7%) |
| 35 to 39 Years | 1,112 (6.5%) | 1,308 (6.9%) |
| 40 to 44 Years | 1,187 (6.9%) | 1,122 (5.9%) |
| 45 to 49 Years | 1,196 (7.0%) | 1,685 (8.9%) |
| 50 to 54 Years | 1,468 (8.6%) | 1,303 (6.9%) |
| 55 to 59 Years | 1,283 (7.5%) | 1,277 (6.7%) |
| 60 to 64 Years | 1,086 (6.3%) | 1,106 (5.8%) |
| 65 to 69 Years | 1,008 (5.9%) | 1,085 (5.7%) |
| 70 to 74 Years | 736 (4.3%) | 1,087 (5.7%) |
| 75 to 79 Years | 444 (2.6%) | 398 (2.1%) |
| 80 to 84 Years | 328 (1.9%) | 615 (3.2%) |
| 85 Years and over | 305 (1.8%) | 737 (3.9%) |
| Total | 17,177 (100.0%) | 18,988 (100.0%) |
Families and Households in Temple City
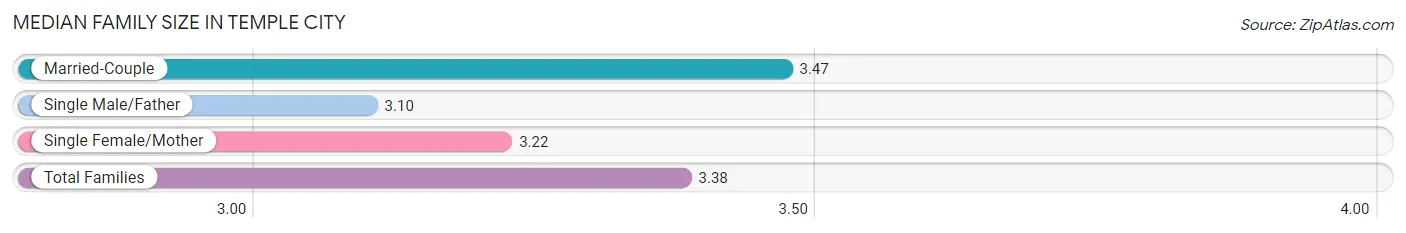
Median Family Size in Temple City
The median family size in Temple City is 3.38 persons per family, with married-couple families (6,619 | 71.2%) accounting for the largest median family size of 3.47 persons per family. On the other hand, single male/father families (1,067 | 11.5%) represent the smallest median family size with 3.10 persons per family.
| Family Type | # Families | Family Size |
| Married-Couple | 6,619 (71.2%) | 3.47 |
| Single Male/Father | 1,067 (11.5%) | 3.10 |
| Single Female/Mother | 1,614 (17.3%) | 3.22 |
| Total Families | 9,300 (100.0%) | 3.38 |
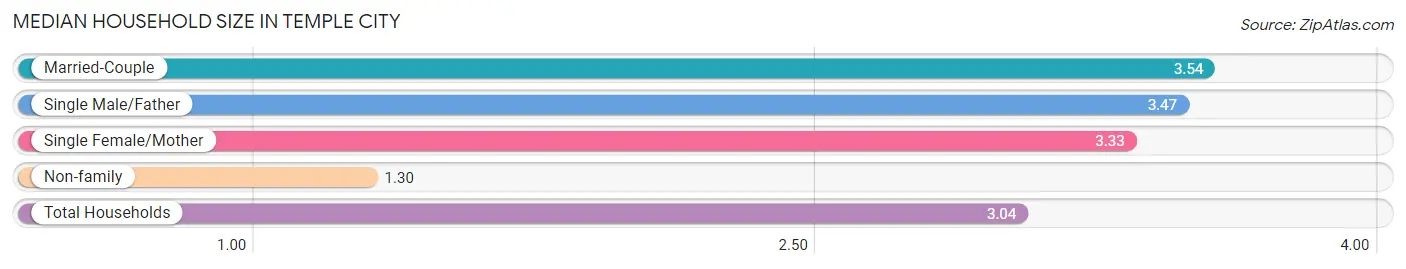
Median Household Size in Temple City
The median household size in Temple City is 3.04 persons per household, with married-couple households (6,619 | 56.5%) accounting for the largest median household size of 3.54 persons per household. non-family households (2,422 | 20.7%) represent the smallest median household size with 1.30 persons per household.
| Household Type | # Households | Household Size |
| Married-Couple | 6,619 (56.5%) | 3.54 |
| Single Male/Father | 1,067 (9.1%) | 3.47 |
| Single Female/Mother | 1,614 (13.8%) | 3.33 |
| Non-family | 2,422 (20.7%) | 1.30 |
| Total Households | 11,722 (100.0%) | 3.04 |
Household Size by Marriage Status in Temple City
Out of a total of 11,722 households in Temple City, 9,300 (79.3%) are family households, while 2,422 (20.7%) are nonfamily households. The most numerous type of family households are 2-person households, comprising 2,877, and the most common type of nonfamily households are 1-person households, comprising 1,909.
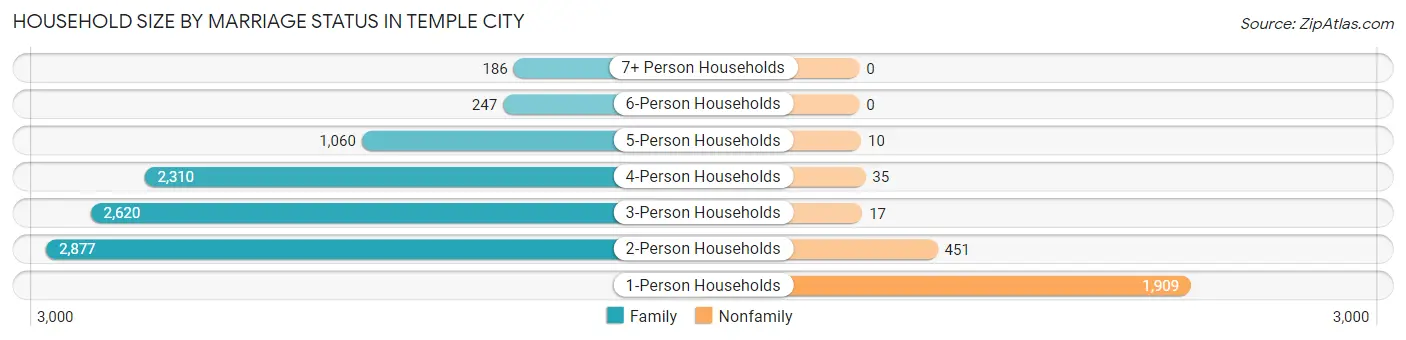
| Household Size | Family Households | Nonfamily Households |
| 1-Person Households | - | 1,909 (16.3%) |
| 2-Person Households | 2,877 (24.5%) | 451 (3.8%) |
| 3-Person Households | 2,620 (22.4%) | 17 (0.2%) |
| 4-Person Households | 2,310 (19.7%) | 35 (0.3%) |
| 5-Person Households | 1,060 (9.0%) | 10 (0.1%) |
| 6-Person Households | 247 (2.1%) | 0 (0.0%) |
| 7+ Person Households | 186 (1.6%) | 0 (0.0%) |
| Total | 9,300 (79.3%) | 2,422 (20.7%) |
Female Fertility in Temple City
Fertility by Age in Temple City
Average fertility rate in Temple City is 33.0 births per 1,000 women. Women in the age bracket of 20 to 34 years have the highest fertility rate with 54.0 births per 1,000 women. Women in the age bracket of 20 to 34 years acount for 56.2% of all women with births.
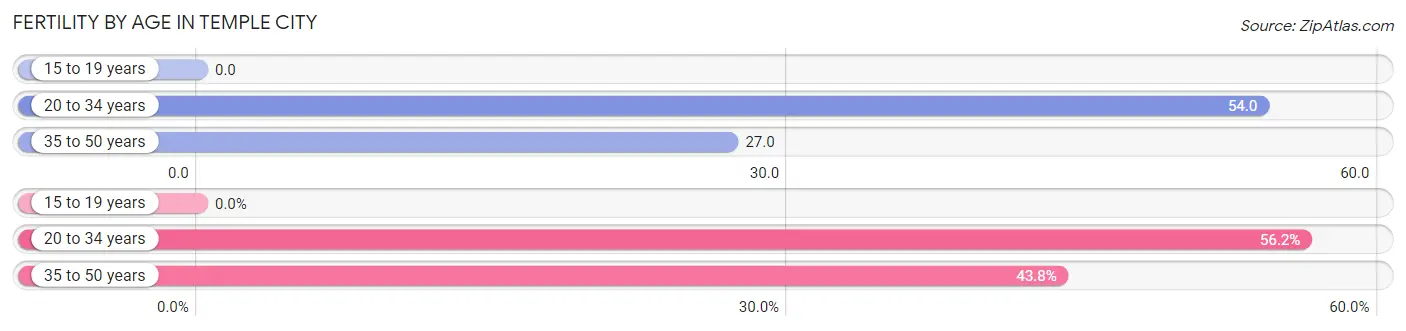
| Age Bracket | Women with Births | Births / 1,000 Women |
| 15 to 19 years | 0 (0.0%) | 0.0 |
| 20 to 34 years | 154 (56.2%) | 54.0 |
| 35 to 50 years | 120 (43.8%) | 27.0 |
| Total | 274 (100.0%) | 33.0 |
Fertility by Age by Marriage Status in Temple City
92.0% of women with births (274) in Temple City are married. The highest percentage of unmarried women with births falls into 20 to 34 years age bracket with 14.3% of them unmarried at the time of birth, while the lowest percentage of unmarried women with births belong to 35 to 50 years age bracket with 0.0% of them unmarried.
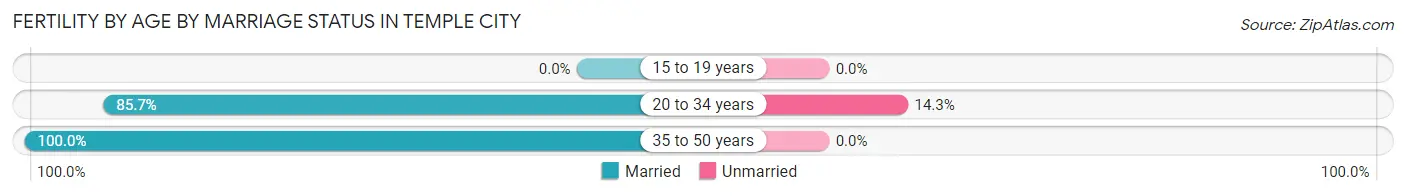
| Age Bracket | Married | Unmarried |
| 15 to 19 years | 0 (0.0%) | 0 (0.0%) |
| 20 to 34 years | 132 (85.7%) | 22 (14.3%) |
| 35 to 50 years | 120 (100.0%) | 0 (0.0%) |
| Total | 252 (92.0%) | 22 (8.0%) |
Fertility by Education in Temple City
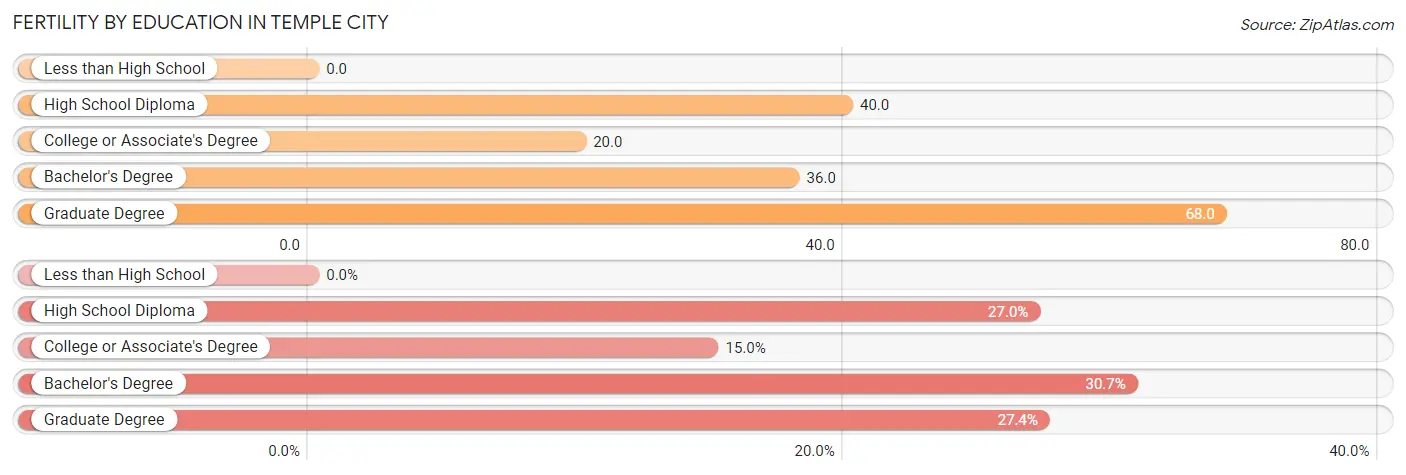
| Educational Attainment | Women with Births | Births / 1,000 Women |
| Less than High School | 0 (0.0%) | 0.0 |
| High School Diploma | 74 (27.0%) | 40.0 |
| College or Associate's Degree | 41 (15.0%) | 20.0 |
| Bachelor's Degree | 84 (30.7%) | 36.0 |
| Graduate Degree | 75 (27.4%) | 68.0 |
| Total | 274 (100.0%) | 33.0 |
Fertility by Education by Marriage Status in Temple City
8.0% of women with births in Temple City are unmarried. Women with the educational attainment of high school diploma are most likely to be married with 100.0% of them married at childbirth, while women with the educational attainment of college or associate's degree are least likely to be married with 53.7% of them unmarried at childbirth.
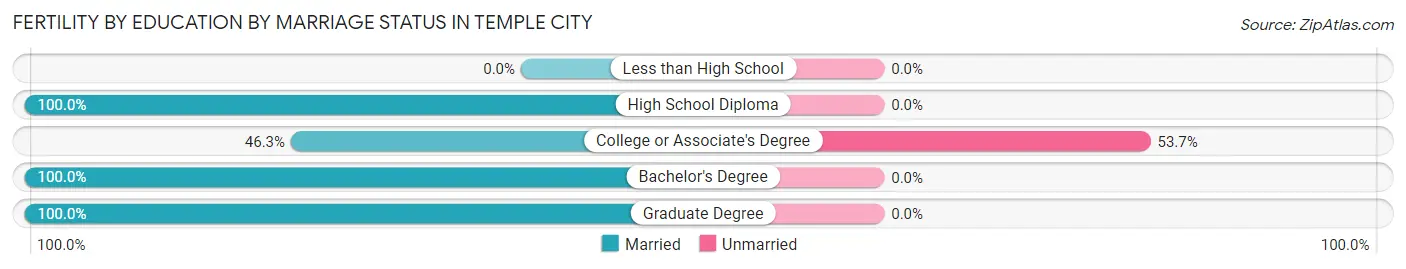
| Educational Attainment | Married | Unmarried |
| Less than High School | 0 (0.0%) | 0 (0.0%) |
| High School Diploma | 74 (100.0%) | 0 (0.0%) |
| College or Associate's Degree | 19 (46.3%) | 22 (53.7%) |
| Bachelor's Degree | 84 (100.0%) | 0 (0.0%) |
| Graduate Degree | 75 (100.0%) | 0 (0.0%) |
| Total | 252 (92.0%) | 22 (8.0%) |
Employment Characteristics in Temple City
Employment by Class of Employer in Temple City
Among the 16,395 employed individuals in Temple City, private company employees (10,694 | 65.2%), local government employees (1,395 | 8.5%), and not-for-profit organizations (1,187 | 7.2%) make up the most common classes of employment.
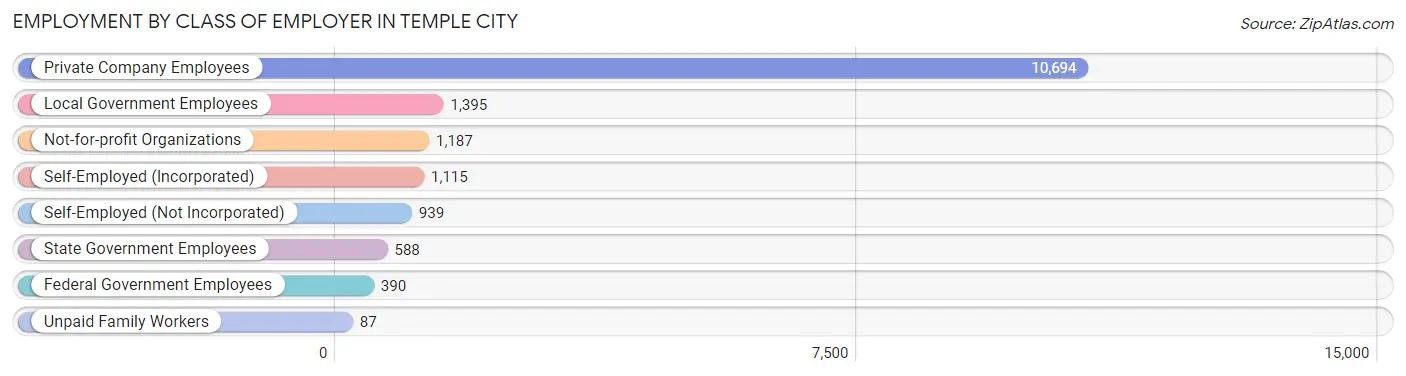
| Employer Class | # Employees | % Employees |
| Private Company Employees | 10,694 | 65.2% |
| Self-Employed (Incorporated) | 1,115 | 6.8% |
| Self-Employed (Not Incorporated) | 939 | 5.7% |
| Not-for-profit Organizations | 1,187 | 7.2% |
| Local Government Employees | 1,395 | 8.5% |
| State Government Employees | 588 | 3.6% |
| Federal Government Employees | 390 | 2.4% |
| Unpaid Family Workers | 87 | 0.5% |
| Total | 16,395 | 100.0% |
Employment Status by Age in Temple City
According to the labor force statistics for Temple City, out of the total population over 16 years of age (29,304), 61.1% or 17,905 individuals are in the labor force, with 6.2% or 1,110 of them unemployed. The age group with the highest labor force participation rate is 30 to 34 years, with 86.2% or 2,103 individuals in the labor force. Within the labor force, the 16 to 19 years age range has the highest percentage of unemployed individuals, with 25.9% or 100 of them being unemployed.
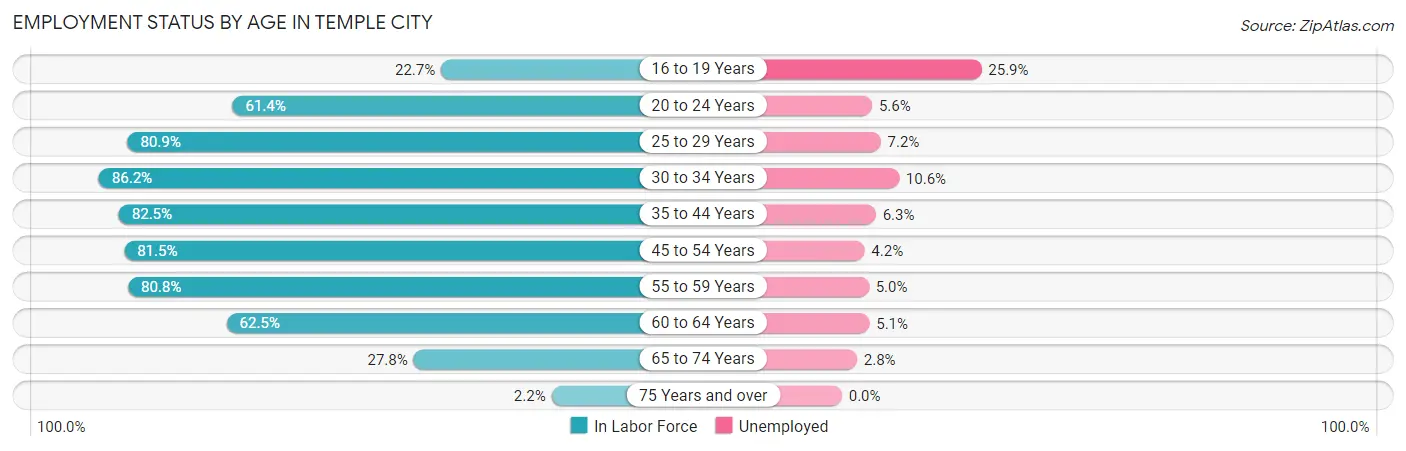
| Age Bracket | In Labor Force | Unemployed |
| 16 to 19 Years | 386 (22.7%) | 100 (25.9%) |
| 20 to 24 Years | 1,066 (61.4%) | 60 (5.6%) |
| 25 to 29 Years | 1,256 (80.9%) | 90 (7.2%) |
| 30 to 34 Years | 2,103 (86.2%) | 223 (10.6%) |
| 35 to 44 Years | 3,901 (82.5%) | 246 (6.3%) |
| 45 to 54 Years | 4,606 (81.5%) | 193 (4.2%) |
| 55 to 59 Years | 2,068 (80.8%) | 103 (5.0%) |
| 60 to 64 Years | 1,370 (62.5%) | 70 (5.1%) |
| 65 to 74 Years | 1,089 (27.8%) | 30 (2.8%) |
| 75 Years and over | 62 (2.2%) | 0 (0.0%) |
| Total | 17,905 (61.1%) | 1,110 (6.2%) |
Employment Status by Educational Attainment in Temple City
According to labor force statistics for Temple City, 80.0% of individuals (15,301) out of the total population between 25 and 64 years of age (19,126) are in the labor force, with 6.0% or 918 of them being unemployed. The group with the highest labor force participation rate are those with the educational attainment of bachelor's degree or higher, with 87.6% or 7,592 individuals in the labor force. Within the labor force, individuals with less than high school education have the highest percentage of unemployment, with 9.5% or 123 of them being unemployed.
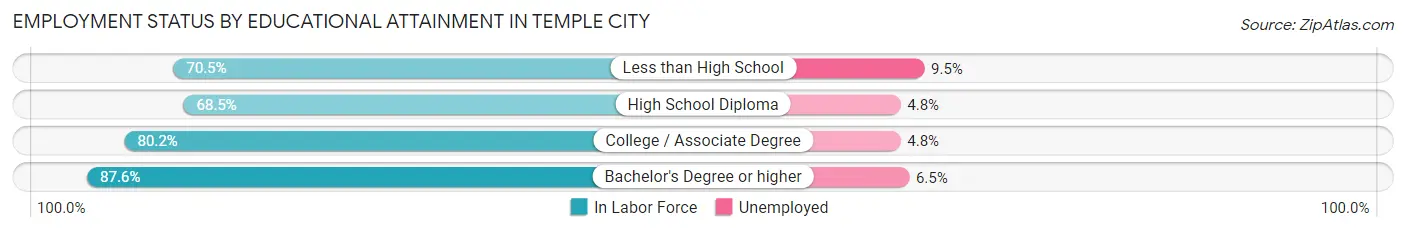
| Educational Attainment | In Labor Force | Unemployed |
| Less than High School | 1,292 (70.5%) | 174 (9.5%) |
| High School Diploma | 2,922 (68.5%) | 205 (4.8%) |
| College / Associate Degree | 3,498 (80.2%) | 209 (4.8%) |
| Bachelor's Degree or higher | 7,592 (87.6%) | 563 (6.5%) |
| Total | 15,301 (80.0%) | 1,148 (6.0%) |
Employment Occupations by Sex in Temple City
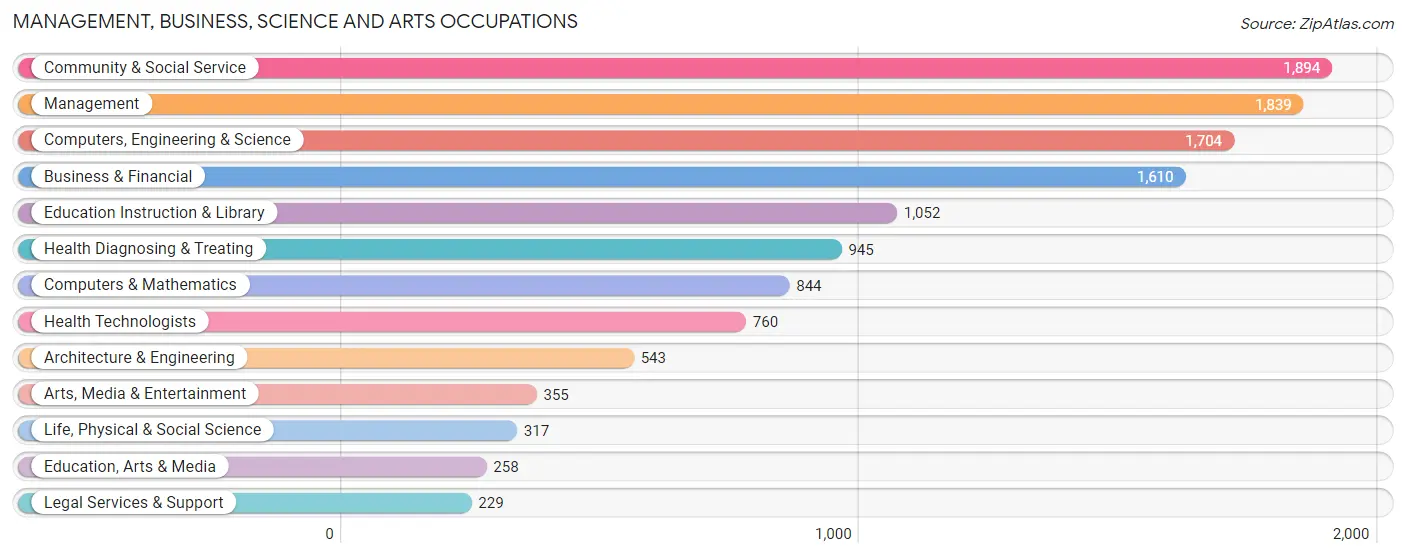
Management, Business, Science and Arts Occupations
The most common Management, Business, Science and Arts occupations in Temple City are Community & Social Service (1,894 | 11.3%), Management (1,839 | 11.0%), Computers, Engineering & Science (1,704 | 10.2%), Business & Financial (1,610 | 9.6%), and Education Instruction & Library (1,052 | 6.3%).
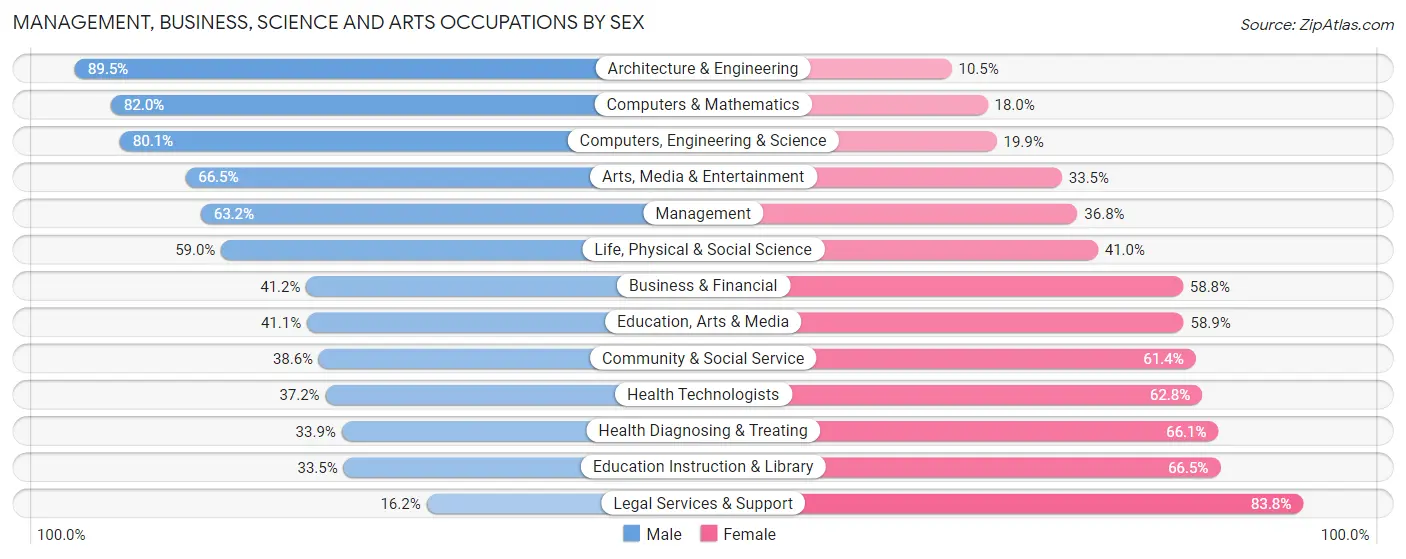
Management, Business, Science and Arts Occupations by Sex
Within the Management, Business, Science and Arts occupations in Temple City, the most male-oriented occupations are Architecture & Engineering (89.5%), Computers & Mathematics (82.0%), and Computers, Engineering & Science (80.1%), while the most female-oriented occupations are Legal Services & Support (83.8%), Education Instruction & Library (66.5%), and Health Diagnosing & Treating (66.1%).
| Occupation | Male | Female |
| Management | 1,163 (63.2%) | 676 (36.8%) |
| Business & Financial | 664 (41.2%) | 946 (58.8%) |
| Computers, Engineering & Science | 1,365 (80.1%) | 339 (19.9%) |
| Computers & Mathematics | 692 (82.0%) | 152 (18.0%) |
| Architecture & Engineering | 486 (89.5%) | 57 (10.5%) |
| Life, Physical & Social Science | 187 (59.0%) | 130 (41.0%) |
| Community & Social Service | 731 (38.6%) | 1,163 (61.4%) |
| Education, Arts & Media | 106 (41.1%) | 152 (58.9%) |
| Legal Services & Support | 37 (16.2%) | 192 (83.8%) |
| Education Instruction & Library | 352 (33.5%) | 700 (66.5%) |
| Arts, Media & Entertainment | 236 (66.5%) | 119 (33.5%) |
| Health Diagnosing & Treating | 320 (33.9%) | 625 (66.1%) |
| Health Technologists | 283 (37.2%) | 477 (62.8%) |
| Total (Category) | 4,243 (53.1%) | 3,749 (46.9%) |
| Total (Overall) | 8,840 (52.8%) | 7,913 (47.2%) |
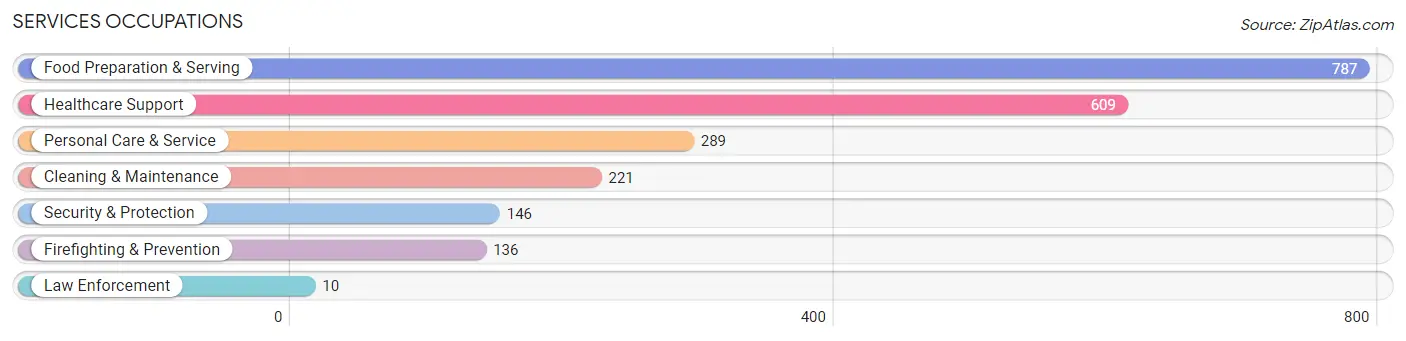
Services Occupations
The most common Services occupations in Temple City are Food Preparation & Serving (787 | 4.7%), Healthcare Support (609 | 3.6%), Personal Care & Service (289 | 1.7%), Cleaning & Maintenance (221 | 1.3%), and Security & Protection (146 | 0.9%).
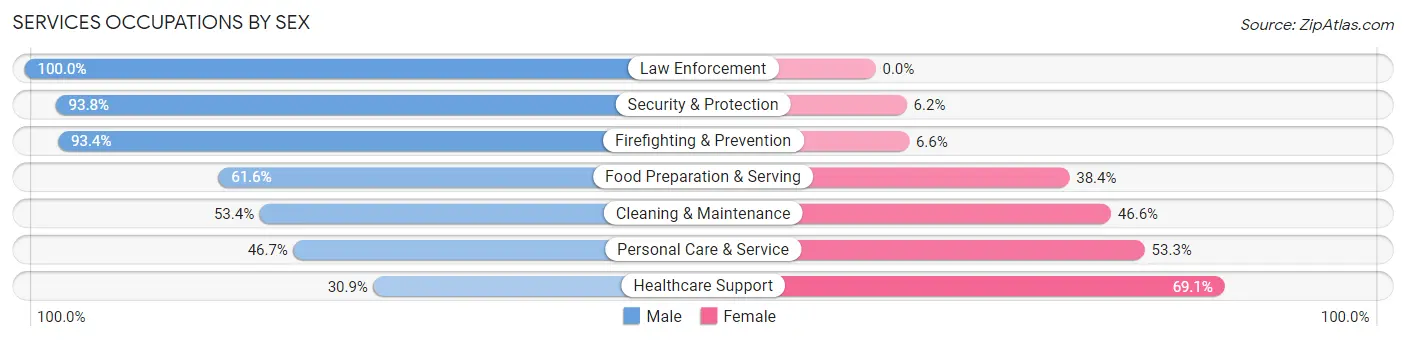
Services Occupations by Sex
Within the Services occupations in Temple City, the most male-oriented occupations are Law Enforcement (100.0%), Security & Protection (93.8%), and Firefighting & Prevention (93.4%), while the most female-oriented occupations are Healthcare Support (69.1%), Personal Care & Service (53.3%), and Cleaning & Maintenance (46.6%).
| Occupation | Male | Female |
| Healthcare Support | 188 (30.9%) | 421 (69.1%) |
| Security & Protection | 137 (93.8%) | 9 (6.2%) |
| Firefighting & Prevention | 127 (93.4%) | 9 (6.6%) |
| Law Enforcement | 10 (100.0%) | 0 (0.0%) |
| Food Preparation & Serving | 485 (61.6%) | 302 (38.4%) |
| Cleaning & Maintenance | 118 (53.4%) | 103 (46.6%) |
| Personal Care & Service | 135 (46.7%) | 154 (53.3%) |
| Total (Category) | 1,063 (51.8%) | 989 (48.2%) |
| Total (Overall) | 8,840 (52.8%) | 7,913 (47.2%) |
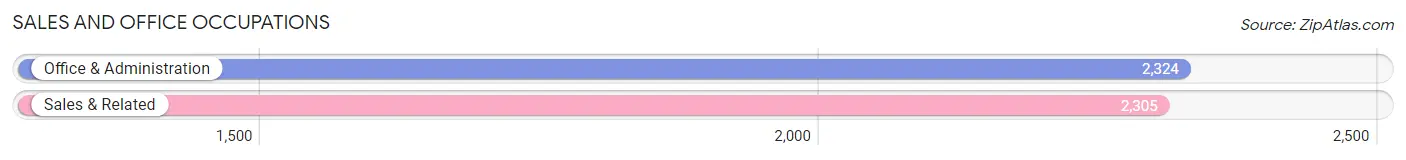
Sales and Office Occupations
The most common Sales and Office occupations in Temple City are Office & Administration (2,324 | 13.9%), and Sales & Related (2,305 | 13.8%).
Sales and Office Occupations by Sex
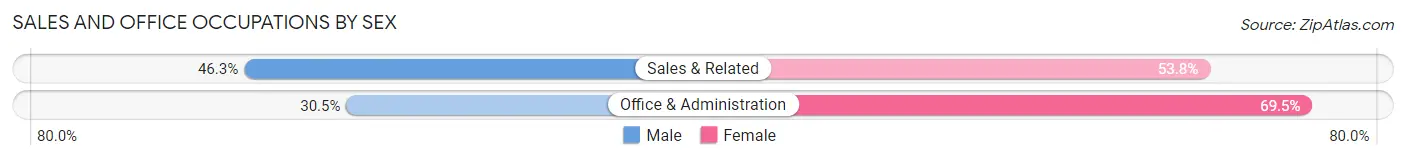
| Occupation | Male | Female |
| Sales & Related | 1,066 (46.3%) | 1,239 (53.7%) |
| Office & Administration | 709 (30.5%) | 1,615 (69.5%) |
| Total (Category) | 1,775 (38.4%) | 2,854 (61.7%) |
| Total (Overall) | 8,840 (52.8%) | 7,913 (47.2%) |
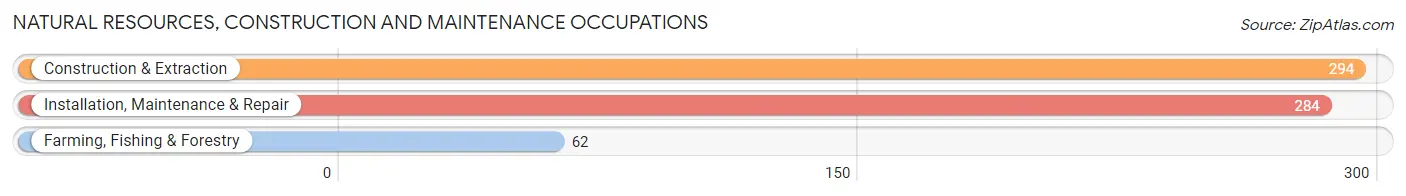
Natural Resources, Construction and Maintenance Occupations
The most common Natural Resources, Construction and Maintenance occupations in Temple City are Construction & Extraction (294 | 1.8%), Installation, Maintenance & Repair (284 | 1.7%), and Farming, Fishing & Forestry (62 | 0.4%).
Natural Resources, Construction and Maintenance Occupations by Sex
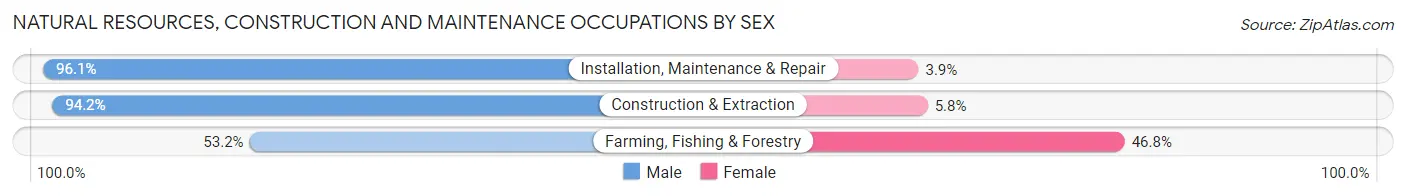
| Occupation | Male | Female |
| Farming, Fishing & Forestry | 33 (53.2%) | 29 (46.8%) |
| Construction & Extraction | 277 (94.2%) | 17 (5.8%) |
| Installation, Maintenance & Repair | 273 (96.1%) | 11 (3.9%) |
| Total (Category) | 583 (91.1%) | 57 (8.9%) |
| Total (Overall) | 8,840 (52.8%) | 7,913 (47.2%) |
Production, Transportation and Moving Occupations
The most common Production, Transportation and Moving occupations in Temple City are Transportation (597 | 3.6%), Production (556 | 3.3%), and Material Moving (287 | 1.7%).
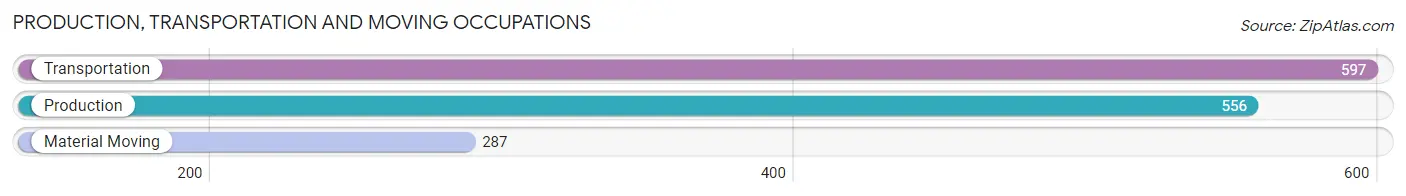
Production, Transportation and Moving Occupations by Sex
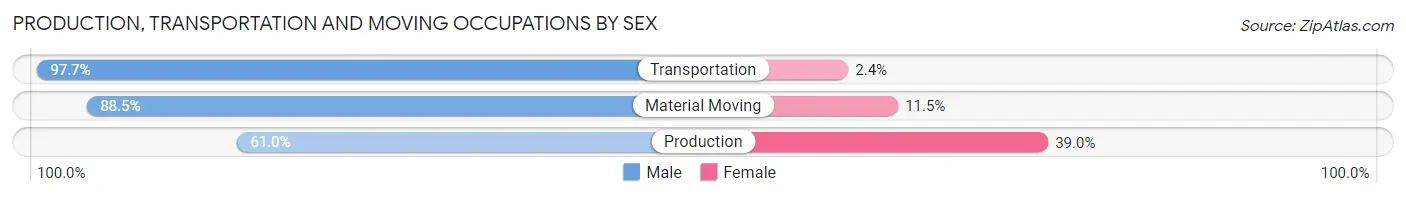
| Occupation | Male | Female |
| Production | 339 (61.0%) | 217 (39.0%) |
| Transportation | 583 (97.7%) | 14 (2.4%) |
| Material Moving | 254 (88.5%) | 33 (11.5%) |
| Total (Category) | 1,176 (81.7%) | 264 (18.3%) |
| Total (Overall) | 8,840 (52.8%) | 7,913 (47.2%) |
Employment Industries by Sex in Temple City
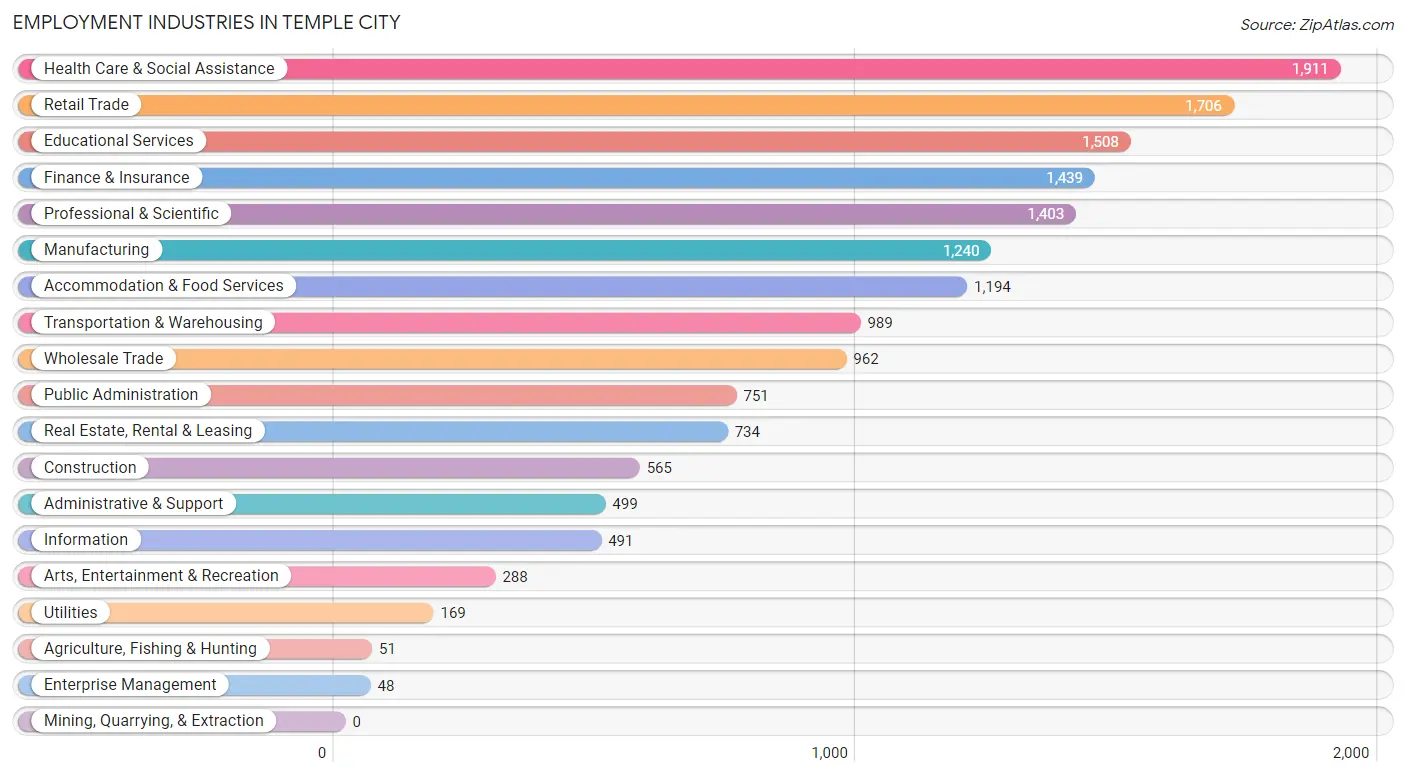
Employment Industries in Temple City
The major employment industries in Temple City include Health Care & Social Assistance (1,911 | 11.4%), Retail Trade (1,706 | 10.2%), Educational Services (1,508 | 9.0%), Finance & Insurance (1,439 | 8.6%), and Professional & Scientific (1,403 | 8.4%).
Employment Industries by Sex in Temple City
The Temple City industries that see more men than women are Agriculture, Fishing & Hunting (82.4%), Construction (81.8%), and Transportation & Warehousing (81.6%), whereas the industries that tend to have a higher number of women are Health Care & Social Assistance (63.9%), Finance & Insurance (63.9%), and Public Administration (62.8%).
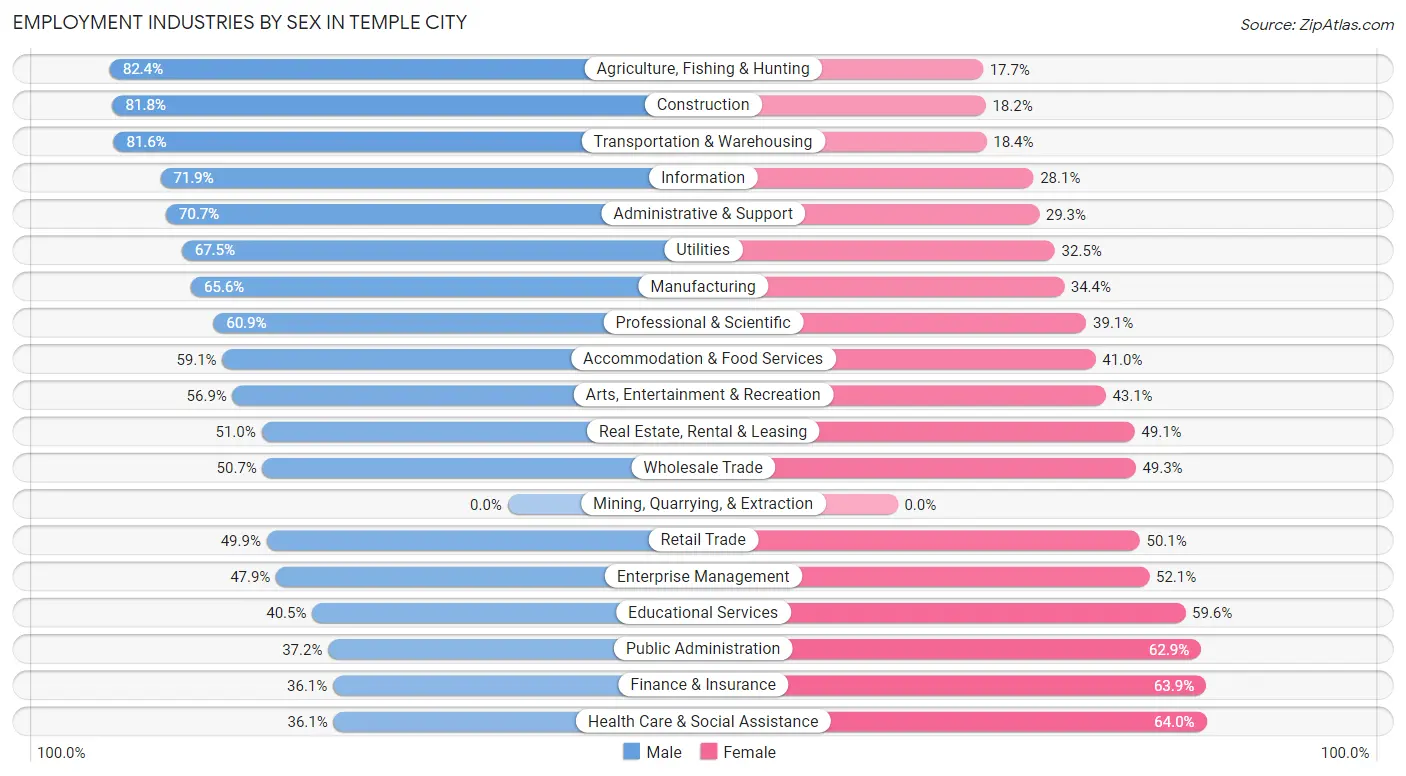
| Industry | Male | Female |
| Agriculture, Fishing & Hunting | 42 (82.4%) | 9 (17.6%) |
| Mining, Quarrying, & Extraction | 0 (0.0%) | 0 (0.0%) |
| Construction | 462 (81.8%) | 103 (18.2%) |
| Manufacturing | 813 (65.6%) | 427 (34.4%) |
| Wholesale Trade | 488 (50.7%) | 474 (49.3%) |
| Retail Trade | 851 (49.9%) | 855 (50.1%) |
| Transportation & Warehousing | 807 (81.6%) | 182 (18.4%) |
| Utilities | 114 (67.5%) | 55 (32.5%) |
| Information | 353 (71.9%) | 138 (28.1%) |
| Finance & Insurance | 520 (36.1%) | 919 (63.9%) |
| Real Estate, Rental & Leasing | 374 (50.9%) | 360 (49.0%) |
| Professional & Scientific | 855 (60.9%) | 548 (39.1%) |
| Enterprise Management | 23 (47.9%) | 25 (52.1%) |
| Administrative & Support | 353 (70.7%) | 146 (29.3%) |
| Educational Services | 610 (40.5%) | 898 (59.6%) |
| Health Care & Social Assistance | 689 (36.0%) | 1,222 (63.9%) |
| Arts, Entertainment & Recreation | 164 (56.9%) | 124 (43.1%) |
| Accommodation & Food Services | 705 (59.1%) | 489 (40.9%) |
| Public Administration | 279 (37.1%) | 472 (62.8%) |
| Total | 8,840 (52.8%) | 7,913 (47.2%) |
Education in Temple City
School Enrollment in Temple City
The most common levels of schooling among the 9,062 students in Temple City are college / undergraduate (2,505 | 27.6%), high school (1,856 | 20.5%), and middle school (1,790 | 19.8%).
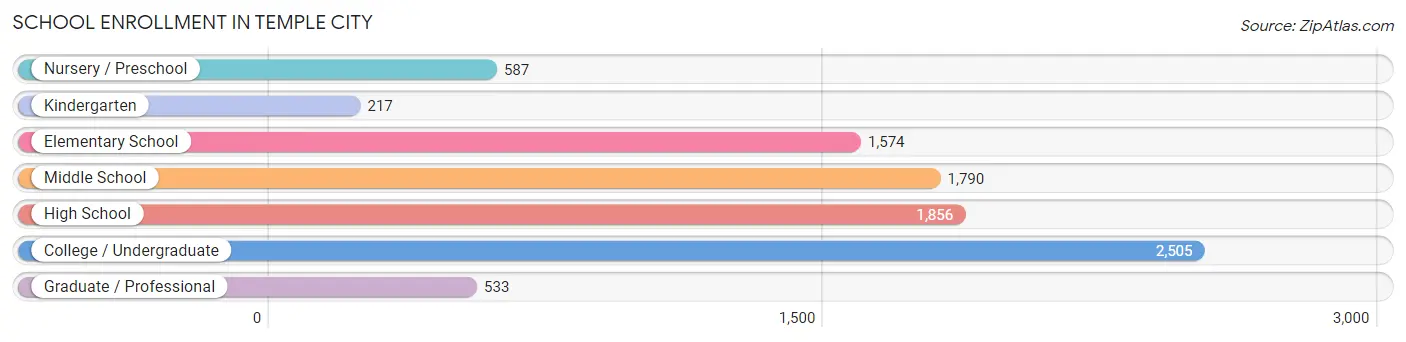
| School Level | # Students | % Students |
| Nursery / Preschool | 587 | 6.5% |
| Kindergarten | 217 | 2.4% |
| Elementary School | 1,574 | 17.4% |
| Middle School | 1,790 | 19.8% |
| High School | 1,856 | 20.5% |
| College / Undergraduate | 2,505 | 27.6% |
| Graduate / Professional | 533 | 5.9% |
| Total | 9,062 | 100.0% |
School Enrollment by Age by Funding Source in Temple City
Out of a total of 9,062 students who are enrolled in schools in Temple City, 1,269 (14.0%) attend a private institution, while the remaining 7,793 (86.0%) are enrolled in public schools. The age group of 3 to 4 year olds has the highest likelihood of being enrolled in private schools, with 262 (60.0% in the age bracket) enrolled. Conversely, the age group of 5 to 9 year old has the lowest likelihood of being enrolled in a private school, with 1,736 (95.7% in the age bracket) attending a public institution.
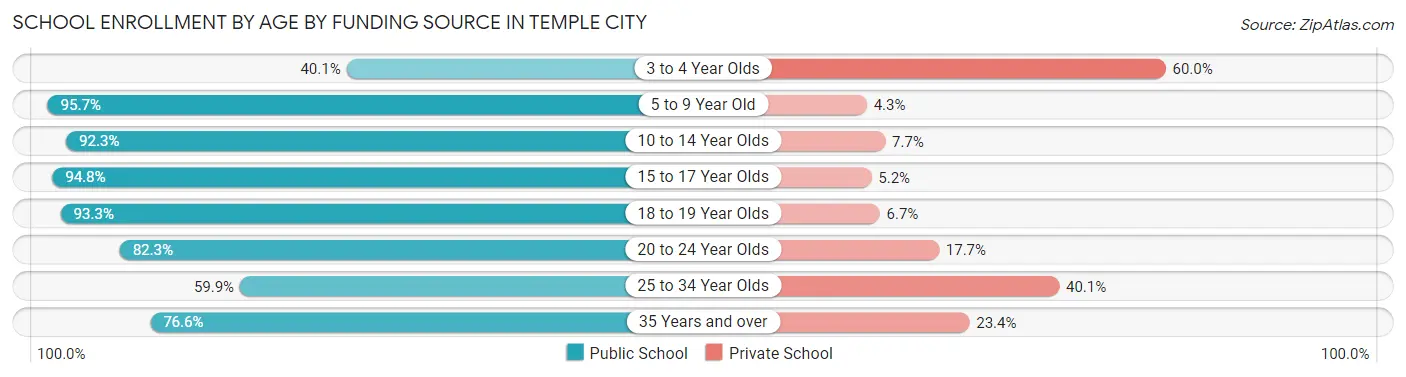
| Age Bracket | Public School | Private School |
| 3 to 4 Year Olds | 175 (40.1%) | 262 (60.0%) |
| 5 to 9 Year Old | 1,736 (95.7%) | 78 (4.3%) |
| 10 to 14 Year Olds | 2,105 (92.3%) | 176 (7.7%) |
| 15 to 17 Year Olds | 1,232 (94.8%) | 67 (5.2%) |
| 18 to 19 Year Olds | 711 (93.3%) | 51 (6.7%) |
| 20 to 24 Year Olds | 942 (82.3%) | 203 (17.7%) |
| 25 to 34 Year Olds | 427 (59.9%) | 286 (40.1%) |
| 35 Years and over | 468 (76.6%) | 143 (23.4%) |
| Total | 7,793 (86.0%) | 1,269 (14.0%) |
Educational Attainment by Field of Study in Temple City
Business (2,671 | 23.3%), engineering (1,262 | 11.0%), social sciences (1,193 | 10.4%), computers & mathematics (969 | 8.4%), and science & technology (878 | 7.6%) are the most common fields of study among 11,487 individuals in Temple City who have obtained a bachelor's degree or higher.
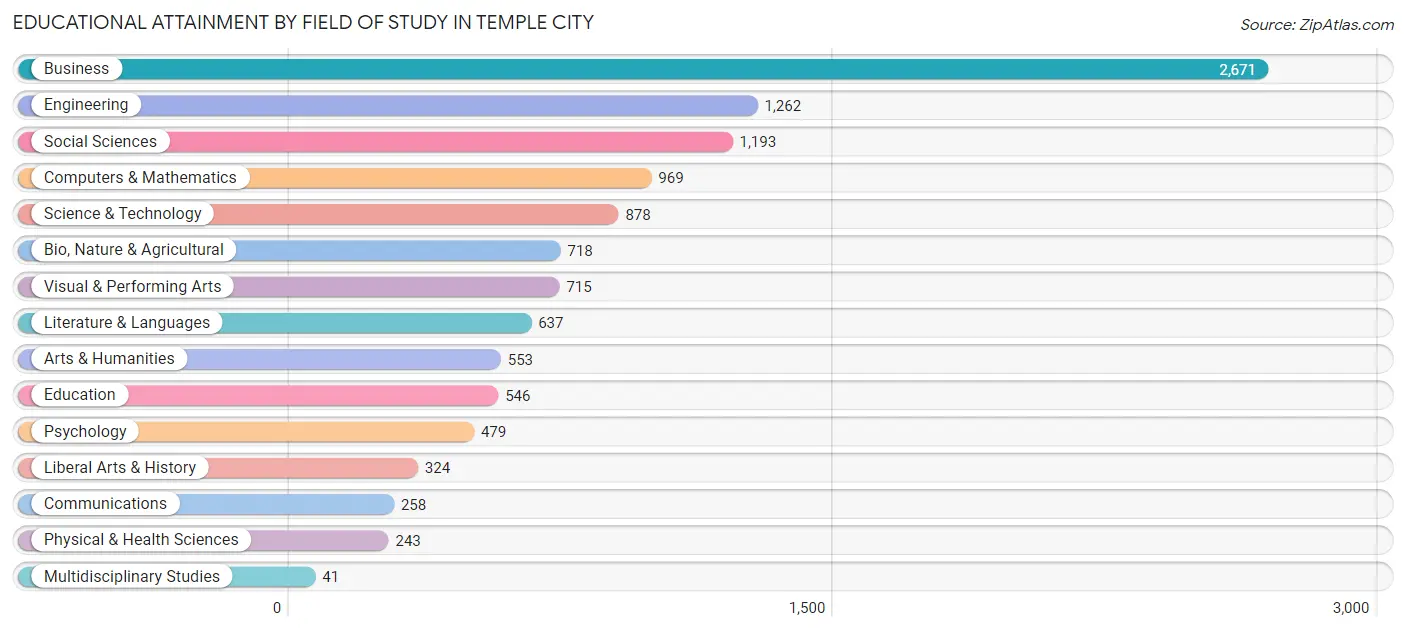
| Field of Study | # Graduates | % Graduates |
| Computers & Mathematics | 969 | 8.4% |
| Bio, Nature & Agricultural | 718 | 6.2% |
| Physical & Health Sciences | 243 | 2.1% |
| Psychology | 479 | 4.2% |
| Social Sciences | 1,193 | 10.4% |
| Engineering | 1,262 | 11.0% |
| Multidisciplinary Studies | 41 | 0.4% |
| Science & Technology | 878 | 7.6% |
| Business | 2,671 | 23.3% |
| Education | 546 | 4.8% |
| Literature & Languages | 637 | 5.6% |
| Liberal Arts & History | 324 | 2.8% |
| Visual & Performing Arts | 715 | 6.2% |
| Communications | 258 | 2.2% |
| Arts & Humanities | 553 | 4.8% |
| Total | 11,487 | 100.0% |
Transportation & Commute in Temple City
Vehicle Availability by Sex in Temple City
The most prevalent vehicle ownership categories in Temple City are males with 2 vehicles (3,373, accounting for 39.0%) and females with 2 vehicles (3,145, making up 43.7%).
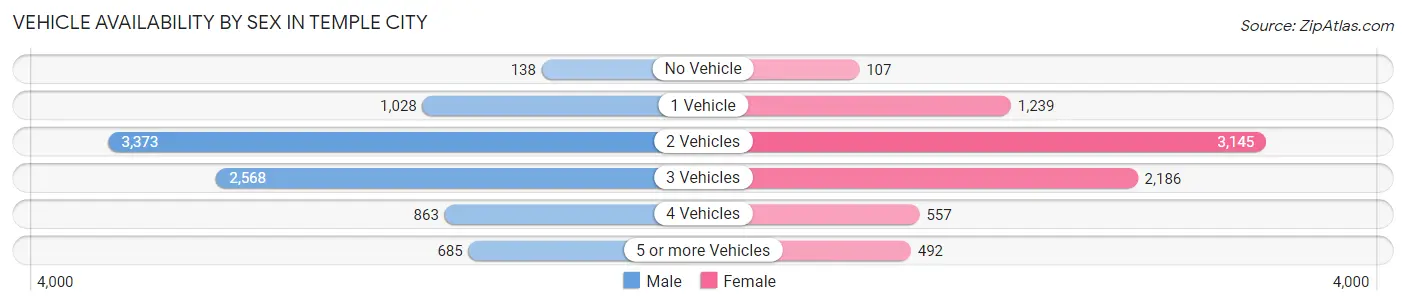
| Vehicles Available | Male | Female |
| No Vehicle | 138 (1.6%) | 107 (1.4%) |
| 1 Vehicle | 1,028 (11.9%) | 1,239 (16.0%) |
| 2 Vehicles | 3,373 (39.0%) | 3,145 (40.7%) |
| 3 Vehicles | 2,568 (29.7%) | 2,186 (28.3%) |
| 4 Vehicles | 863 (10.0%) | 557 (7.2%) |
| 5 or more Vehicles | 685 (7.9%) | 492 (6.4%) |
| Total | 8,655 (100.0%) | 7,726 (100.0%) |
Commute Time in Temple City
The most frequently occuring commute durations in Temple City are 30 to 34 minutes (2,603 commuters, 18.3%), 20 to 24 minutes (2,094 commuters, 14.7%), and 15 to 19 minutes (1,913 commuters, 13.5%).
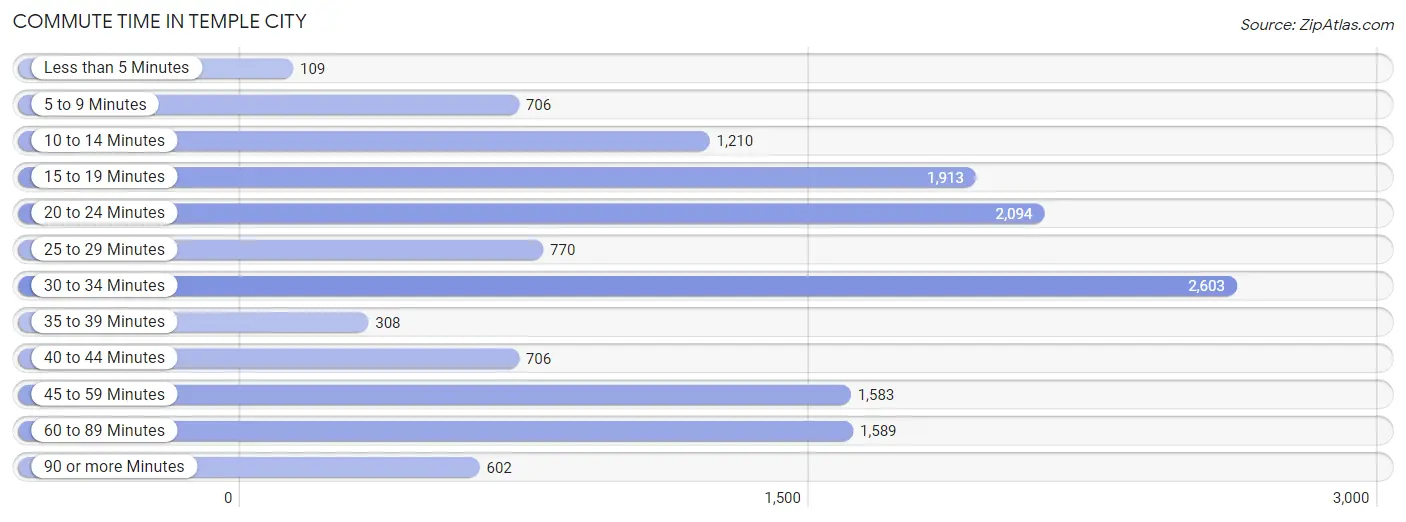
| Commute Time | # Commuters | % Commuters |
| Less than 5 Minutes | 109 | 0.8% |
| 5 to 9 Minutes | 706 | 5.0% |
| 10 to 14 Minutes | 1,210 | 8.5% |
| 15 to 19 Minutes | 1,913 | 13.5% |
| 20 to 24 Minutes | 2,094 | 14.7% |
| 25 to 29 Minutes | 770 | 5.4% |
| 30 to 34 Minutes | 2,603 | 18.3% |
| 35 to 39 Minutes | 308 | 2.2% |
| 40 to 44 Minutes | 706 | 5.0% |
| 45 to 59 Minutes | 1,583 | 11.2% |
| 60 to 89 Minutes | 1,589 | 11.2% |
| 90 or more Minutes | 602 | 4.2% |
Commute Time by Sex in Temple City
The most common commute times in Temple City are 30 to 34 minutes (1,732 commuters, 23.1%) for males and 20 to 24 minutes (1,156 commuters, 17.2%) for females.
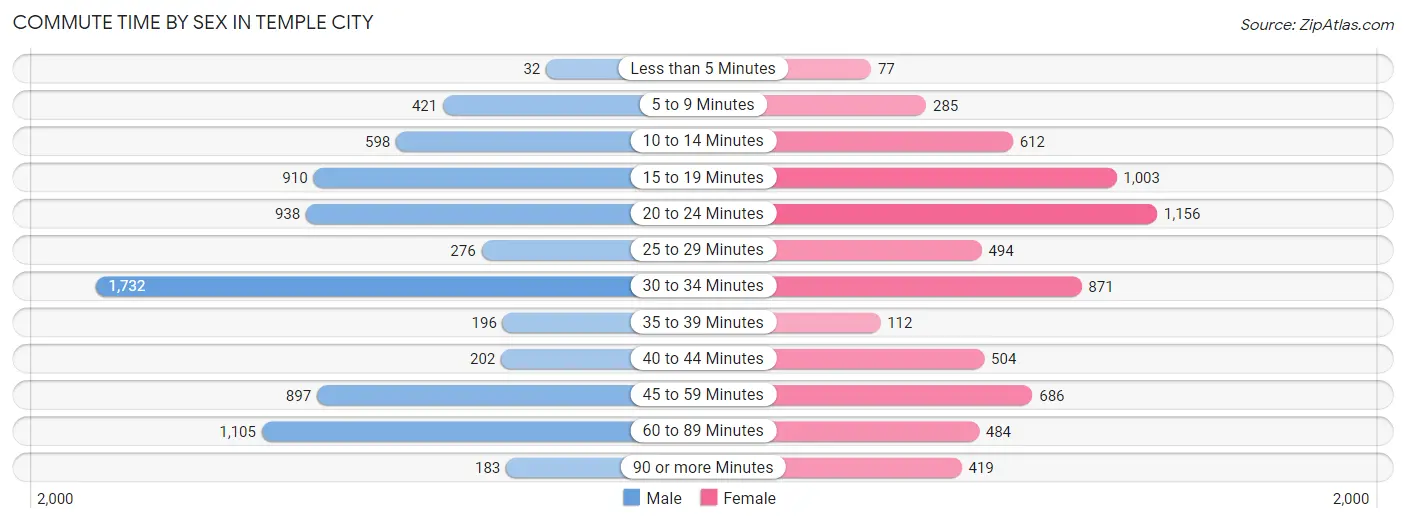
| Commute Time | Male | Female |
| Less than 5 Minutes | 32 (0.4%) | 77 (1.1%) |
| 5 to 9 Minutes | 421 (5.6%) | 285 (4.3%) |
| 10 to 14 Minutes | 598 (8.0%) | 612 (9.1%) |
| 15 to 19 Minutes | 910 (12.1%) | 1,003 (15.0%) |
| 20 to 24 Minutes | 938 (12.5%) | 1,156 (17.2%) |
| 25 to 29 Minutes | 276 (3.7%) | 494 (7.4%) |
| 30 to 34 Minutes | 1,732 (23.1%) | 871 (13.0%) |
| 35 to 39 Minutes | 196 (2.6%) | 112 (1.7%) |
| 40 to 44 Minutes | 202 (2.7%) | 504 (7.5%) |
| 45 to 59 Minutes | 897 (12.0%) | 686 (10.2%) |
| 60 to 89 Minutes | 1,105 (14.7%) | 484 (7.2%) |
| 90 or more Minutes | 183 (2.4%) | 419 (6.2%) |
Time of Departure to Work by Sex in Temple City
The most frequent times of departure to work in Temple City are 8:00 AM to 8:29 AM (1,055, 14.1%) for males and 9:00 AM to 9:59 AM (1,166, 17.4%) for females.
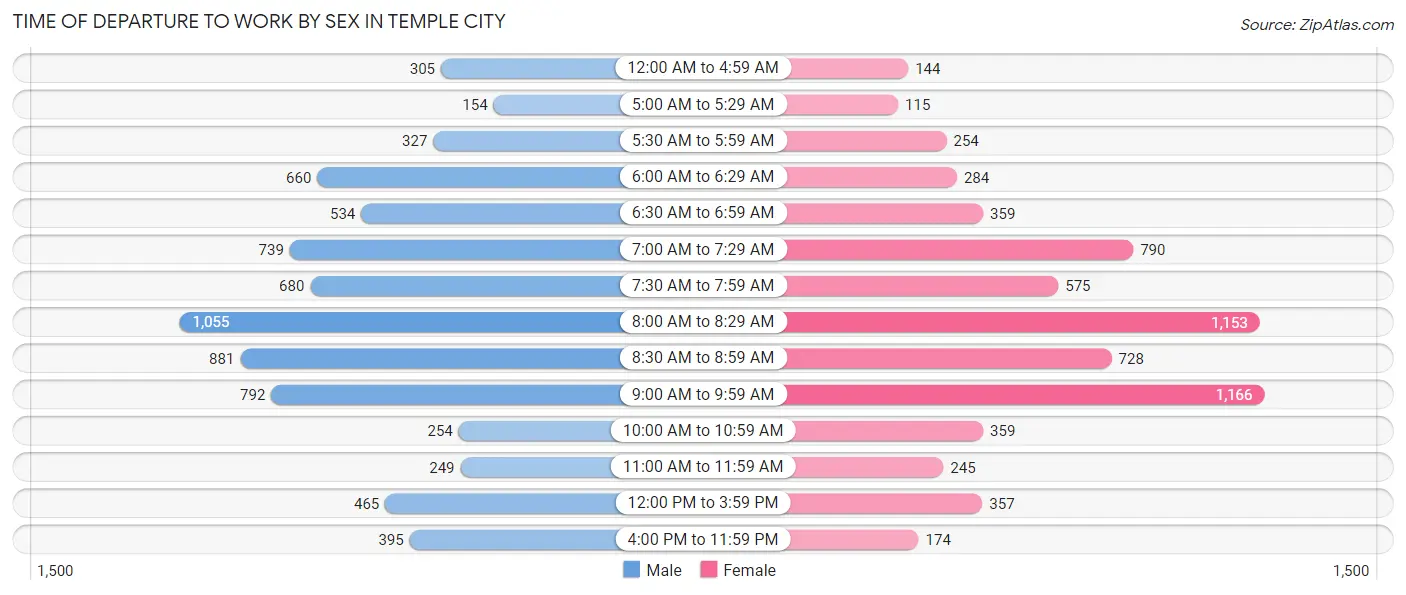
| Time of Departure | Male | Female |
| 12:00 AM to 4:59 AM | 305 (4.1%) | 144 (2.1%) |
| 5:00 AM to 5:29 AM | 154 (2.1%) | 115 (1.7%) |
| 5:30 AM to 5:59 AM | 327 (4.4%) | 254 (3.8%) |
| 6:00 AM to 6:29 AM | 660 (8.8%) | 284 (4.2%) |
| 6:30 AM to 6:59 AM | 534 (7.1%) | 359 (5.4%) |
| 7:00 AM to 7:29 AM | 739 (9.9%) | 790 (11.8%) |
| 7:30 AM to 7:59 AM | 680 (9.1%) | 575 (8.6%) |
| 8:00 AM to 8:29 AM | 1,055 (14.1%) | 1,153 (17.2%) |
| 8:30 AM to 8:59 AM | 881 (11.8%) | 728 (10.9%) |
| 9:00 AM to 9:59 AM | 792 (10.6%) | 1,166 (17.4%) |
| 10:00 AM to 10:59 AM | 254 (3.4%) | 359 (5.4%) |
| 11:00 AM to 11:59 AM | 249 (3.3%) | 245 (3.7%) |
| 12:00 PM to 3:59 PM | 465 (6.2%) | 357 (5.3%) |
| 4:00 PM to 11:59 PM | 395 (5.3%) | 174 (2.6%) |
| Total | 7,490 (100.0%) | 6,703 (100.0%) |
Housing Occupancy in Temple City
Occupancy by Ownership in Temple City
Of the total 11,722 dwellings in Temple City, owner-occupied units account for 7,120 (60.7%), while renter-occupied units make up 4,602 (39.3%).
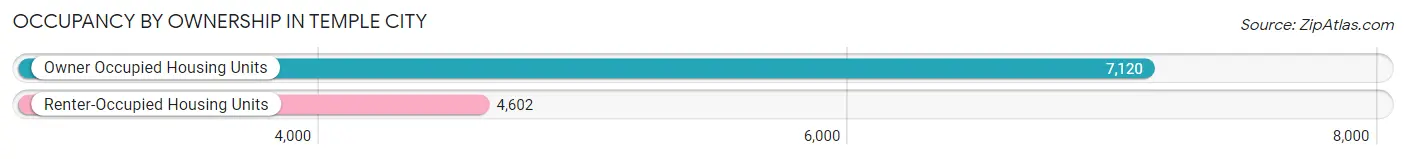
| Occupancy | # Housing Units | % Housing Units |
| Owner Occupied Housing Units | 7,120 | 60.7% |
| Renter-Occupied Housing Units | 4,602 | 39.3% |
| Total Occupied Housing Units | 11,722 | 100.0% |
Occupancy by Household Size in Temple City
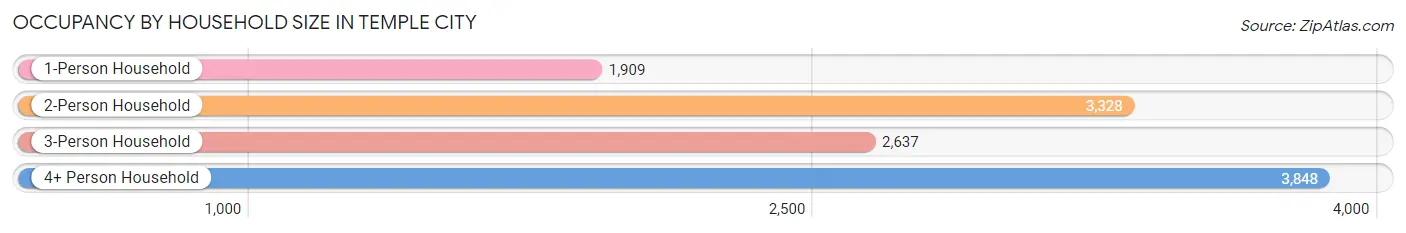
| Household Size | # Housing Units | % Housing Units |
| 1-Person Household | 1,909 | 16.3% |
| 2-Person Household | 3,328 | 28.4% |
| 3-Person Household | 2,637 | 22.5% |
| 4+ Person Household | 3,848 | 32.8% |
| Total Housing Units | 11,722 | 100.0% |
Occupancy by Ownership by Household Size in Temple City
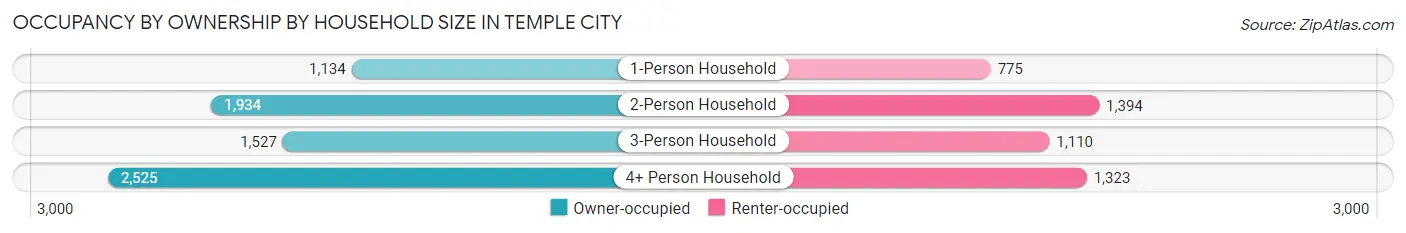
| Household Size | Owner-occupied | Renter-occupied |
| 1-Person Household | 1,134 (59.4%) | 775 (40.6%) |
| 2-Person Household | 1,934 (58.1%) | 1,394 (41.9%) |
| 3-Person Household | 1,527 (57.9%) | 1,110 (42.1%) |
| 4+ Person Household | 2,525 (65.6%) | 1,323 (34.4%) |
| Total Housing Units | 7,120 (60.7%) | 4,602 (39.3%) |
Occupancy by Educational Attainment in Temple City
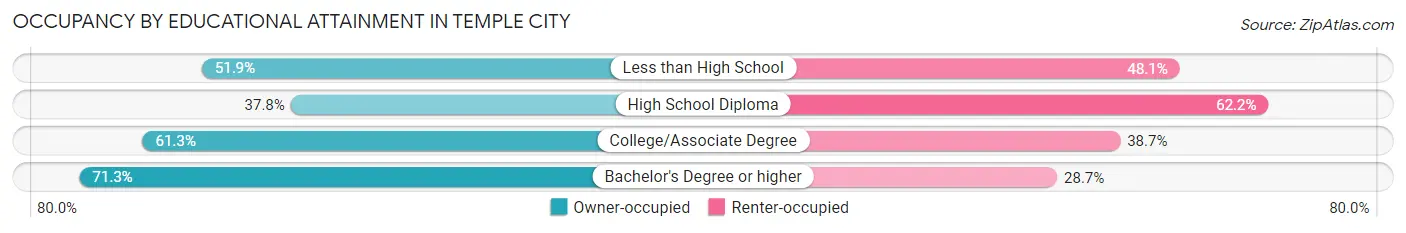
| Household Size | Owner-occupied | Renter-occupied |
| Less than High School | 552 (51.9%) | 512 (48.1%) |
| High School Diploma | 814 (37.8%) | 1,339 (62.2%) |
| College/Associate Degree | 1,898 (61.3%) | 1,199 (38.7%) |
| Bachelor's Degree or higher | 3,856 (71.3%) | 1,552 (28.7%) |
Occupancy by Age of Householder in Temple City
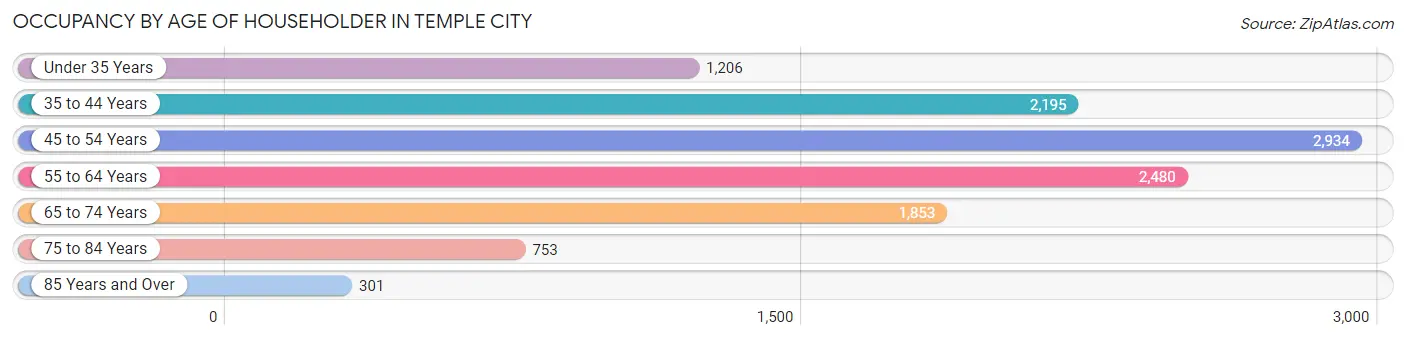
| Age Bracket | # Households | % Households |
| Under 35 Years | 1,206 | 10.3% |
| 35 to 44 Years | 2,195 | 18.7% |
| 45 to 54 Years | 2,934 | 25.0% |
| 55 to 64 Years | 2,480 | 21.2% |
| 65 to 74 Years | 1,853 | 15.8% |
| 75 to 84 Years | 753 | 6.4% |
| 85 Years and Over | 301 | 2.6% |
| Total | 11,722 | 100.0% |
Housing Finances in Temple City
Median Income by Occupancy in Temple City
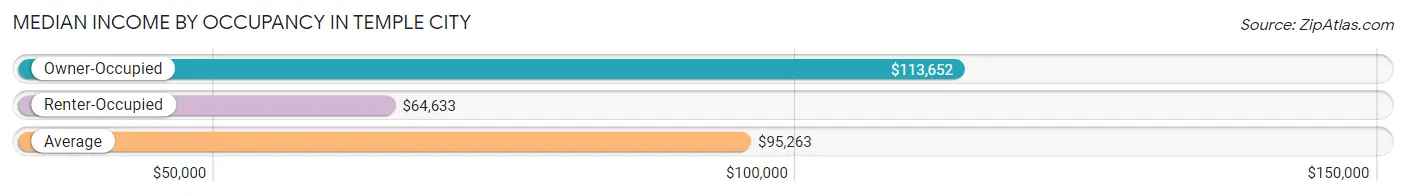
| Occupancy Type | # Households | Median Income |
| Owner-Occupied | 7,120 (60.7%) | $113,652 |
| Renter-Occupied | 4,602 (39.3%) | $64,633 |
| Average | 11,722 (100.0%) | $95,263 |
Occupancy by Householder Income Bracket in Temple City
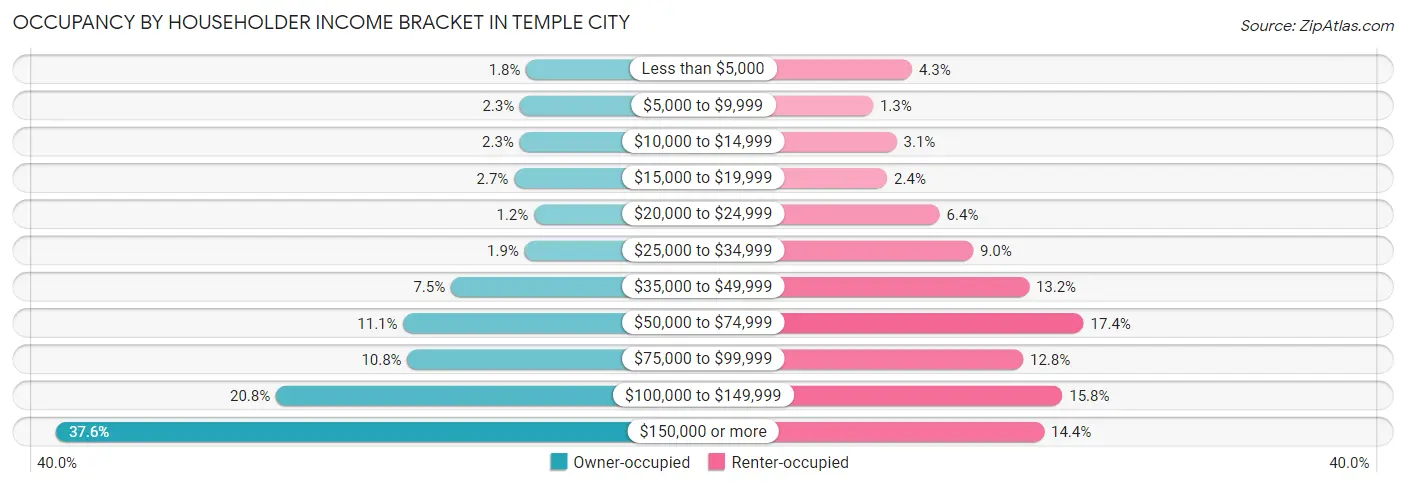
| Income Bracket | Owner-occupied | Renter-occupied |
| Less than $5,000 | 126 (1.8%) | 198 (4.3%) |
| $5,000 to $9,999 | 160 (2.2%) | 61 (1.3%) |
| $10,000 to $14,999 | 162 (2.3%) | 144 (3.1%) |
| $15,000 to $19,999 | 192 (2.7%) | 111 (2.4%) |
| $20,000 to $24,999 | 84 (1.2%) | 295 (6.4%) |
| $25,000 to $34,999 | 135 (1.9%) | 412 (8.9%) |
| $35,000 to $49,999 | 535 (7.5%) | 608 (13.2%) |
| $50,000 to $74,999 | 793 (11.1%) | 800 (17.4%) |
| $75,000 to $99,999 | 771 (10.8%) | 587 (12.8%) |
| $100,000 to $149,999 | 1,484 (20.8%) | 725 (15.8%) |
| $150,000 or more | 2,678 (37.6%) | 661 (14.4%) |
| Total | 7,120 (100.0%) | 4,602 (100.0%) |
Monthly Housing Cost Tiers in Temple City
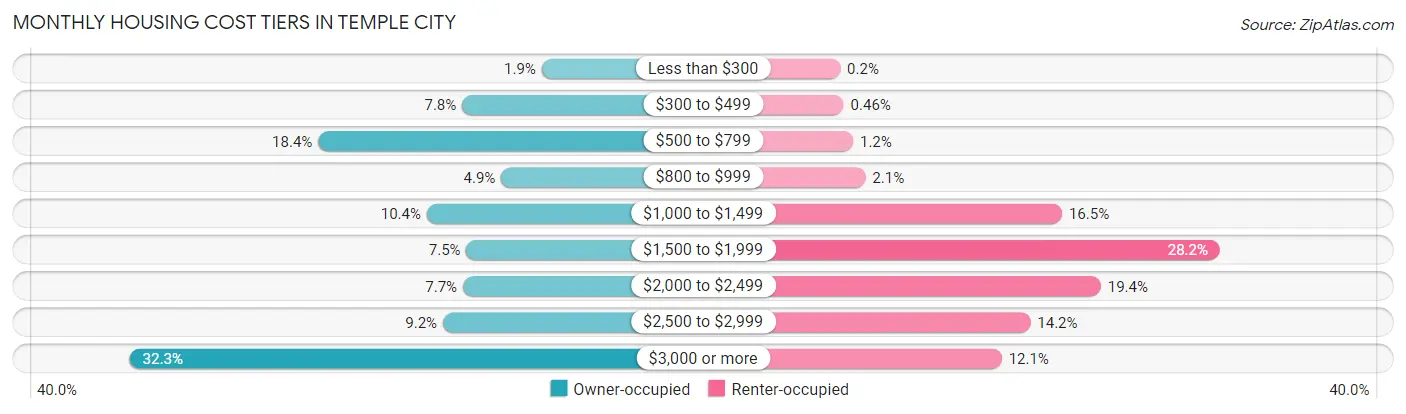
| Monthly Cost | Owner-occupied | Renter-occupied |
| Less than $300 | 137 (1.9%) | 9 (0.2%) |
| $300 to $499 | 554 (7.8%) | 21 (0.5%) |
| $500 to $799 | 1,309 (18.4%) | 53 (1.1%) |
| $800 to $999 | 349 (4.9%) | 95 (2.1%) |
| $1,000 to $1,499 | 739 (10.4%) | 761 (16.5%) |
| $1,500 to $1,999 | 531 (7.5%) | 1,296 (28.2%) |
| $2,000 to $2,499 | 550 (7.7%) | 893 (19.4%) |
| $2,500 to $2,999 | 654 (9.2%) | 654 (14.2%) |
| $3,000 or more | 2,297 (32.3%) | 557 (12.1%) |
| Total | 7,120 (100.0%) | 4,602 (100.0%) |
Physical Housing Characteristics in Temple City
Housing Structures in Temple City
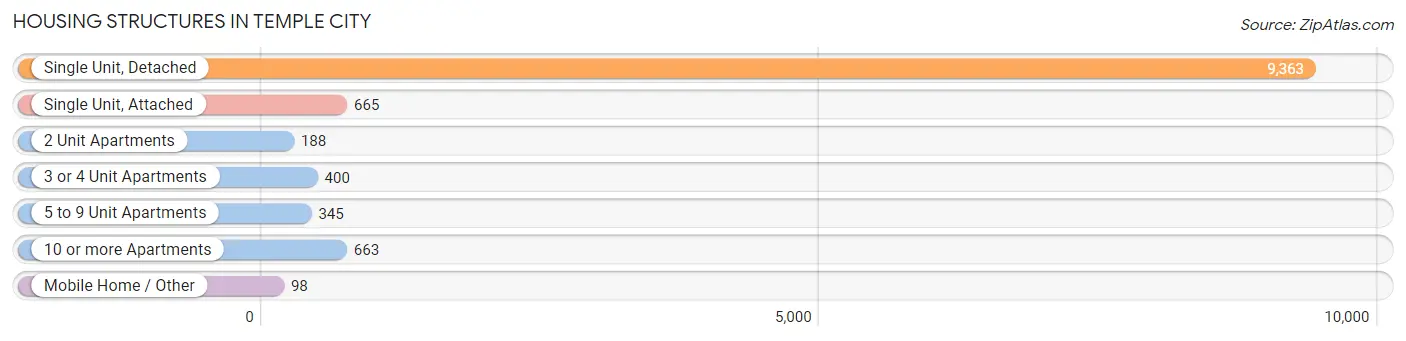
| Structure Type | # Housing Units | % Housing Units |
| Single Unit, Detached | 9,363 | 79.9% |
| Single Unit, Attached | 665 | 5.7% |
| 2 Unit Apartments | 188 | 1.6% |
| 3 or 4 Unit Apartments | 400 | 3.4% |
| 5 to 9 Unit Apartments | 345 | 2.9% |
| 10 or more Apartments | 663 | 5.7% |
| Mobile Home / Other | 98 | 0.8% |
| Total | 11,722 | 100.0% |
Housing Structures by Occupancy in Temple City
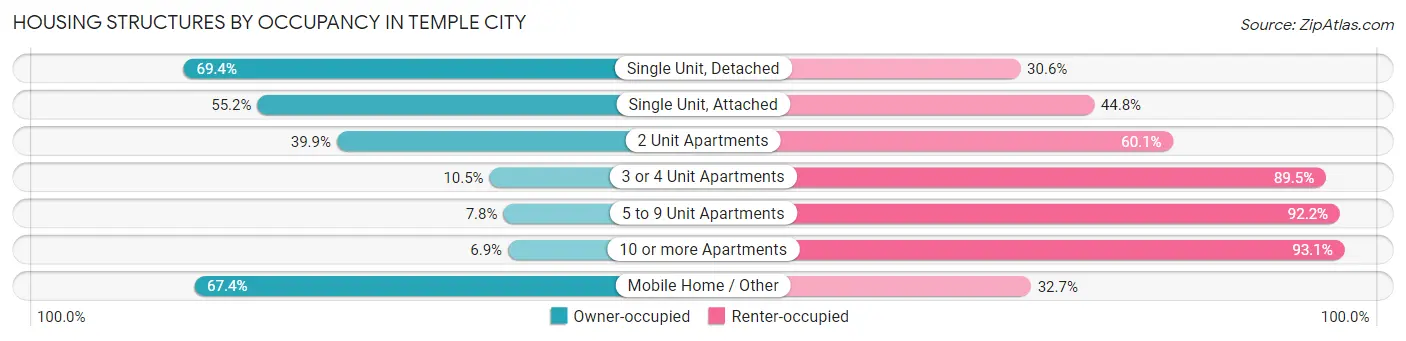
| Structure Type | Owner-occupied | Renter-occupied |
| Single Unit, Detached | 6,497 (69.4%) | 2,866 (30.6%) |
| Single Unit, Attached | 367 (55.2%) | 298 (44.8%) |
| 2 Unit Apartments | 75 (39.9%) | 113 (60.1%) |
| 3 or 4 Unit Apartments | 42 (10.5%) | 358 (89.5%) |
| 5 to 9 Unit Apartments | 27 (7.8%) | 318 (92.2%) |
| 10 or more Apartments | 46 (6.9%) | 617 (93.1%) |
| Mobile Home / Other | 66 (67.3%) | 32 (32.7%) |
| Total | 7,120 (60.7%) | 4,602 (39.3%) |
Housing Structures by Number of Rooms in Temple City
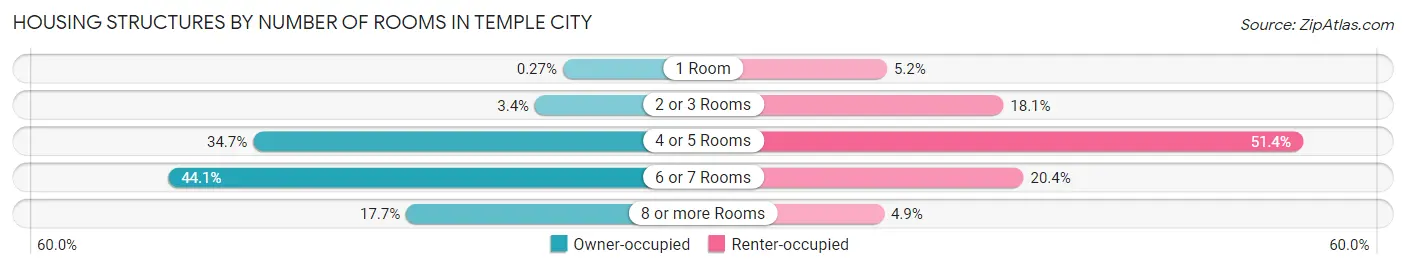
| Number of Rooms | Owner-occupied | Renter-occupied |
| 1 Room | 19 (0.3%) | 240 (5.2%) |
| 2 or 3 Rooms | 239 (3.4%) | 835 (18.1%) |
| 4 or 5 Rooms | 2,467 (34.6%) | 2,364 (51.4%) |
| 6 or 7 Rooms | 3,137 (44.1%) | 938 (20.4%) |
| 8 or more Rooms | 1,258 (17.7%) | 225 (4.9%) |
| Total | 7,120 (100.0%) | 4,602 (100.0%) |
Housing Structure by Heating Type in Temple City
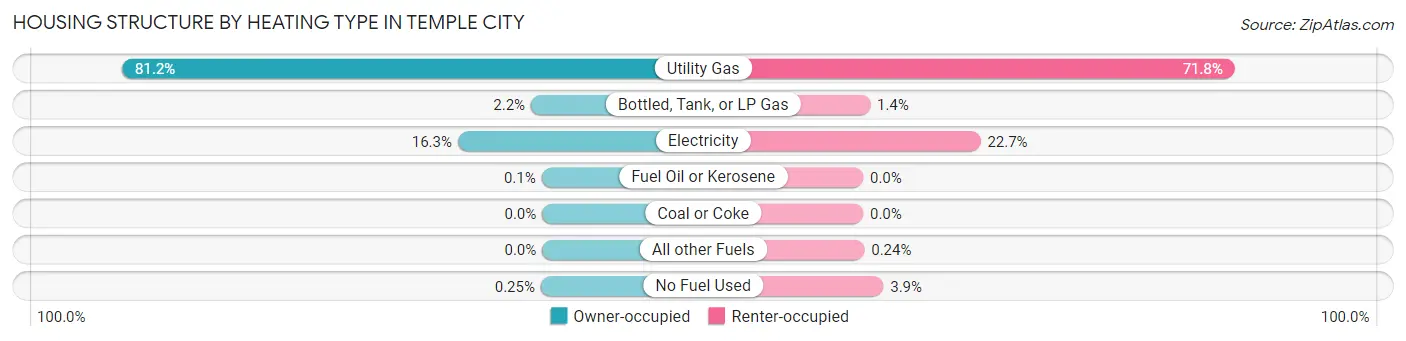
| Heating Type | Owner-occupied | Renter-occupied |
| Utility Gas | 5,781 (81.2%) | 3,305 (71.8%) |
| Bottled, Tank, or LP Gas | 154 (2.2%) | 62 (1.3%) |
| Electricity | 1,160 (16.3%) | 1,044 (22.7%) |
| Fuel Oil or Kerosene | 7 (0.1%) | 0 (0.0%) |
| Coal or Coke | 0 (0.0%) | 0 (0.0%) |
| All other Fuels | 0 (0.0%) | 11 (0.2%) |
| No Fuel Used | 18 (0.3%) | 180 (3.9%) |
| Total | 7,120 (100.0%) | 4,602 (100.0%) |
Household Vehicle Usage in Temple City
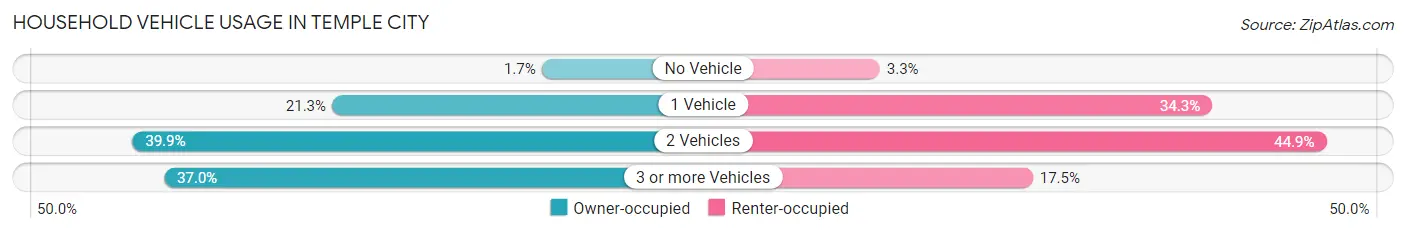
| Vehicles per Household | Owner-occupied | Renter-occupied |
| No Vehicle | 124 (1.7%) | 150 (3.3%) |
| 1 Vehicle | 1,518 (21.3%) | 1,577 (34.3%) |
| 2 Vehicles | 2,844 (39.9%) | 2,068 (44.9%) |
| 3 or more Vehicles | 2,634 (37.0%) | 807 (17.5%) |
| Total | 7,120 (100.0%) | 4,602 (100.0%) |
Real Estate & Mortgages in Temple City
Real Estate and Mortgage Overview in Temple City
| Characteristic | Without Mortgage | With Mortgage |
| Housing Units | 3,032 | 4,088 |
| Median Property Value | $888,200 | $869,500 |
| Median Household Income | $83,636 | $2,023 |
| Monthly Housing Costs | $707 | $2,280 |
| Real Estate Taxes | $4,685 | $10 |
Property Value by Mortgage Status in Temple City
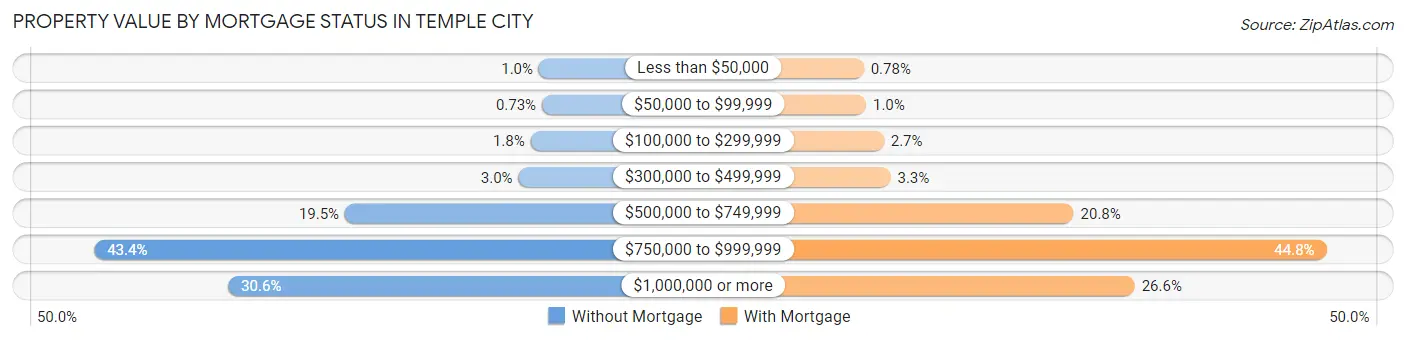
| Property Value | Without Mortgage | With Mortgage |
| Less than $50,000 | 31 (1.0%) | 32 (0.8%) |
| $50,000 to $99,999 | 22 (0.7%) | 41 (1.0%) |
| $100,000 to $299,999 | 55 (1.8%) | 110 (2.7%) |
| $300,000 to $499,999 | 90 (3.0%) | 136 (3.3%) |
| $500,000 to $749,999 | 591 (19.5%) | 849 (20.8%) |
| $750,000 to $999,999 | 1,315 (43.4%) | 1,833 (44.8%) |
| $1,000,000 or more | 928 (30.6%) | 1,087 (26.6%) |
| Total | 3,032 (100.0%) | 4,088 (100.0%) |
Household Income by Mortgage Status in Temple City
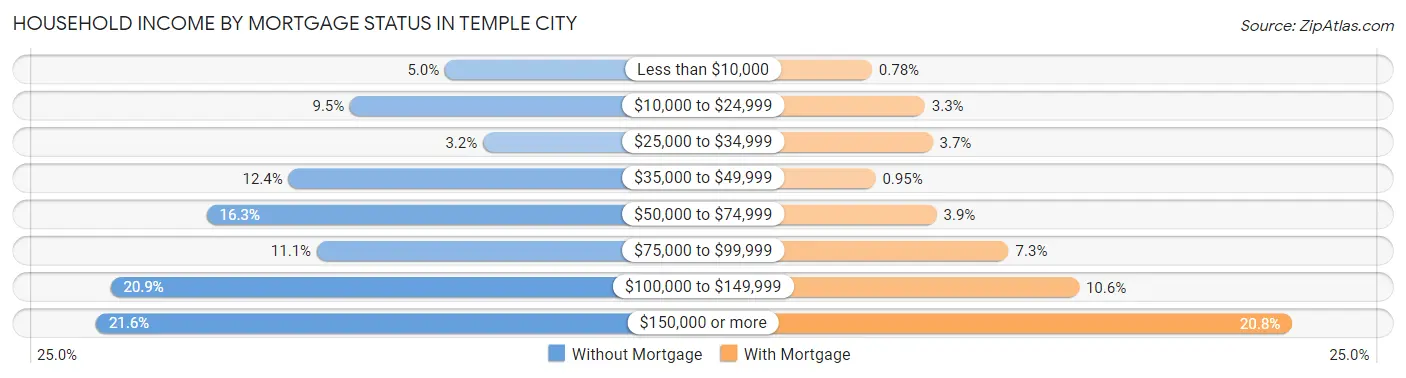
| Household Income | Without Mortgage | With Mortgage |
| Less than $10,000 | 151 (5.0%) | 32 (0.8%) |
| $10,000 to $24,999 | 288 (9.5%) | 135 (3.3%) |
| $25,000 to $34,999 | 96 (3.2%) | 150 (3.7%) |
| $35,000 to $49,999 | 377 (12.4%) | 39 (0.9%) |
| $50,000 to $74,999 | 495 (16.3%) | 158 (3.9%) |
| $75,000 to $99,999 | 336 (11.1%) | 298 (7.3%) |
| $100,000 to $149,999 | 634 (20.9%) | 435 (10.6%) |
| $150,000 or more | 655 (21.6%) | 850 (20.8%) |
| Total | 3,032 (100.0%) | 4,088 (100.0%) |
Property Value to Household Income Ratio in Temple City
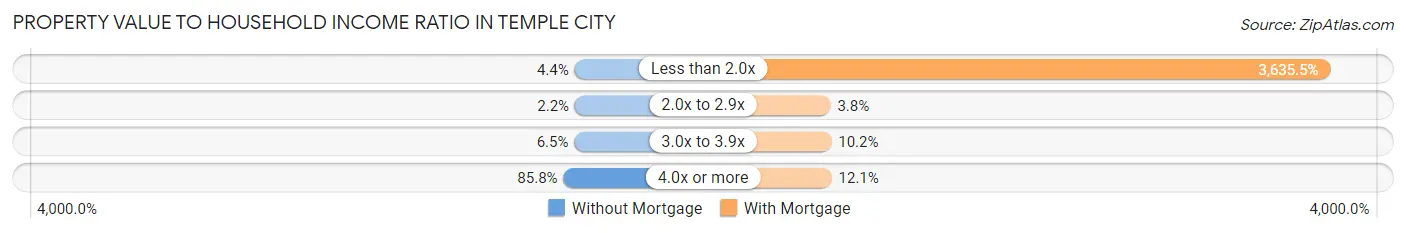
| Value-to-Income Ratio | Without Mortgage | With Mortgage |
| Less than 2.0x | 134 (4.4%) | 148,618 (3,635.5%) |
| 2.0x to 2.9x | 66 (2.2%) | 154 (3.8%) |
| 3.0x to 3.9x | 196 (6.5%) | 417 (10.2%) |
| 4.0x or more | 2,601 (85.8%) | 495 (12.1%) |
| Total | 3,032 (100.0%) | 4,088 (100.0%) |
Real Estate Taxes by Mortgage Status in Temple City
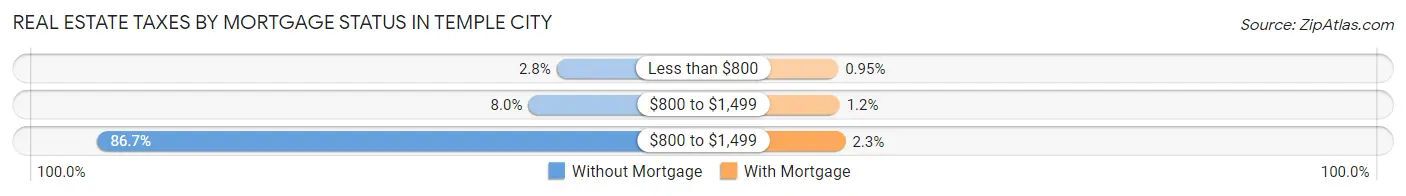
| Property Taxes | Without Mortgage | With Mortgage |
| Less than $800 | 86 (2.8%) | 39 (0.9%) |
| $800 to $1,499 | 243 (8.0%) | 50 (1.2%) |
| $800 to $1,499 | 2,628 (86.7%) | 93 (2.3%) |
| Total | 3,032 (100.0%) | 4,088 (100.0%) |
Health & Disability in Temple City
Health Insurance Coverage by Age in Temple City
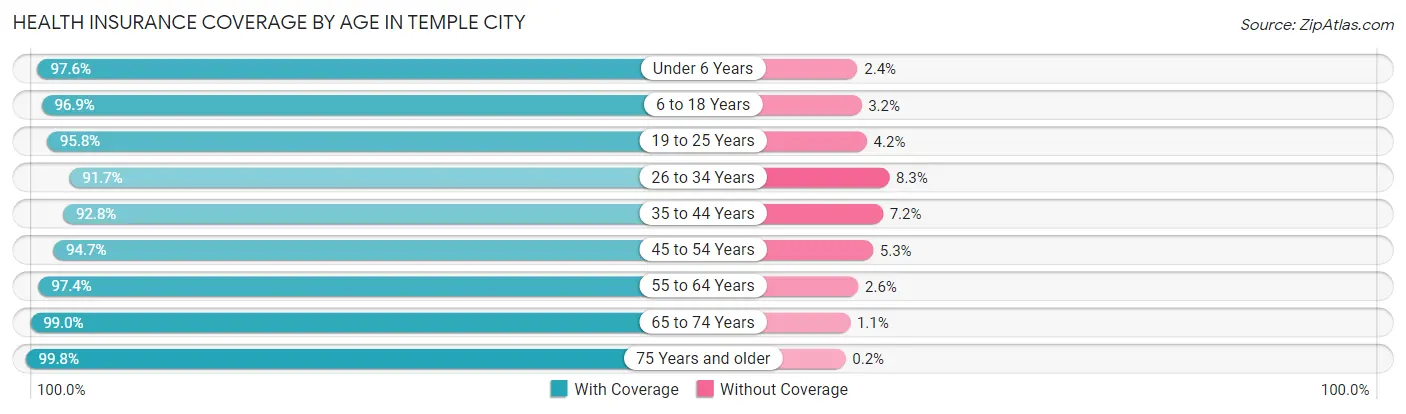
| Age Bracket | With Coverage | Without Coverage |
| Under 6 Years | 2,200 (97.6%) | 55 (2.4%) |
| 6 to 18 Years | 5,657 (96.9%) | 184 (3.2%) |
| 19 to 25 Years | 2,319 (95.8%) | 101 (4.2%) |
| 26 to 34 Years | 3,418 (91.7%) | 311 (8.3%) |
| 35 to 44 Years | 4,381 (92.8%) | 338 (7.2%) |
| 45 to 54 Years | 5,341 (94.7%) | 301 (5.3%) |
| 55 to 64 Years | 4,599 (97.4%) | 122 (2.6%) |
| 65 to 74 Years | 3,775 (99.0%) | 40 (1.1%) |
| 75 Years and older | 2,553 (99.8%) | 5 (0.2%) |
| Total | 34,243 (95.9%) | 1,457 (4.1%) |
Health Insurance Coverage by Citizenship Status in Temple City
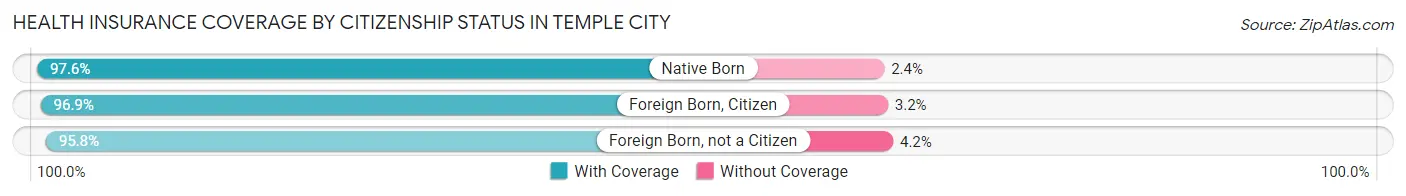
| Citizenship Status | With Coverage | Without Coverage |
| Native Born | 2,200 (97.6%) | 55 (2.4%) |
| Foreign Born, Citizen | 5,657 (96.9%) | 184 (3.2%) |
| Foreign Born, not a Citizen | 2,319 (95.8%) | 101 (4.2%) |
Health Insurance Coverage by Household Income in Temple City
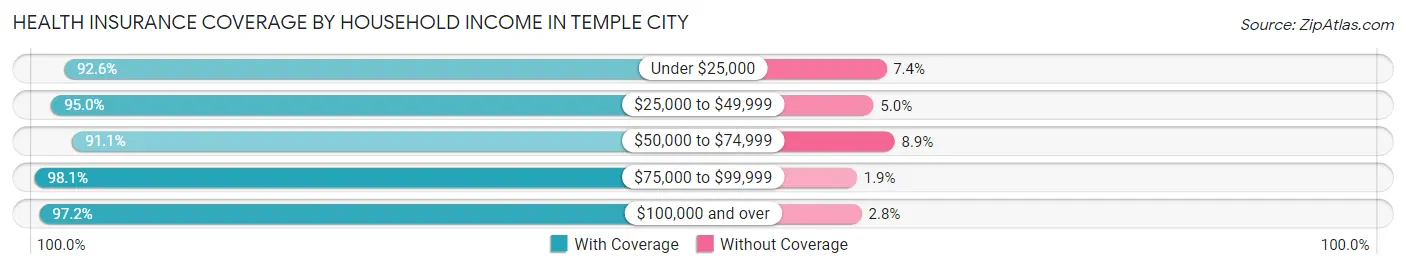
| Household Income | With Coverage | Without Coverage |
| Under $25,000 | 3,176 (92.6%) | 253 (7.4%) |
| $25,000 to $49,999 | 3,843 (95.0%) | 202 (5.0%) |
| $50,000 to $74,999 | 3,769 (91.1%) | 370 (8.9%) |
| $75,000 to $99,999 | 4,034 (98.1%) | 77 (1.9%) |
| $100,000 and over | 19,312 (97.2%) | 552 (2.8%) |
Public vs Private Health Insurance Coverage by Age in Temple City
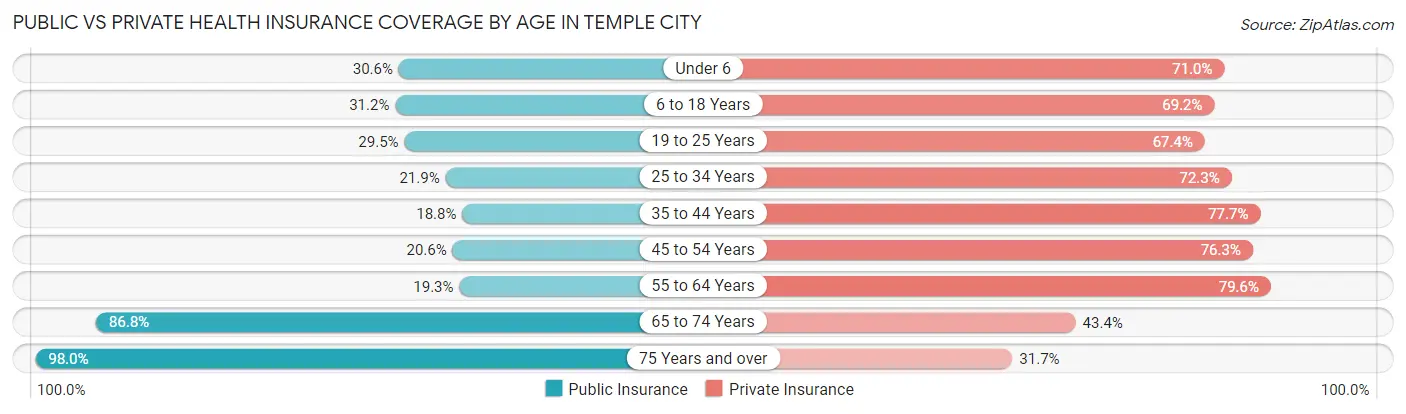
| Age Bracket | Public Insurance | Private Insurance |
| Under 6 | 689 (30.5%) | 1,601 (71.0%) |
| 6 to 18 Years | 1,823 (31.2%) | 4,039 (69.2%) |
| 19 to 25 Years | 714 (29.5%) | 1,630 (67.4%) |
| 25 to 34 Years | 816 (21.9%) | 2,697 (72.3%) |
| 35 to 44 Years | 885 (18.8%) | 3,665 (77.7%) |
| 45 to 54 Years | 1,160 (20.6%) | 4,303 (76.3%) |
| 55 to 64 Years | 911 (19.3%) | 3,759 (79.6%) |
| 65 to 74 Years | 3,310 (86.8%) | 1,656 (43.4%) |
| 75 Years and over | 2,507 (98.0%) | 810 (31.7%) |
| Total | 12,815 (35.9%) | 24,160 (67.7%) |
Disability Status by Sex by Age in Temple City
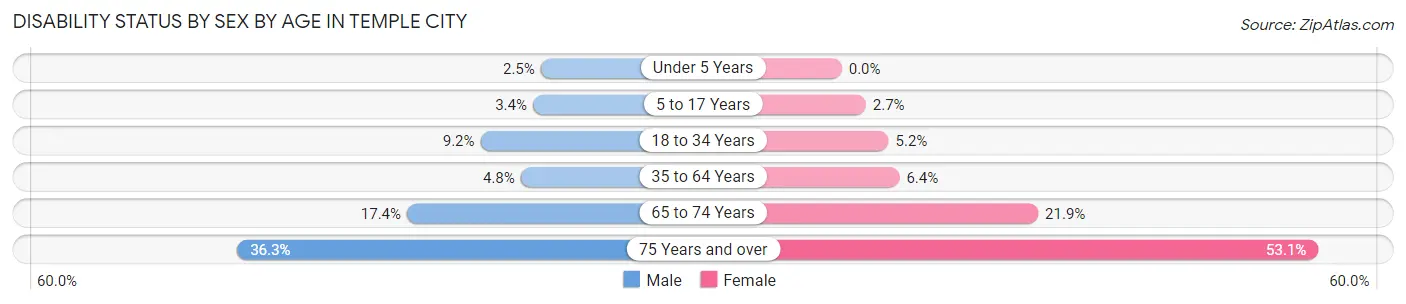
| Age Bracket | Male | Female |
| Under 5 Years | 26 (2.5%) | 0 (0.0%) |
| 5 to 17 Years | 90 (3.4%) | 82 (2.7%) |
| 18 to 34 Years | 308 (9.2%) | 168 (5.2%) |
| 35 to 64 Years | 347 (4.8%) | 500 (6.4%) |
| 65 to 74 Years | 300 (17.4%) | 458 (21.9%) |
| 75 Years and over | 369 (36.3%) | 818 (53.0%) |
Disability Class by Sex by Age in Temple City
Disability Class: Hearing Difficulty
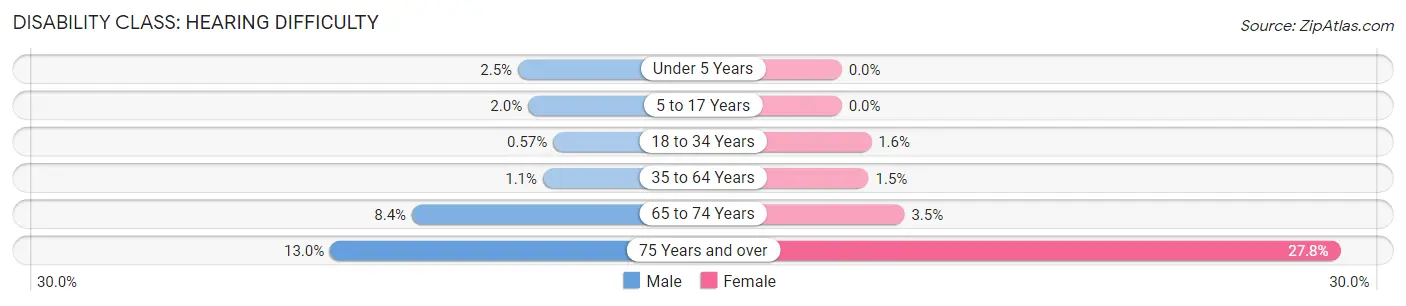
| Age Bracket | Male | Female |
| Under 5 Years | 26 (2.5%) | 0 (0.0%) |
| 5 to 17 Years | 52 (2.0%) | 0 (0.0%) |
| 18 to 34 Years | 19 (0.6%) | 53 (1.6%) |
| 35 to 64 Years | 83 (1.1%) | 116 (1.5%) |
| 65 to 74 Years | 145 (8.4%) | 73 (3.5%) |
| 75 Years and over | 132 (13.0%) | 428 (27.8%) |
Disability Class: Vision Difficulty
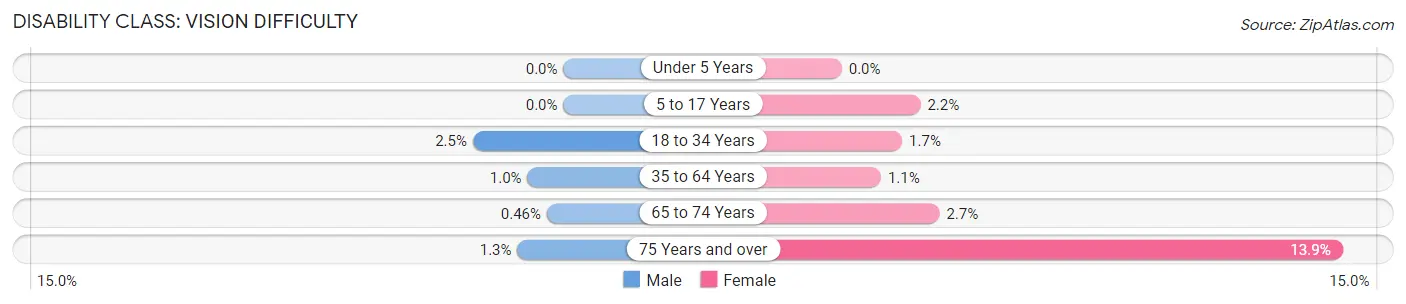
| Age Bracket | Male | Female |
| Under 5 Years | 0 (0.0%) | 0 (0.0%) |
| 5 to 17 Years | 0 (0.0%) | 67 (2.2%) |
| 18 to 34 Years | 84 (2.5%) | 54 (1.7%) |
| 35 to 64 Years | 73 (1.0%) | 85 (1.1%) |
| 65 to 74 Years | 8 (0.5%) | 57 (2.7%) |
| 75 Years and over | 13 (1.3%) | 215 (13.9%) |
Disability Class: Cognitive Difficulty
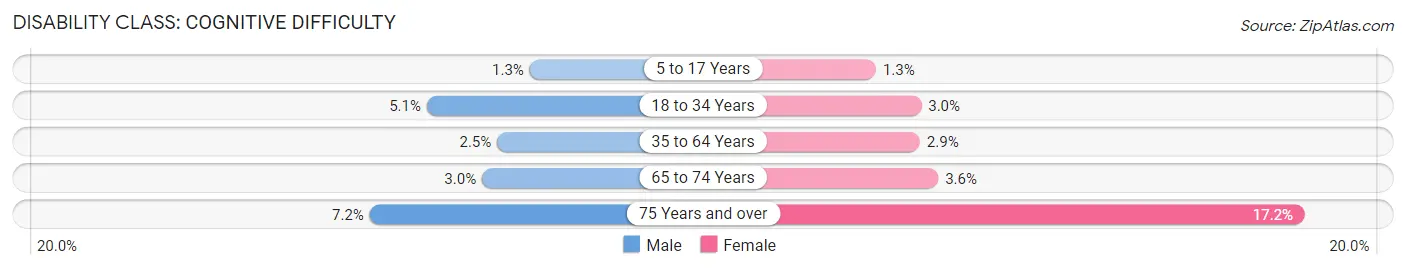
| Age Bracket | Male | Female |
| 5 to 17 Years | 33 (1.3%) | 39 (1.3%) |
| 18 to 34 Years | 169 (5.1%) | 95 (2.9%) |
| 35 to 64 Years | 179 (2.5%) | 226 (2.9%) |
| 65 to 74 Years | 52 (3.0%) | 75 (3.6%) |
| 75 Years and over | 73 (7.2%) | 265 (17.2%) |
Disability Class: Ambulatory Difficulty
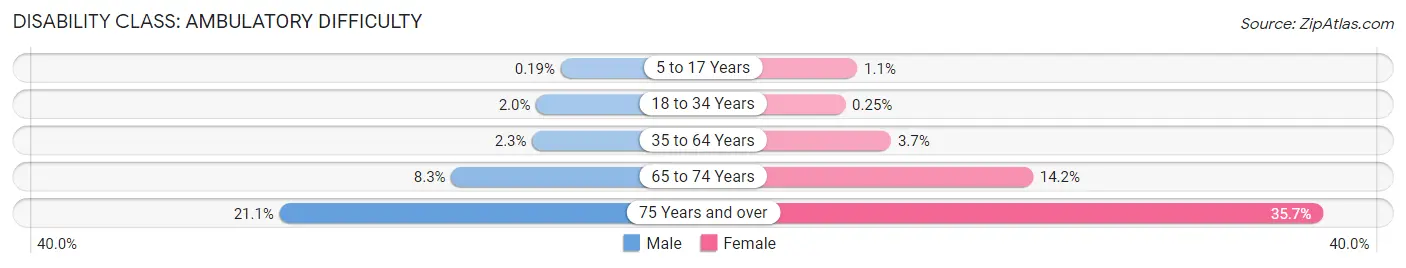
| Age Bracket | Male | Female |
| 5 to 17 Years | 5 (0.2%) | 35 (1.1%) |
| 18 to 34 Years | 67 (2.0%) | 8 (0.3%) |
| 35 to 64 Years | 168 (2.3%) | 284 (3.6%) |
| 65 to 74 Years | 143 (8.3%) | 297 (14.2%) |
| 75 Years and over | 214 (21.1%) | 551 (35.7%) |
Disability Class: Self-Care Difficulty
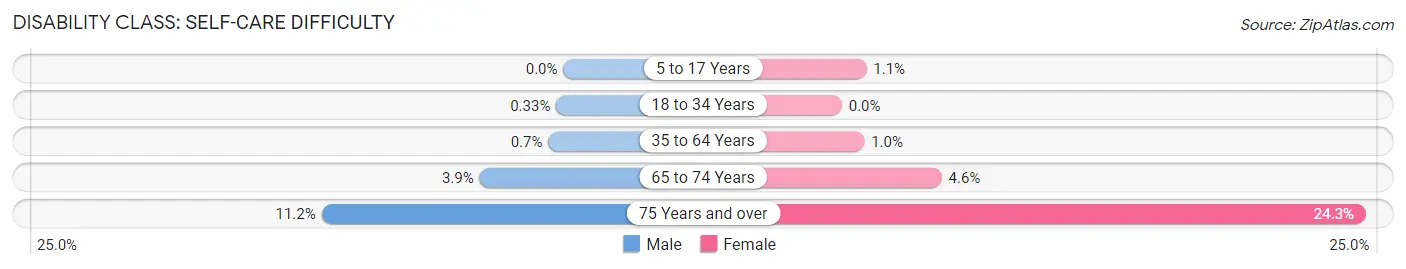
| Age Bracket | Male | Female |
| 5 to 17 Years | 0 (0.0%) | 35 (1.1%) |
| 18 to 34 Years | 11 (0.3%) | 0 (0.0%) |
| 35 to 64 Years | 51 (0.7%) | 81 (1.0%) |
| 65 to 74 Years | 67 (3.9%) | 97 (4.6%) |
| 75 Years and over | 114 (11.2%) | 375 (24.3%) |
Technology Access in Temple City
Computing Device Access in Temple City
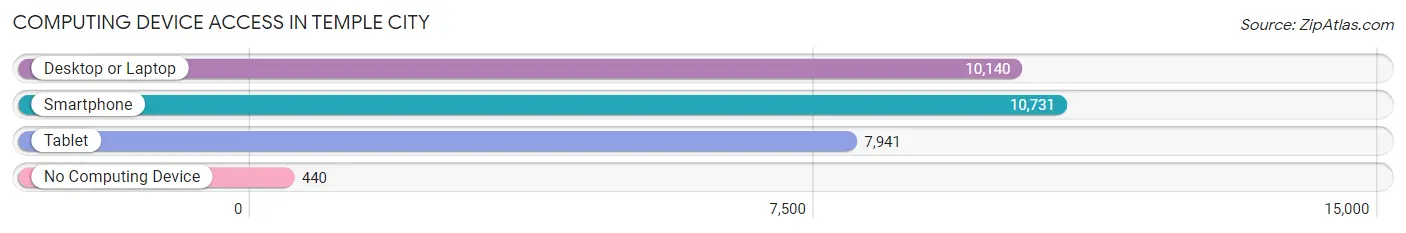
| Device Type | # Households | % Households |
| Desktop or Laptop | 10,140 | 86.5% |
| Smartphone | 10,731 | 91.5% |
| Tablet | 7,941 | 67.7% |
| No Computing Device | 440 | 3.7% |
| Total | 11,722 | 100.0% |
Internet Access in Temple City
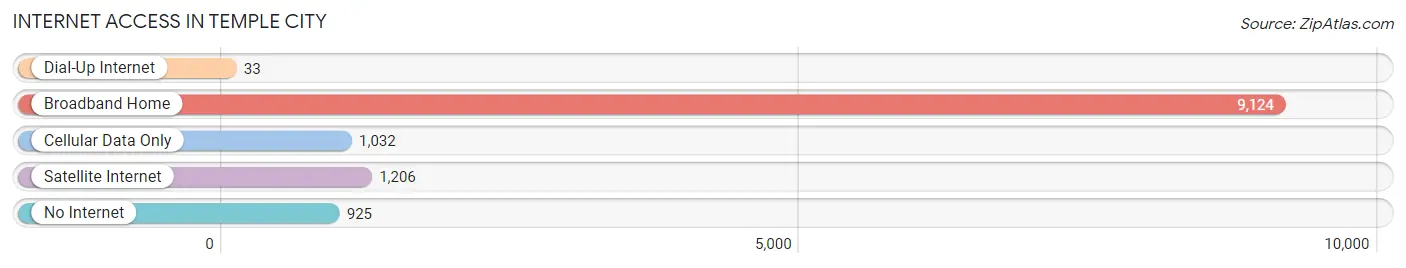
| Internet Type | # Households | % Households |
| Dial-Up Internet | 33 | 0.3% |
| Broadband Home | 9,124 | 77.8% |
| Cellular Data Only | 1,032 | 8.8% |
| Satellite Internet | 1,206 | 10.3% |
| No Internet | 925 | 7.9% |
| Total | 11,722 | 100.0% |
Temple City Summary
Temple City is a city located in Los Angeles County, California, United States. It is situated in the San Gabriel Valley, approximately 20 miles east of downtown Los Angeles. The population was 35,558 at the 2010 census.
History
Temple City was incorporated in 1960, and was named after Walter P. Temple, who was the original owner of the land upon which the city was built. The land was originally used for farming and ranching, and was later developed into residential neighborhoods.
The city was originally part of the Rancho Santa Anita, which was granted to Hugo Reid in 1839 by the Mexican government. The area was later acquired by Elias Jackson "Lucky" Baldwin, who established the Santa Anita Race Track in 1907. The track was later sold to a group of investors, who developed the area into residential neighborhoods.
Geography
Temple City is located at 34°7′57″N 118°4′39″W (34.1325, -118.0775). According to the United States Census Bureau, the city has a total area of 4.8 square miles (12.4 km2), all of it land.
Economy
Temple City is home to a variety of businesses, including retail stores, restaurants, and professional services. The city is also home to several industrial parks, which provide employment opportunities for many of the city's residents.
Demographics
As of the 2010 census, there were 35,558 people, 11,845 households, and 8,845 families residing in the city. The population density was 7,362.3 people per square mile (2,837.2/km2). There were 12,068 housing units at an average density of 2,494.3 per square mile (962.7/km2). The racial makeup of the city was 57.2% White, 0.7% African American, 0.5% Native American, 33.2% Asian, 0.1% Pacific Islander, 5.2% from other races, and 3.1% from two or more races. Hispanic or Latino of any race were 15.9% of the population.
The median income for a household in the city was $60,841, and the median income for a family was $68,927. Males had a median income of $45,859 versus $37,288 for females. The per capita income for the city was $25,818. About 4.2% of families and 5.7% of the population were below the poverty line, including 6.2% of those under age 18 and 6.2% of those age 65 or over.
Common Questions
What is Per Capita Income in Temple City?
Per Capita income in Temple City is $40,134.
What is the Median Family Income in Temple City?
Median Family Income in Temple City is $104,000.
What is the Median Household income in Temple City?
Median Household Income in Temple City is $95,263.
What is Income or Wage Gap in Temple City?
Income or Wage Gap in Temple City is 24.9%.
Women in Temple City earn 75.1 cents for every dollar earned by a man.
What is Family Income Deficit in Temple City?
Family Income Deficit in Temple City is $11,005.
Families that are below poverty line in Temple City earn $11,005 less on average than the poverty threshold level.
What is Inequality or Gini Index in Temple City?
Inequality or Gini Index in Temple City is 0.45.
What is the Total Population of Temple City?
Total Population of Temple City is 36,165.
What is the Total Male Population of Temple City?
Total Male Population of Temple City is 17,177.
What is the Total Female Population of Temple City?
Total Female Population of Temple City is 18,988.
What is the Ratio of Males per 100 Females in Temple City?
There are 90.46 Males per 100 Females in Temple City.
What is the Ratio of Females per 100 Males in Temple City?
There are 110.54 Females per 100 Males in Temple City.
What is the Median Population Age in Temple City?
Median Population Age in Temple City is 42.9 Years.
What is the Average Family Size in Temple City
Average Family Size in Temple City is 3.4 People.
What is the Average Household Size in Temple City
Average Household Size in Temple City is 3.0 People.
How Large is the Labor Force in Temple City?
There are 17,905 People in the Labor Forcein in Temple City.
What is the Percentage of People in the Labor Force in Temple City?
61.1% of People are in the Labor Force in Temple City.
What is the Unemployment Rate in Temple City?
Unemployment Rate in Temple City is 6.2%.