Cities with the Highest Percentage of Population Employed in Finance & Insurance in Vermont
RELATED REPORTS & OPTIONS
Finance & Insurance
Vermont
Compare Cities
Map of Cities with the Highest Percentage of Population Employed in Finance & Insurance in Vermont
0.0%
50.0%
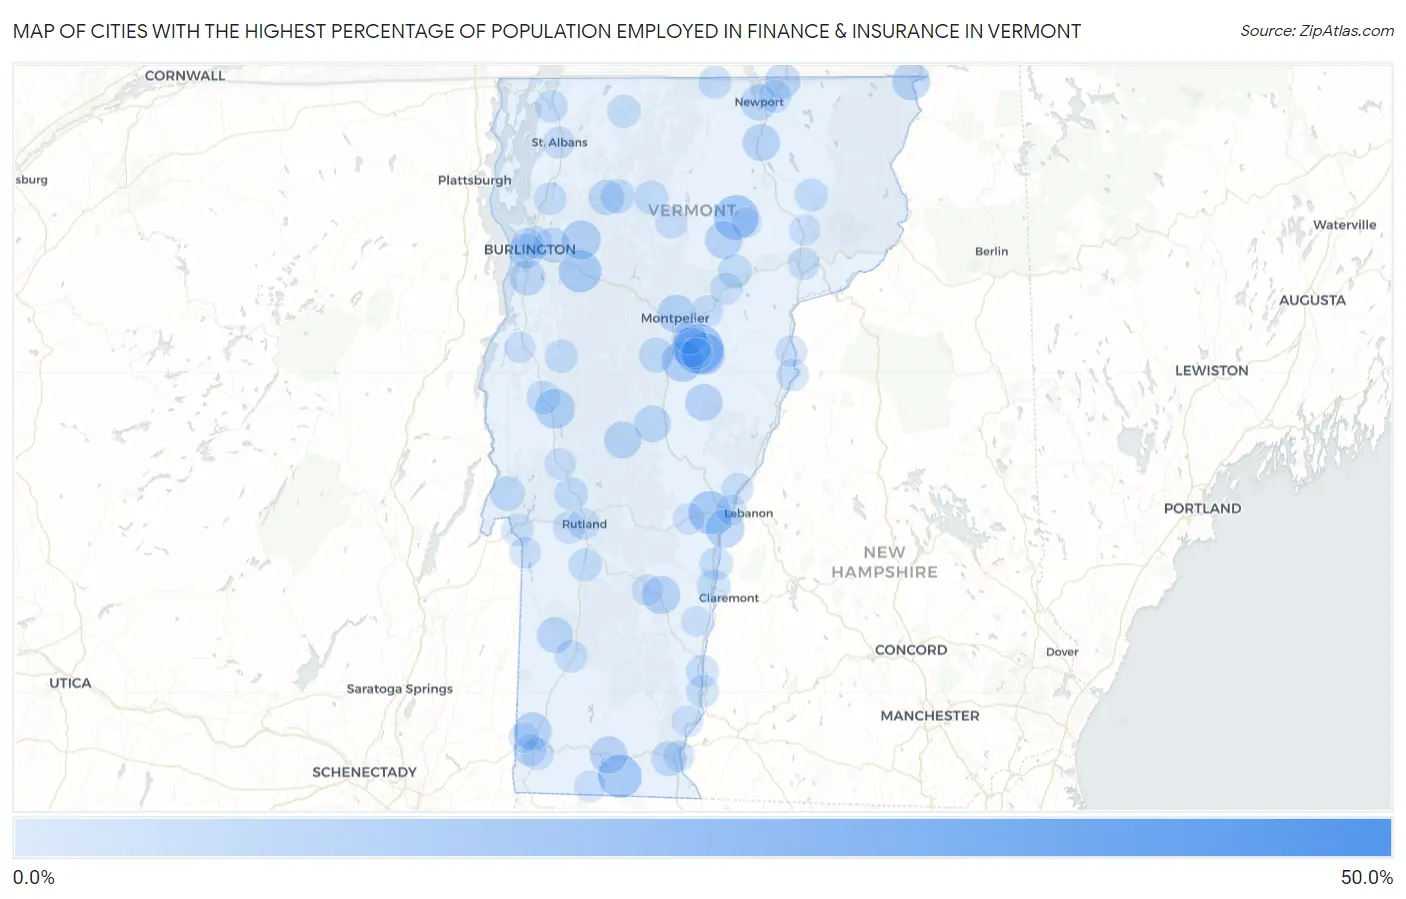
Cities with the Highest Percentage of Population Employed in Finance & Insurance in Vermont
| City | % Employed | vs State | vs National | |
| 1. | Hanksville | 50.0% | 3.2%(+46.8)#1 | 4.8%(+45.2)#45 |
| 2. | Highgate Center | 40.0% | 3.2%(+36.8)#2 | 4.8%(+35.2)#78 |
| 3. | Underhill Center | 40.0% | 3.2%(+36.8)#3 | 4.8%(+35.2)#80 |
| 4. | Stratton Mountain | 33.3% | 3.2%(+30.1)#4 | 4.8%(+28.6)#120 |
| 5. | Sutton | 19.4% | 3.2%(+16.2)#5 | 4.8%(+14.6)#403 |
| 6. | Websterville | 19.0% | 3.2%(+15.8)#6 | 4.8%(+14.2)#419 |
| 7. | Greensboro | 14.3% | 3.2%(+11.1)#7 | 4.8%(+9.52)#784 |
| 8. | Bakersfield | 13.8% | 3.2%(+10.6)#8 | 4.8%(+9.03)#860 |
| 9. | Jacksonville | 12.9% | 3.2%(+9.71)#9 | 4.8%(+8.14)#1,014 |
| 10. | Quechee | 12.5% | 3.2%(+9.31)#10 | 4.8%(+7.73)#1,092 |
| 11. | Richmond | 12.1% | 3.2%(+8.93)#11 | 4.8%(+7.35)#1,193 |
| 12. | East Barre | 11.8% | 3.2%(+8.58)#12 | 4.8%(+7.01)#1,292 |
| 13. | Williamstown | 10.8% | 3.2%(+7.59)#13 | 4.8%(+6.01)#1,607 |
| 14. | South Barre | 9.5% | 3.2%(+6.30)#14 | 4.8%(+4.72)#2,196 |
| 15. | East Middlebury | 9.4% | 3.2%(+6.25)#15 | 4.8%(+4.67)#2,228 |
| 16. | Jericho | 8.7% | 3.2%(+5.55)#16 | 4.8%(+3.97)#2,653 |
| 17. | North Hartland | 8.4% | 3.2%(+5.18)#17 | 4.8%(+3.61)#2,935 |
| 18. | Montpelier | 7.8% | 3.2%(+4.59)#18 | 4.8%(+3.01)#3,445 |
| 19. | Proctorsville | 7.8% | 3.2%(+4.57)#19 | 4.8%(+3.00)#3,459 |
| 20. | Canaan | 7.6% | 3.2%(+4.44)#20 | 4.8%(+2.87)#3,599 |
| 21. | South Shaftsbury | 7.6% | 3.2%(+4.41)#21 | 4.8%(+2.84)#3,634 |
| 22. | South Lincoln | 7.5% | 3.2%(+4.28)#22 | 4.8%(+2.71)#3,758 |
| 23. | Hardwick | 7.3% | 3.2%(+4.13)#23 | 4.8%(+2.56)#3,914 |
| 24. | Wilmington | 7.2% | 3.2%(+4.05)#24 | 4.8%(+2.48)#4,011 |
| 25. | Chelsea | 7.0% | 3.2%(+3.76)#25 | 4.8%(+2.18)#4,392 |
| 26. | Orleans | 6.9% | 3.2%(+3.72)#26 | 4.8%(+2.15)#4,433 |
| 27. | Rochester | 6.8% | 3.2%(+3.60)#27 | 4.8%(+2.03)#4,605 |
| 28. | Randolph | 6.6% | 3.2%(+3.41)#28 | 4.8%(+1.83)#4,867 |
| 29. | Stamford | 6.4% | 3.2%(+3.16)#29 | 4.8%(+1.59)#5,237 |
| 30. | Newport | 6.0% | 3.2%(+2.78)#30 | 4.8%(+1.21)#5,842 |
| 31. | Shelburne | 5.8% | 3.2%(+2.61)#31 | 4.8%(+1.04)#6,134 |
| 32. | Dorset | 5.8% | 3.2%(+2.56)#32 | 4.8%(+0.988)#6,223 |
| 33. | East Charlotte | 5.7% | 3.2%(+2.50)#33 | 4.8%(+0.924)#6,339 |
| 34. | Derby Line | 5.5% | 3.2%(+2.30)#34 | 4.8%(+0.731)#6,737 |
| 35. | West Woodstock | 5.4% | 3.2%(+2.19)#35 | 4.8%(+0.614)#6,949 |
| 36. | East Dorset | 5.3% | 3.2%(+2.13)#36 | 4.8%(+0.558)#7,064 |
| 37. | Cambridge | 5.2% | 3.2%(+1.99)#37 | 4.8%(+0.418)#7,350 |
| 38. | Essex Junction | 5.0% | 3.2%(+1.84)#38 | 4.8%(+0.265)#7,700 |
| 39. | Huntington | 4.9% | 3.2%(+1.68)#39 | 4.8%(+0.111)#8,049 |
| 40. | South Burlington | 4.9% | 3.2%(+1.66)#40 | 4.8%(+0.092)#8,092 |
| 41. | West Brattleboro | 4.8% | 3.2%(+1.65)#41 | 4.8%(+0.074)#8,145 |
| 42. | Northfield | 4.8% | 3.2%(+1.60)#42 | 4.8%(+0.028)#8,254 |
| 43. | Benson | 4.5% | 3.2%(+1.35)#43 | 4.8%(-0.222)#8,833 |
| 44. | Jeffersonville | 4.2% | 3.2%(+0.991)#44 | 4.8%(-0.581)#9,785 |
| 45. | Lunenburg | 3.9% | 3.2%(+0.742)#45 | 4.8%(-0.830)#10,535 |
| 46. | Middlebury | 3.9% | 3.2%(+0.738)#46 | 4.8%(-0.835)#10,545 |
| 47. | Pittsford | 3.7% | 3.2%(+0.524)#47 | 4.8%(-1.05)#11,187 |
| 48. | Johnson | 3.7% | 3.2%(+0.498)#48 | 4.8%(-1.07)#11,271 |
| 49. | Cabot | 3.7% | 3.2%(+0.475)#49 | 4.8%(-1.10)#11,334 |
| 50. | Barre | 3.6% | 3.2%(+0.435)#50 | 4.8%(-1.14)#11,446 |
| 51. | Ascutney | 3.5% | 3.2%(+0.277)#51 | 4.8%(-1.30)#11,922 |
| 52. | Windsor | 3.3% | 3.2%(+0.145)#52 | 4.8%(-1.43)#12,342 |
| 53. | Bristol | 3.3% | 3.2%(+0.056)#53 | 4.8%(-1.52)#12,660 |
| 54. | Harmonyville | 3.2% | 3.2%(-0.010)#54 | 4.8%(-1.58)#12,870 |
| 55. | Proctor | 3.2% | 3.2%(-0.027)#55 | 4.8%(-1.60)#12,919 |
| 56. | Enosburg Falls | 3.1% | 3.2%(-0.051)#56 | 4.8%(-1.62)#13,001 |
| 57. | Wallingford | 3.1% | 3.2%(-0.078)#57 | 4.8%(-1.65)#13,109 |
| 58. | Danby | 3.0% | 3.2%(-0.164)#58 | 4.8%(-1.74)#13,391 |
| 59. | West Burke | 2.9% | 3.2%(-0.254)#59 | 4.8%(-1.83)#13,685 |
| 60. | Pownal Center | 2.9% | 3.2%(-0.273)#60 | 4.8%(-1.85)#13,747 |
| 61. | Bellows Falls | 2.8% | 3.2%(-0.382)#61 | 4.8%(-1.95)#14,086 |
| 62. | Manchester Center | 2.7% | 3.2%(-0.452)#62 | 4.8%(-2.02)#14,307 |
| 63. | Milton | 2.7% | 3.2%(-0.458)#63 | 4.8%(-2.03)#14,344 |
| 64. | Derby Center | 2.7% | 3.2%(-0.458)#64 | 4.8%(-2.03)#14,345 |
| 65. | Winooski | 2.7% | 3.2%(-0.482)#65 | 4.8%(-2.06)#14,430 |
| 66. | Swanton | 2.7% | 3.2%(-0.523)#66 | 4.8%(-2.10)#14,551 |
| 67. | North Troy | 2.6% | 3.2%(-0.583)#67 | 4.8%(-2.16)#14,767 |
| 68. | Westminster | 2.6% | 3.2%(-0.593)#68 | 4.8%(-2.17)#14,794 |
| 69. | Burlington | 2.6% | 3.2%(-0.623)#69 | 4.8%(-2.20)#14,899 |
| 70. | Bennington | 2.5% | 3.2%(-0.714)#70 | 4.8%(-2.29)#15,221 |
| 71. | Old Bennington | 2.4% | 3.2%(-0.785)#71 | 4.8%(-2.36)#15,467 |
| 72. | Fair Haven | 2.3% | 3.2%(-0.892)#72 | 4.8%(-2.46)#15,842 |
| 73. | New Haven | 2.3% | 3.2%(-0.905)#73 | 4.8%(-2.48)#15,880 |
| 74. | Bolton Valley | 2.3% | 3.2%(-0.939)#74 | 4.8%(-2.51)#16,003 |
| 75. | West Rutland | 2.2% | 3.2%(-0.989)#75 | 4.8%(-2.56)#16,173 |
| 76. | Newbury | 2.2% | 3.2%(-1.03)#76 | 4.8%(-2.61)#16,328 |
| 77. | Marshfield | 2.2% | 3.2%(-1.03)#77 | 4.8%(-2.61)#16,329 |
| 78. | Morrisville | 2.1% | 3.2%(-1.07)#78 | 4.8%(-2.64)#16,448 |
| 79. | St Johnsbury | 2.1% | 3.2%(-1.13)#79 | 4.8%(-2.70)#16,655 |
| 80. | Plainfield | 2.0% | 3.2%(-1.21)#80 | 4.8%(-2.78)#16,936 |
| 81. | Rutland | 2.0% | 3.2%(-1.23)#81 | 4.8%(-2.81)#17,019 |
| 82. | Norwich | 1.8% | 3.2%(-1.36)#82 | 4.8%(-2.93)#17,424 |
| 83. | St Albans | 1.8% | 3.2%(-1.38)#83 | 4.8%(-2.95)#17,480 |
| 84. | Graniteville | 1.8% | 3.2%(-1.38)#84 | 4.8%(-2.96)#17,514 |
| 85. | Poultney | 1.7% | 3.2%(-1.48)#85 | 4.8%(-3.05)#17,866 |
| 86. | Wells River | 1.7% | 3.2%(-1.50)#86 | 4.8%(-3.07)#17,942 |
| 87. | Woodstock | 1.6% | 3.2%(-1.61)#87 | 4.8%(-3.18)#18,301 |
| 88. | Readsboro | 1.6% | 3.2%(-1.61)#88 | 4.8%(-3.18)#18,308 |
| 89. | Putney | 1.6% | 3.2%(-1.62)#89 | 4.8%(-3.19)#18,351 |
| 90. | Brandon | 1.4% | 3.2%(-1.76)#90 | 4.8%(-3.33)#18,826 |
| 91. | Ludlow | 1.3% | 3.2%(-1.89)#91 | 4.8%(-3.46)#19,233 |
| 92. | Brattleboro | 1.3% | 3.2%(-1.89)#92 | 4.8%(-3.46)#19,238 |
| 93. | Vergennes | 1.2% | 3.2%(-1.95)#93 | 4.8%(-3.53)#19,451 |
| 94. | Lyndonville | 1.1% | 3.2%(-2.13)#94 | 4.8%(-3.70)#19,957 |
| 95. | Greensboro Bend | 0.72% | 3.2%(-2.48)#95 | 4.8%(-4.05)#20,894 |
| 96. | White River Junction | 0.66% | 3.2%(-2.54)#96 | 4.8%(-4.11)#21,055 |
| 97. | North Bennington | 0.51% | 3.2%(-2.68)#97 | 4.8%(-4.25)#21,365 |
| 98. | Springfield | 0.51% | 3.2%(-2.68)#98 | 4.8%(-4.25)#21,367 |
1
2Common Questions
What are the Top 10 Cities with the Highest Percentage of Population Employed in Finance & Insurance in Vermont?
Top 10 Cities with the Highest Percentage of Population Employed in Finance & Insurance in Vermont are:
#1
19.0%
#2
14.3%
#3
12.9%
#4
12.5%
#5
12.1%
#6
11.8%
#7
10.8%
#8
9.5%
#9
9.4%
#10
8.7%
What city has the Highest Percentage of Population Employed in Finance & Insurance in Vermont?
Websterville has the Highest Percentage of Population Employed in Finance & Insurance in Vermont with 19.0%.
What is the Percentage of Population Employed in Finance & Insurance in the State of Vermont?
Percentage of Population Employed in Finance & Insurance in Vermont is 3.2%.
What is the Percentage of Population Employed in Finance & Insurance in the United States?
Percentage of Population Employed in Finance & Insurance in the United States is 4.8%.