Cities with the Highest Percentage of Population Employed in Finance & Insurance in Virginia
RELATED REPORTS & OPTIONS
Finance & Insurance
Virginia
Compare Cities
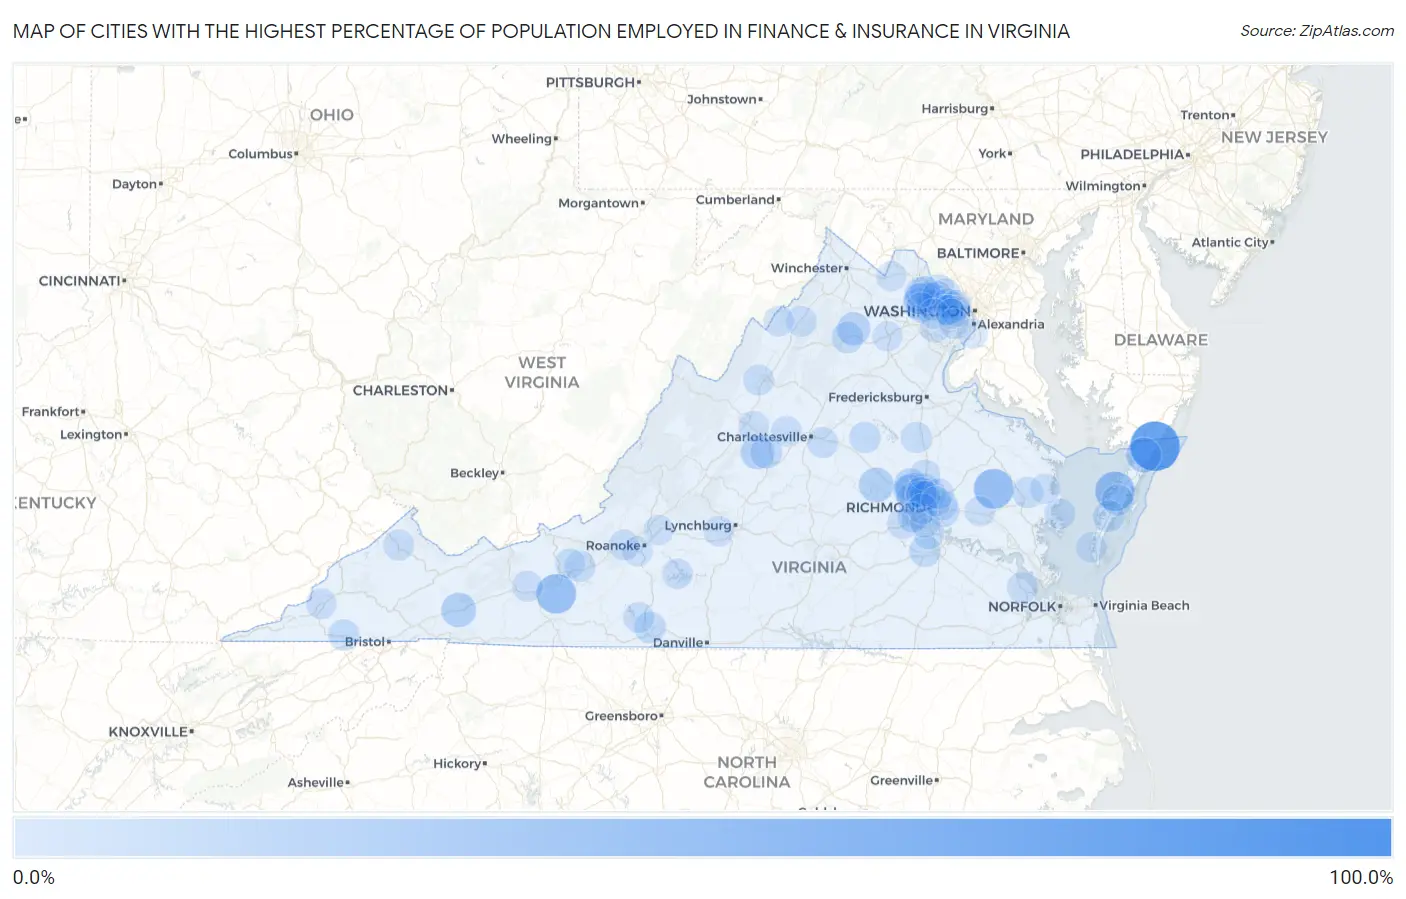
Map of Cities with the Highest Percentage of Population Employed in Finance & Insurance in Virginia
0.0%
100.0%
Cities with the Highest Percentage of Population Employed in Finance & Insurance in Virginia
| City | % Employed | vs State | vs National | |
| 1. | Keswick | 94.4% | 4.6%(+89.8)#1 | 4.8%(+89.6)#12 |
| 2. | Horntown | 78.2% | 4.6%(+73.6)#2 | 4.8%(+73.4)#14 |
| 3. | King And Queen Court House | 41.2% | 4.6%(+36.6)#3 | 4.8%(+36.4)#73 |
| 4. | Bobtown | 40.7% | 4.6%(+36.1)#4 | 4.8%(+35.9)#76 |
| 5. | Allisonia | 40.0% | 4.6%(+35.4)#5 | 4.8%(+35.2)#81 |
| 6. | Temperanceville | 24.0% | 4.6%(+19.4)#6 | 4.8%(+19.2)#241 |
| 7. | Goochland | 22.7% | 4.6%(+18.1)#7 | 4.8%(+17.9)#268 |
| 8. | Mcmullin | 22.3% | 4.6%(+17.7)#8 | 4.8%(+17.5)#277 |
| 9. | Disputanta | 19.7% | 4.6%(+15.1)#9 | 4.8%(+14.9)#384 |
| 10. | Wintergreen | 18.6% | 4.6%(+14.0)#10 | 4.8%(+13.8)#433 |
| 11. | Innsbrook | 18.5% | 4.6%(+13.9)#11 | 4.8%(+13.7)#438 |
| 12. | Flint Hill | 17.8% | 4.6%(+13.2)#12 | 4.8%(+13.0)#482 |
| 13. | Wyndham | 16.3% | 4.6%(+11.7)#13 | 4.8%(+11.5)#571 |
| 14. | Nellysford | 13.3% | 4.6%(+8.71)#14 | 4.8%(+8.54)#945 |
| 15. | Tuckahoe | 12.4% | 4.6%(+7.82)#15 | 4.8%(+7.65)#1,124 |
| 16. | Loudoun Valley Estates | 12.4% | 4.6%(+7.80)#16 | 4.8%(+7.62)#1,128 |
| 17. | Port Republic | 12.2% | 4.6%(+7.61)#17 | 4.8%(+7.43)#1,174 |
| 18. | Arcola | 12.1% | 4.6%(+7.56)#18 | 4.8%(+7.38)#1,188 |
| 19. | Washington | 11.8% | 4.6%(+7.18)#19 | 4.8%(+7.00)#1,301 |
| 20. | Villa Heights | 11.5% | 4.6%(+6.95)#20 | 4.8%(+6.77)#1,352 |
| 21. | Matoaca | 11.5% | 4.6%(+6.94)#21 | 4.8%(+6.77)#1,358 |
| 22. | Mount Clifton | 11.3% | 4.6%(+6.73)#22 | 4.8%(+6.55)#1,424 |
| 23. | Lowes Island | 11.1% | 4.6%(+6.48)#23 | 4.8%(+6.30)#1,511 |
| 24. | Short Pump | 11.0% | 4.6%(+6.38)#24 | 4.8%(+6.20)#1,540 |
| 25. | Louisa | 10.9% | 4.6%(+6.27)#25 | 4.8%(+6.09)#1,581 |
| 26. | Nassawadox | 10.8% | 4.6%(+6.22)#26 | 4.8%(+6.04)#1,594 |
| 27. | Gate City | 10.8% | 4.6%(+6.21)#27 | 4.8%(+6.03)#1,600 |
| 28. | Painter | 10.8% | 4.6%(+6.16)#28 | 4.8%(+5.99)#1,619 |
| 29. | Sandston | 10.2% | 4.6%(+5.64)#29 | 4.8%(+5.46)#1,808 |
| 30. | Sully Square | 10.1% | 4.6%(+5.55)#30 | 4.8%(+5.37)#1,849 |
| 31. | Weems | 10.1% | 4.6%(+5.54)#31 | 4.8%(+5.36)#1,854 |
| 32. | Floris | 9.9% | 4.6%(+5.36)#32 | 4.8%(+5.18)#1,939 |
| 33. | Midlothian | 9.9% | 4.6%(+5.29)#33 | 4.8%(+5.11)#1,971 |
| 34. | Plum Creek | 9.9% | 4.6%(+5.27)#34 | 4.8%(+5.09)#1,984 |
| 35. | Lake Land Or | 9.8% | 4.6%(+5.20)#35 | 4.8%(+5.02)#2,017 |
| 36. | One Loudoun | 9.8% | 4.6%(+5.18)#36 | 4.8%(+5.00)#2,031 |
| 37. | Grundy | 9.7% | 4.6%(+5.16)#37 | 4.8%(+4.98)#2,040 |
| 38. | Urbanna | 9.6% | 4.6%(+5.03)#38 | 4.8%(+4.85)#2,101 |
| 39. | Manchester | 9.6% | 4.6%(+5.02)#39 | 4.8%(+4.84)#2,106 |
| 40. | Glen Allen | 9.6% | 4.6%(+5.00)#40 | 4.8%(+4.83)#2,115 |
| 41. | Great Falls | 9.4% | 4.6%(+4.84)#41 | 4.8%(+4.66)#2,238 |
| 42. | Chamberlayne | 9.3% | 4.6%(+4.75)#42 | 4.8%(+4.57)#2,280 |
| 43. | Dumbarton | 9.2% | 4.6%(+4.65)#43 | 4.8%(+4.47)#2,340 |
| 44. | Chester | 9.1% | 4.6%(+4.49)#44 | 4.8%(+4.31)#2,430 |
| 45. | Smithfield | 9.0% | 4.6%(+4.42)#45 | 4.8%(+4.24)#2,488 |
| 46. | Tysons | 9.0% | 4.6%(+4.37)#46 | 4.8%(+4.19)#2,512 |
| 47. | Stewartsville | 8.9% | 4.6%(+4.31)#47 | 4.8%(+4.13)#2,553 |
| 48. | Dayton | 8.8% | 4.6%(+4.24)#48 | 4.8%(+4.06)#2,597 |
| 49. | Rivanna | 8.7% | 4.6%(+4.10)#49 | 4.8%(+3.92)#2,692 |
| 50. | Moorefield | 8.7% | 4.6%(+4.07)#50 | 4.8%(+3.89)#2,710 |
| 51. | Bassett | 8.6% | 4.6%(+4.04)#51 | 4.8%(+3.86)#2,733 |
| 52. | Oak Grove | 8.6% | 4.6%(+3.98)#52 | 4.8%(+3.80)#2,769 |
| 53. | Gwynn | 8.5% | 4.6%(+3.94)#53 | 4.8%(+3.77)#2,804 |
| 54. | Ashland | 8.5% | 4.6%(+3.91)#54 | 4.8%(+3.73)#2,837 |
| 55. | Edinburg | 8.4% | 4.6%(+3.82)#55 | 4.8%(+3.64)#2,910 |
| 56. | Woodlake | 8.4% | 4.6%(+3.81)#56 | 4.8%(+3.63)#2,921 |
| 57. | Max Meadows | 8.3% | 4.6%(+3.74)#57 | 4.8%(+3.57)#2,957 |
| 58. | Brambleton | 8.3% | 4.6%(+3.73)#58 | 4.8%(+3.55)#2,984 |
| 59. | Fishersville | 8.2% | 4.6%(+3.59)#59 | 4.8%(+3.41)#3,084 |
| 60. | Clifton | 8.2% | 4.6%(+3.56)#60 | 4.8%(+3.38)#3,103 |
| 61. | Highland Springs | 8.1% | 4.6%(+3.53)#61 | 4.8%(+3.35)#3,137 |
| 62. | Mechanicsville | 8.0% | 4.6%(+3.43)#62 | 4.8%(+3.25)#3,216 |
| 63. | Brucetown | 8.0% | 4.6%(+3.41)#63 | 4.8%(+3.23)#3,231 |
| 64. | Great Falls Crossing | 8.0% | 4.6%(+3.36)#64 | 4.8%(+3.18)#3,284 |
| 65. | Union Mill | 7.9% | 4.6%(+3.35)#65 | 4.8%(+3.17)#3,299 |
| 66. | Braddock | 7.9% | 4.6%(+3.35)#66 | 4.8%(+3.17)#3,302 |
| 67. | Lakeside | 7.9% | 4.6%(+3.35)#67 | 4.8%(+3.17)#3,309 |
| 68. | Broadlands | 7.9% | 4.6%(+3.30)#68 | 4.8%(+3.12)#3,343 |
| 69. | Laurel | 7.9% | 4.6%(+3.29)#69 | 4.8%(+3.11)#3,355 |
| 70. | Glenvar | 7.7% | 4.6%(+3.14)#70 | 4.8%(+2.96)#3,490 |
| 71. | Dranesville | 7.7% | 4.6%(+3.12)#71 | 4.8%(+2.94)#3,512 |
| 72. | Basye | 7.7% | 4.6%(+3.07)#72 | 4.8%(+2.89)#3,579 |
| 73. | Crozet | 7.6% | 4.6%(+3.06)#73 | 4.8%(+2.88)#3,591 |
| 74. | North Shore | 7.6% | 4.6%(+3.00)#74 | 4.8%(+2.82)#3,662 |
| 75. | Big Stone Gap | 7.4% | 4.6%(+2.77)#75 | 4.8%(+2.59)#3,879 |
| 76. | Baywood | 7.3% | 4.6%(+2.76)#76 | 4.8%(+2.58)#3,890 |
| 77. | Wolf Trap | 7.3% | 4.6%(+2.68)#77 | 4.8%(+2.50)#3,988 |
| 78. | Mclean | 7.2% | 4.6%(+2.65)#78 | 4.8%(+2.47)#4,025 |
| 79. | Ashburn | 7.1% | 4.6%(+2.55)#79 | 4.8%(+2.37)#4,155 |
| 80. | Rockwood | 7.0% | 4.6%(+2.46)#80 | 4.8%(+2.28)#4,261 |
| 81. | South Riding | 7.0% | 4.6%(+2.45)#81 | 4.8%(+2.27)#4,273 |
| 82. | Idylwood | 7.0% | 4.6%(+2.39)#82 | 4.8%(+2.21)#4,362 |
| 83. | Forest | 7.0% | 4.6%(+2.37)#83 | 4.8%(+2.19)#4,388 |
| 84. | Oakton | 6.9% | 4.6%(+2.34)#84 | 4.8%(+2.16)#4,419 |
| 85. | Richmond | 6.9% | 4.6%(+2.31)#85 | 4.8%(+2.13)#4,448 |
| 86. | New River | 6.9% | 4.6%(+2.27)#86 | 4.8%(+2.09)#4,521 |
| 87. | Round Hill | 6.8% | 4.6%(+2.24)#87 | 4.8%(+2.06)#4,560 |
| 88. | Cape Charles | 6.8% | 4.6%(+2.24)#88 | 4.8%(+2.06)#4,562 |
| 89. | New Kent | 6.8% | 4.6%(+2.17)#89 | 4.8%(+1.99)#4,657 |
| 90. | Meadowbrook | 6.6% | 4.6%(+2.05)#90 | 4.8%(+1.87)#4,818 |
| 91. | Cave Spring | 6.6% | 4.6%(+1.98)#91 | 4.8%(+1.80)#4,915 |
| 92. | Vienna | 6.6% | 4.6%(+1.97)#92 | 4.8%(+1.79)#4,927 |
| 93. | East Highland Park | 6.5% | 4.6%(+1.96)#93 | 4.8%(+1.78)#4,951 |
| 94. | Irvington | 6.5% | 4.6%(+1.95)#94 | 4.8%(+1.77)#4,957 |
| 95. | Blue Ridge | 6.5% | 4.6%(+1.94)#95 | 4.8%(+1.76)#4,961 |
| 96. | Warrenton | 6.5% | 4.6%(+1.92)#96 | 4.8%(+1.74)#4,995 |
| 97. | Fort Hunt | 6.5% | 4.6%(+1.92)#97 | 4.8%(+1.74)#4,998 |
| 98. | Greenbriar | 6.5% | 4.6%(+1.91)#98 | 4.8%(+1.73)#5,017 |
| 99. | Ravensworth | 6.4% | 4.6%(+1.86)#99 | 4.8%(+1.68)#5,108 |
| 100. | Merrifield | 6.3% | 4.6%(+1.70)#100 | 4.8%(+1.53)#5,316 |
Common Questions
What are the Top 10 Cities with the Highest Percentage of Population Employed in Finance & Insurance in Virginia?
Top 10 Cities with the Highest Percentage of Population Employed in Finance & Insurance in Virginia are:
#1
78.2%
#2
41.2%
#3
40.7%
#4
40.0%
#5
24.0%
#6
22.7%
#7
22.3%
#8
18.6%
#9
18.5%
#10
17.8%
What city has the Highest Percentage of Population Employed in Finance & Insurance in Virginia?
Horntown has the Highest Percentage of Population Employed in Finance & Insurance in Virginia with 78.2%.
What is the Percentage of Population Employed in Finance & Insurance in the State of Virginia?
Percentage of Population Employed in Finance & Insurance in Virginia is 4.6%.
What is the Percentage of Population Employed in Finance & Insurance in the United States?
Percentage of Population Employed in Finance & Insurance in the United States is 4.8%.