Cities with the Highest Percentage of Population Employed in Finance & Insurance in Mississippi
RELATED REPORTS & OPTIONS
Finance & Insurance
Mississippi
Compare Cities
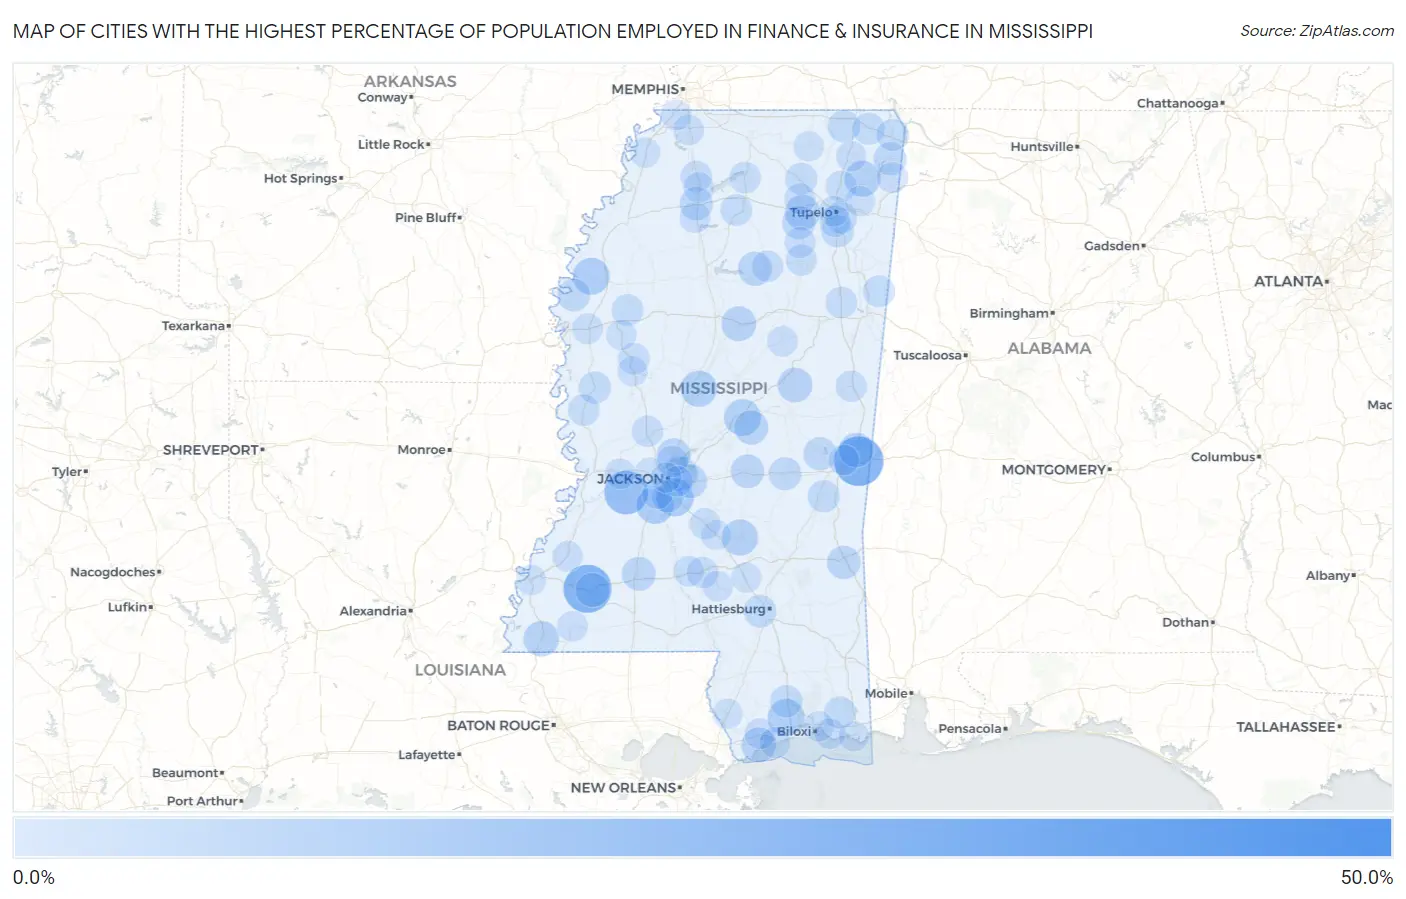
Map of Cities with the Highest Percentage of Population Employed in Finance & Insurance in Mississippi
0.0%
50.0%
Cities with the Highest Percentage of Population Employed in Finance & Insurance in Mississippi
| City | % Employed | vs State | vs National | |
| 1. | Redwood | 50.0% | 3.4%(+46.6)#1 | 4.8%(+45.2)#44 |
| 2. | Toomsuba | 30.2% | 3.4%(+26.8)#2 | 4.8%(+25.4)#153 |
| 3. | Meadville | 28.3% | 3.4%(+24.9)#3 | 4.8%(+23.5)#177 |
| 4. | De Soto | 24.8% | 3.4%(+21.4)#4 | 4.8%(+20.0)#226 |
| 5. | Learned | 22.2% | 3.4%(+18.8)#5 | 4.8%(+17.5)#281 |
| 6. | Florence | 13.8% | 3.4%(+10.4)#6 | 4.8%(+9.06)#856 |
| 7. | Terry | 13.8% | 3.4%(+10.4)#7 | 4.8%(+9.03)#859 |
| 8. | Lyman | 12.9% | 3.4%(+9.52)#8 | 4.8%(+8.15)#1,009 |
| 9. | Pace | 12.8% | 3.4%(+9.42)#9 | 4.8%(+8.05)#1,029 |
| 10. | Carthage | 12.5% | 3.4%(+9.14)#10 | 4.8%(+7.78)#1,085 |
| 11. | Goodman | 11.8% | 3.4%(+8.39)#11 | 4.8%(+7.02)#1,290 |
| 12. | Mize | 11.7% | 3.4%(+8.25)#12 | 4.8%(+6.88)#1,325 |
| 13. | Marietta | 11.3% | 3.4%(+7.85)#13 | 4.8%(+6.48)#1,449 |
| 14. | Woodville | 10.9% | 3.4%(+7.47)#14 | 4.8%(+6.10)#1,578 |
| 15. | Pontotoc | 10.5% | 3.4%(+7.10)#15 | 4.8%(+5.73)#1,707 |
| 16. | Kilmichael | 10.0% | 3.4%(+6.64)#16 | 4.8%(+5.27)#1,894 |
| 17. | Waveland | 9.8% | 3.4%(+6.44)#17 | 4.8%(+5.07)#1,994 |
| 18. | Noxapater | 9.8% | 3.4%(+6.37)#18 | 4.8%(+5.00)#2,032 |
| 19. | Kirkville | 9.6% | 3.4%(+6.16)#19 | 4.8%(+4.79)#2,137 |
| 20. | Flowood | 9.5% | 3.4%(+6.15)#20 | 4.8%(+4.78)#2,151 |
| 21. | Lauderdale | 9.5% | 3.4%(+6.07)#21 | 4.8%(+4.71)#2,205 |
| 22. | Bude | 9.1% | 3.4%(+5.73)#22 | 4.8%(+4.36)#2,400 |
| 23. | Standing Pine | 9.1% | 3.4%(+5.69)#23 | 4.8%(+4.32)#2,416 |
| 24. | Big Creek | 9.0% | 3.4%(+5.56)#24 | 4.8%(+4.19)#2,517 |
| 25. | Brandon | 8.8% | 3.4%(+5.42)#25 | 4.8%(+4.05)#2,611 |
| 26. | Brookhaven | 8.6% | 3.4%(+5.18)#26 | 4.8%(+3.82)#2,760 |
| 27. | Madison | 8.4% | 3.4%(+5.00)#27 | 4.8%(+3.63)#2,920 |
| 28. | Forest | 8.2% | 3.4%(+4.75)#28 | 4.8%(+3.39)#3,102 |
| 29. | Waynesboro | 8.1% | 3.4%(+4.70)#29 | 4.8%(+3.33)#3,151 |
| 30. | Collinsville | 7.9% | 3.4%(+4.49)#30 | 4.8%(+3.12)#3,342 |
| 31. | Batesville | 7.9% | 3.4%(+4.49)#31 | 4.8%(+3.12)#3,345 |
| 32. | Algoma | 7.7% | 3.4%(+4.25)#32 | 4.8%(+2.88)#3,586 |
| 33. | Newton | 7.2% | 3.4%(+3.85)#33 | 4.8%(+2.48)#4,007 |
| 34. | Tishomingo | 7.2% | 3.4%(+3.81)#34 | 4.8%(+2.44)#4,053 |
| 35. | Benoit | 7.1% | 3.4%(+3.74)#35 | 4.8%(+2.38)#4,126 |
| 36. | West Hattiesburg | 7.0% | 3.4%(+3.62)#36 | 4.8%(+2.25)#4,292 |
| 37. | Shannon | 6.6% | 3.4%(+3.19)#37 | 4.8%(+1.83)#4,875 |
| 38. | Kossuth | 6.5% | 3.4%(+3.05)#38 | 4.8%(+1.68)#5,093 |
| 39. | Enterprise | 6.4% | 3.4%(+3.01)#39 | 4.8%(+1.64)#5,159 |
| 40. | Cleary | 6.4% | 3.4%(+2.99)#40 | 4.8%(+1.62)#5,187 |
| 41. | Saucier | 6.3% | 3.4%(+2.92)#41 | 4.8%(+1.55)#5,285 |
| 42. | Glen | 6.2% | 3.4%(+2.85)#42 | 4.8%(+1.48)#5,378 |
| 43. | New Albany | 6.2% | 3.4%(+2.80)#43 | 4.8%(+1.43)#5,476 |
| 44. | Anguilla | 6.2% | 3.4%(+2.78)#44 | 4.8%(+1.41)#5,498 |
| 45. | Vancleave | 6.0% | 3.4%(+2.56)#45 | 4.8%(+1.20)#5,863 |
| 46. | Iuka | 6.0% | 3.4%(+2.56)#46 | 4.8%(+1.19)#5,872 |
| 47. | Plantersville | 5.9% | 3.4%(+2.48)#47 | 4.8%(+1.11)#5,999 |
| 48. | Sunflower | 5.7% | 3.4%(+2.30)#48 | 4.8%(+0.927)#6,326 |
| 49. | Victoria | 5.7% | 3.4%(+2.29)#49 | 4.8%(+0.921)#6,343 |
| 50. | Taylor | 5.6% | 3.4%(+2.25)#50 | 4.8%(+0.878)#6,432 |
| 51. | Caledonia | 5.6% | 3.4%(+2.21)#51 | 4.8%(+0.840)#6,520 |
| 52. | West Point | 5.5% | 3.4%(+2.11)#52 | 4.8%(+0.736)#6,726 |
| 53. | Ridgeland | 5.5% | 3.4%(+2.07)#53 | 4.8%(+0.698)#6,802 |
| 54. | Abbeville | 5.4% | 3.4%(+2.01)#54 | 4.8%(+0.638)#6,904 |
| 55. | Cary | 5.4% | 3.4%(+1.98)#55 | 4.8%(+0.609)#6,962 |
| 56. | Calhoun City | 5.3% | 3.4%(+1.94)#56 | 4.8%(+0.574)#7,023 |
| 57. | Belzoni | 5.3% | 3.4%(+1.94)#57 | 4.8%(+0.571)#7,029 |
| 58. | Bentonia | 5.3% | 3.4%(+1.91)#58 | 4.8%(+0.542)#7,099 |
| 59. | Verona | 5.3% | 3.4%(+1.89)#59 | 4.8%(+0.522)#7,137 |
| 60. | Guntown | 5.2% | 3.4%(+1.83)#60 | 4.8%(+0.466)#7,258 |
| 61. | Como | 5.2% | 3.4%(+1.82)#61 | 4.8%(+0.452)#7,282 |
| 62. | Prentiss | 5.2% | 3.4%(+1.77)#62 | 4.8%(+0.405)#7,376 |
| 63. | Shuqualak | 5.1% | 3.4%(+1.75)#63 | 4.8%(+0.380)#7,441 |
| 64. | Mendenhall | 5.0% | 3.4%(+1.63)#64 | 4.8%(+0.265)#7,702 |
| 65. | Houston | 4.9% | 3.4%(+1.49)#65 | 4.8%(+0.125)#8,011 |
| 66. | Leland | 4.7% | 3.4%(+1.32)#66 | 4.8%(-0.044)#8,421 |
| 67. | Belmont | 4.7% | 3.4%(+1.28)#67 | 4.8%(-0.087)#8,516 |
| 68. | Ecru | 4.7% | 3.4%(+1.25)#68 | 4.8%(-0.116)#8,582 |
| 69. | Pope | 4.6% | 3.4%(+1.21)#69 | 4.8%(-0.157)#8,671 |
| 70. | New Houlka | 4.6% | 3.4%(+1.19)#70 | 4.8%(-0.180)#8,728 |
| 71. | Diamondhead | 4.5% | 3.4%(+1.06)#71 | 4.8%(-0.312)#9,088 |
| 72. | Byram | 4.4% | 3.4%(+1.01)#72 | 4.8%(-0.355)#9,191 |
| 73. | Pass Christian | 4.4% | 3.4%(+0.998)#73 | 4.8%(-0.370)#9,234 |
| 74. | Bassfield | 4.3% | 3.4%(+0.949)#74 | 4.8%(-0.420)#9,357 |
| 75. | Silver Creek | 4.3% | 3.4%(+0.949)#75 | 4.8%(-0.420)#9,363 |
| 76. | Fayette | 4.3% | 3.4%(+0.923)#76 | 4.8%(-0.445)#9,419 |
| 77. | Sardis | 4.3% | 3.4%(+0.907)#77 | 4.8%(-0.461)#9,464 |
| 78. | Ackerman | 4.3% | 3.4%(+0.853)#78 | 4.8%(-0.516)#9,629 |
| 79. | Marion | 4.2% | 3.4%(+0.844)#79 | 4.8%(-0.525)#9,643 |
| 80. | Hernando | 4.2% | 3.4%(+0.825)#80 | 4.8%(-0.544)#9,695 |
| 81. | Tupelo | 4.2% | 3.4%(+0.801)#81 | 4.8%(-0.568)#9,755 |
| 82. | Gloster | 4.2% | 3.4%(+0.791)#82 | 4.8%(-0.577)#9,776 |
| 83. | Gulf Park Estates | 4.2% | 3.4%(+0.786)#83 | 4.8%(-0.582)#9,789 |
| 84. | Pearl | 4.1% | 3.4%(+0.743)#84 | 4.8%(-0.626)#9,924 |
| 85. | Edwards | 4.1% | 3.4%(+0.700)#85 | 4.8%(-0.669)#10,049 |
| 86. | St Martin | 4.1% | 3.4%(+0.688)#86 | 4.8%(-0.680)#10,071 |
| 87. | Booneville | 4.1% | 3.4%(+0.653)#87 | 4.8%(-0.715)#10,169 |
| 88. | Lynchburg | 4.1% | 3.4%(+0.652)#88 | 4.8%(-0.717)#10,172 |
| 89. | Tunica | 4.0% | 3.4%(+0.635)#89 | 4.8%(-0.733)#10,225 |
| 90. | Mantachie | 4.0% | 3.4%(+0.630)#90 | 4.8%(-0.739)#10,236 |
| 91. | Inverness | 4.0% | 3.4%(+0.581)#91 | 4.8%(-0.787)#10,396 |
| 92. | Ripley | 3.9% | 3.4%(+0.518)#92 | 4.8%(-0.851)#10,585 |
| 93. | Silver City | 3.8% | 3.4%(+0.399)#93 | 4.8%(-0.970)#10,953 |
| 94. | Jackson | 3.8% | 3.4%(+0.376)#94 | 4.8%(-0.993)#11,024 |
| 95. | Seminary | 3.8% | 3.4%(+0.375)#95 | 4.8%(-0.994)#11,029 |
| 96. | Picayune | 3.7% | 3.4%(+0.336)#96 | 4.8%(-1.03)#11,144 |
| 97. | Magee | 3.7% | 3.4%(+0.322)#97 | 4.8%(-1.05)#11,184 |
| 98. | Natchez | 3.7% | 3.4%(+0.300)#98 | 4.8%(-1.07)#11,254 |
| 99. | Clinton | 3.7% | 3.4%(+0.285)#99 | 4.8%(-1.08)#11,299 |
| 100. | Pascagoula | 3.7% | 3.4%(+0.264)#100 | 4.8%(-1.10)#11,353 |
Common Questions
What are the Top 10 Cities with the Highest Percentage of Population Employed in Finance & Insurance in Mississippi?
Top 10 Cities with the Highest Percentage of Population Employed in Finance & Insurance in Mississippi are:
What city has the Highest Percentage of Population Employed in Finance & Insurance in Mississippi?
Toomsuba has the Highest Percentage of Population Employed in Finance & Insurance in Mississippi with 30.2%.
What is the Percentage of Population Employed in Finance & Insurance in the State of Mississippi?
Percentage of Population Employed in Finance & Insurance in Mississippi is 3.4%.
What is the Percentage of Population Employed in Finance & Insurance in the United States?
Percentage of Population Employed in Finance & Insurance in the United States is 4.8%.