Cities with the Highest Percentage of Population Employed in Finance & Insurance in Connecticut
RELATED REPORTS & OPTIONS
Finance & Insurance
Connecticut
Compare Cities
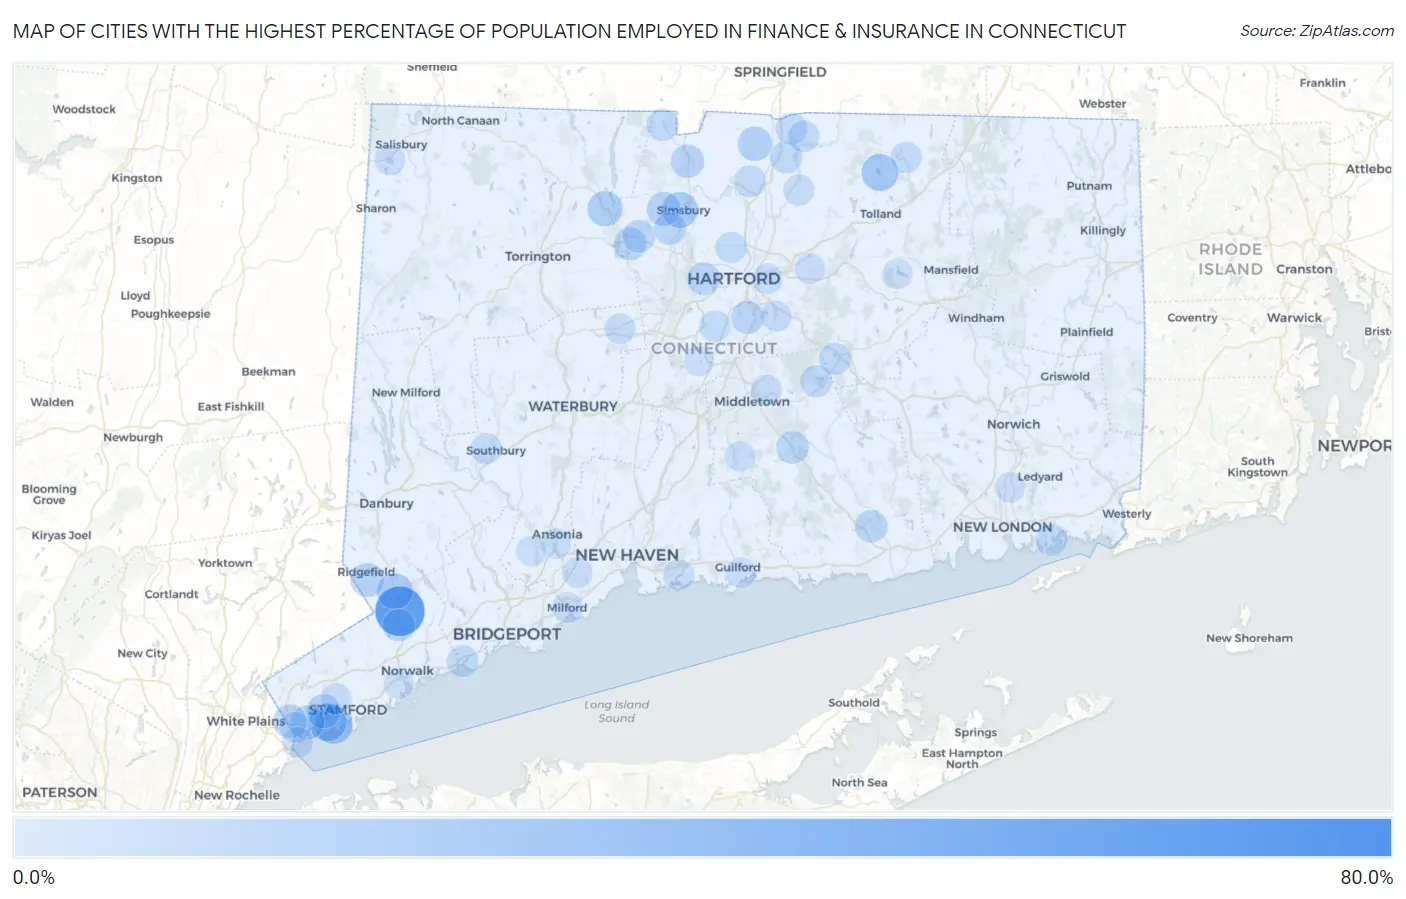
Map of Cities with the Highest Percentage of Population Employed in Finance & Insurance in Connecticut
0.0%
80.0%
Cities with the Highest Percentage of Population Employed in Finance & Insurance in Connecticut
| City | % Employed | vs State | vs National | |
| 1. | Sail Harbor | 62.2% | 7.3%(+54.8)#1 | 4.8%(+57.4)#22 |
| 2. | Cannondale | 52.9% | 7.3%(+45.6)#2 | 4.8%(+48.2)#36 |
| 3. | Tokeneke | 47.1% | 7.3%(+39.8)#3 | 4.8%(+42.4)#53 |
| 4. | Mamanasco Lake | 42.3% | 7.3%(+35.0)#4 | 4.8%(+37.6)#70 |
| 5. | Darien Downtown | 39.8% | 7.3%(+32.5)#5 | 4.8%(+35.0)#83 |
| 6. | Indian Field | 34.5% | 7.3%(+27.1)#6 | 4.8%(+29.7)#108 |
| 7. | Noroton | 30.5% | 7.3%(+23.2)#7 | 4.8%(+25.7)#149 |
| 8. | Murray | 29.0% | 7.3%(+21.7)#8 | 4.8%(+24.3)#169 |
| 9. | Saugatuck | 27.9% | 7.3%(+20.6)#9 | 4.8%(+23.2)#181 |
| 10. | Coleytown | 25.0% | 7.3%(+17.7)#10 | 4.8%(+20.2)#217 |
| 11. | Old Greenwich | 24.3% | 7.3%(+17.0)#11 | 4.8%(+19.6)#232 |
| 12. | Riverside | 24.2% | 7.3%(+16.9)#12 | 4.8%(+19.4)#236 |
| 13. | Brookfield Center | 23.0% | 7.3%(+15.7)#13 | 4.8%(+18.2)#262 |
| 14. | New Canaan | 22.3% | 7.3%(+14.9)#14 | 4.8%(+17.5)#278 |
| 15. | Crystal Lake | 22.2% | 7.3%(+14.9)#15 | 4.8%(+17.4)#284 |
| 16. | Westport | 21.6% | 7.3%(+14.3)#16 | 4.8%(+16.9)#304 |
| 17. | Poplar Plains | 21.6% | 7.3%(+14.2)#17 | 4.8%(+16.8)#306 |
| 18. | Simsbury Center | 20.3% | 7.3%(+13.0)#18 | 4.8%(+15.5)#351 |
| 19. | Compo | 20.2% | 7.3%(+12.9)#19 | 4.8%(+15.4)#355 |
| 20. | Topstone | 20.0% | 7.3%(+12.7)#20 | 4.8%(+15.2)#361 |
| 21. | Georgetown | 20.0% | 7.3%(+12.6)#21 | 4.8%(+15.2)#376 |
| 22. | Ridgebury | 19.7% | 7.3%(+12.4)#22 | 4.8%(+14.9)#383 |
| 23. | Knollcrest | 18.9% | 7.3%(+11.6)#23 | 4.8%(+14.2)#421 |
| 24. | Rock Ridge | 18.9% | 7.3%(+11.6)#24 | 4.8%(+14.1)#424 |
| 25. | New Hartford Center | 18.2% | 7.3%(+10.9)#25 | 4.8%(+13.4)#451 |
| 26. | Fenwick Borough | 17.6% | 7.3%(+10.3)#26 | 4.8%(+12.9)#491 |
| 27. | Greens Farms | 17.5% | 7.3%(+10.2)#27 | 4.8%(+12.8)#493 |
| 28. | Weston | 16.8% | 7.3%(+9.48)#28 | 4.8%(+12.0)#530 |
| 29. | Noroton Heights | 16.5% | 7.3%(+9.16)#29 | 4.8%(+11.7)#554 |
| 30. | Suffield Depot | 16.4% | 7.3%(+9.11)#30 | 4.8%(+11.7)#556 |
| 31. | Cos Cob | 16.0% | 7.3%(+8.66)#31 | 4.8%(+11.2)#595 |
| 32. | Greenwich | 15.8% | 7.3%(+8.47)#32 | 4.8%(+11.0)#612 |
| 33. | West Simsbury | 15.2% | 7.3%(+7.90)#33 | 4.8%(+10.5)#669 |
| 34. | Ridgefield | 15.2% | 7.3%(+7.86)#34 | 4.8%(+10.4)#673 |
| 35. | Glenville | 14.9% | 7.3%(+7.57)#35 | 4.8%(+10.1)#708 |
| 36. | Old Hill | 14.6% | 7.3%(+7.25)#36 | 4.8%(+9.82)#744 |
| 37. | Mill Plain | 14.3% | 7.3%(+6.98)#37 | 4.8%(+9.55)#771 |
| 38. | Salmon Brook | 14.1% | 7.3%(+6.77)#38 | 4.8%(+9.34)#822 |
| 39. | Tashua | 13.6% | 7.3%(+6.21)#39 | 4.8%(+8.78)#899 |
| 40. | Staples | 13.5% | 7.3%(+6.19)#40 | 4.8%(+8.76)#905 |
| 41. | Lakeside Woods | 13.3% | 7.3%(+5.94)#41 | 4.8%(+8.51)#950 |
| 42. | West Hartford | 13.1% | 7.3%(+5.79)#42 | 4.8%(+8.36)#972 |
| 43. | Collinsville | 13.1% | 7.3%(+5.76)#43 | 4.8%(+8.34)#978 |
| 44. | Wethersfield | 12.8% | 7.3%(+5.46)#44 | 4.8%(+8.03)#1,035 |
| 45. | Canton Valley | 12.6% | 7.3%(+5.27)#45 | 4.8%(+7.84)#1,075 |
| 46. | Essex Village | 12.4% | 7.3%(+5.03)#46 | 4.8%(+7.61)#1,130 |
| 47. | Higganum | 12.3% | 7.3%(+5.00)#47 | 4.8%(+7.57)#1,144 |
| 48. | East | 12.3% | 7.3%(+4.99)#48 | 4.8%(+7.57)#1,145 |
| 49. | Weatogue | 12.1% | 7.3%(+4.72)#49 | 4.8%(+7.29)#1,216 |
| 50. | Oronoque | 12.1% | 7.3%(+4.72)#50 | 4.8%(+7.29)#1,217 |
| 51. | Candlewood Orchards | 12.0% | 7.3%(+4.62)#51 | 4.8%(+7.19)#1,245 |
| 52. | Wilton Center | 11.9% | 7.3%(+4.60)#52 | 4.8%(+7.18)#1,251 |
| 53. | Bogus Hill | 11.6% | 7.3%(+4.24)#53 | 4.8%(+6.81)#1,345 |
| 54. | Lake Pocotopaug | 11.5% | 7.3%(+4.12)#54 | 4.8%(+6.70)#1,378 |
| 55. | North Granby | 11.3% | 7.3%(+3.96)#55 | 4.8%(+6.53)#1,434 |
| 56. | Terramuggus | 11.2% | 7.3%(+3.82)#56 | 4.8%(+6.39)#1,468 |
| 57. | Danielson Borough | 11.0% | 7.3%(+3.69)#57 | 4.8%(+6.26)#1,524 |
| 58. | Southwood Acres | 10.9% | 7.3%(+3.59)#58 | 4.8%(+6.16)#1,551 |
| 59. | Southport | 10.8% | 7.3%(+3.43)#59 | 4.8%(+6.01)#1,609 |
| 60. | Windsor Locks | 10.6% | 7.3%(+3.26)#60 | 4.8%(+5.83)#1,667 |
| 61. | Noank | 10.5% | 7.3%(+3.21)#61 | 4.8%(+5.78)#1,686 |
| 62. | Sherwood Manor | 10.5% | 7.3%(+3.12)#62 | 4.8%(+5.70)#1,716 |
| 63. | Hazardville | 10.1% | 7.3%(+2.78)#63 | 4.8%(+5.35)#1,856 |
| 64. | Newington | 9.9% | 7.3%(+2.53)#64 | 4.8%(+5.10)#1,979 |
| 65. | Stratford Downtown | 9.8% | 7.3%(+2.44)#65 | 4.8%(+5.02)#2,018 |
| 66. | Daniels Farm | 9.7% | 7.3%(+2.33)#66 | 4.8%(+4.90)#2,079 |
| 67. | Redding Center | 9.5% | 7.3%(+2.18)#67 | 4.8%(+4.76)#2,168 |
| 68. | Blue Hills | 9.4% | 7.3%(+2.06)#68 | 4.8%(+4.64)#2,251 |
| 69. | Stafford Springs | 9.3% | 7.3%(+1.94)#69 | 4.8%(+4.51)#2,314 |
| 70. | Riverton | 9.2% | 7.3%(+1.87)#70 | 4.8%(+4.44)#2,358 |
| 71. | Heritage Village | 9.0% | 7.3%(+1.68)#71 | 4.8%(+4.26)#2,471 |
| 72. | Pemberwick | 8.9% | 7.3%(+1.58)#72 | 4.8%(+4.16)#2,530 |
| 73. | Northford | 8.9% | 7.3%(+1.57)#73 | 4.8%(+4.15)#2,538 |
| 74. | Broad Brook | 8.9% | 7.3%(+1.52)#74 | 4.8%(+4.10)#2,576 |
| 75. | Stamford | 8.7% | 7.3%(+1.41)#75 | 4.8%(+3.98)#2,651 |
| 76. | Byram | 8.6% | 7.3%(+1.23)#76 | 4.8%(+3.81)#2,766 |
| 77. | West Mountain | 8.4% | 7.3%(+1.10)#77 | 4.8%(+3.68)#2,882 |
| 78. | Glastonbury Center | 8.2% | 7.3%(+0.874)#78 | 4.8%(+3.45)#3,054 |
| 79. | Portland | 8.2% | 7.3%(+0.872)#79 | 4.8%(+3.45)#3,056 |
| 80. | South Wilton | 8.2% | 7.3%(+0.827)#80 | 4.8%(+3.40)#3,091 |
| 81. | Lakes West | 8.1% | 7.3%(+0.759)#81 | 4.8%(+3.33)#3,153 |
| 82. | Branford Center | 8.1% | 7.3%(+0.738)#82 | 4.8%(+3.31)#3,169 |
| 83. | Bristol | 8.1% | 7.3%(+0.714)#83 | 4.8%(+3.29)#3,186 |
| 84. | Lakeville | 8.0% | 7.3%(+0.627)#84 | 4.8%(+3.20)#3,263 |
| 85. | Botsford | 7.8% | 7.3%(+0.440)#85 | 4.8%(+3.01)#3,446 |
| 86. | Lordship | 7.7% | 7.3%(+0.361)#86 | 4.8%(+2.94)#3,516 |
| 87. | Manchester | 7.6% | 7.3%(+0.230)#87 | 4.8%(+2.80)#3,670 |
| 88. | Newtown Borough | 7.5% | 7.3%(+0.178)#88 | 4.8%(+2.75)#3,720 |
| 89. | Derby | 7.5% | 7.3%(+0.137)#89 | 4.8%(+2.71)#3,754 |
| 90. | Milford City Balance | 7.5% | 7.3%(+0.126)#90 | 4.8%(+2.70)#3,764 |
| 91. | East Hartford | 7.4% | 7.3%(+0.084)#91 | 4.8%(+2.66)#3,811 |
| 92. | Durham | 7.4% | 7.3%(+0.073)#92 | 4.8%(+2.65)#3,823 |
| 93. | Gales Ferry | 7.2% | 7.3%(-0.154)#93 | 4.8%(+2.42)#4,076 |
| 94. | Coventry Lake | 7.1% | 7.3%(-0.198)#94 | 4.8%(+2.38)#4,115 |
| 95. | Orange | 7.1% | 7.3%(-0.229)#95 | 4.8%(+2.34)#4,182 |
| 96. | Norwalk | 7.0% | 7.3%(-0.342)#96 | 4.8%(+2.23)#4,323 |
| 97. | Guilford Center | 6.8% | 7.3%(-0.555)#97 | 4.8%(+2.02)#4,616 |
| 98. | Shelton | 6.8% | 7.3%(-0.568)#98 | 4.8%(+2.01)#4,636 |
| 99. | Sandy Hook | 6.7% | 7.3%(-0.637)#99 | 4.8%(+1.94)#4,729 |
| 100. | Kensington | 6.6% | 7.3%(-0.702)#100 | 4.8%(+1.87)#4,814 |
Common Questions
What are the Top 10 Cities with the Highest Percentage of Population Employed in Finance & Insurance in Connecticut?
Top 10 Cities with the Highest Percentage of Population Employed in Finance & Insurance in Connecticut are:
#1
52.9%
#2
24.3%
#3
24.2%
#4
22.2%
#5
20.3%
#6
20.0%
#7
18.2%
#8
16.4%
#9
16.0%
#10
15.8%
What city has the Highest Percentage of Population Employed in Finance & Insurance in Connecticut?
Cannondale has the Highest Percentage of Population Employed in Finance & Insurance in Connecticut with 52.9%.
What is the Percentage of Population Employed in Finance & Insurance in the State of Connecticut?
Percentage of Population Employed in Finance & Insurance in Connecticut is 7.3%.
What is the Percentage of Population Employed in Finance & Insurance in the United States?
Percentage of Population Employed in Finance & Insurance in the United States is 4.8%.