Cities with the Lowest Percentage of Renter-Occupied Units in Oklahoma
RELATED REPORTS & OPTIONS
Lowest Renter-Occupied
Oklahoma
Compare Cities
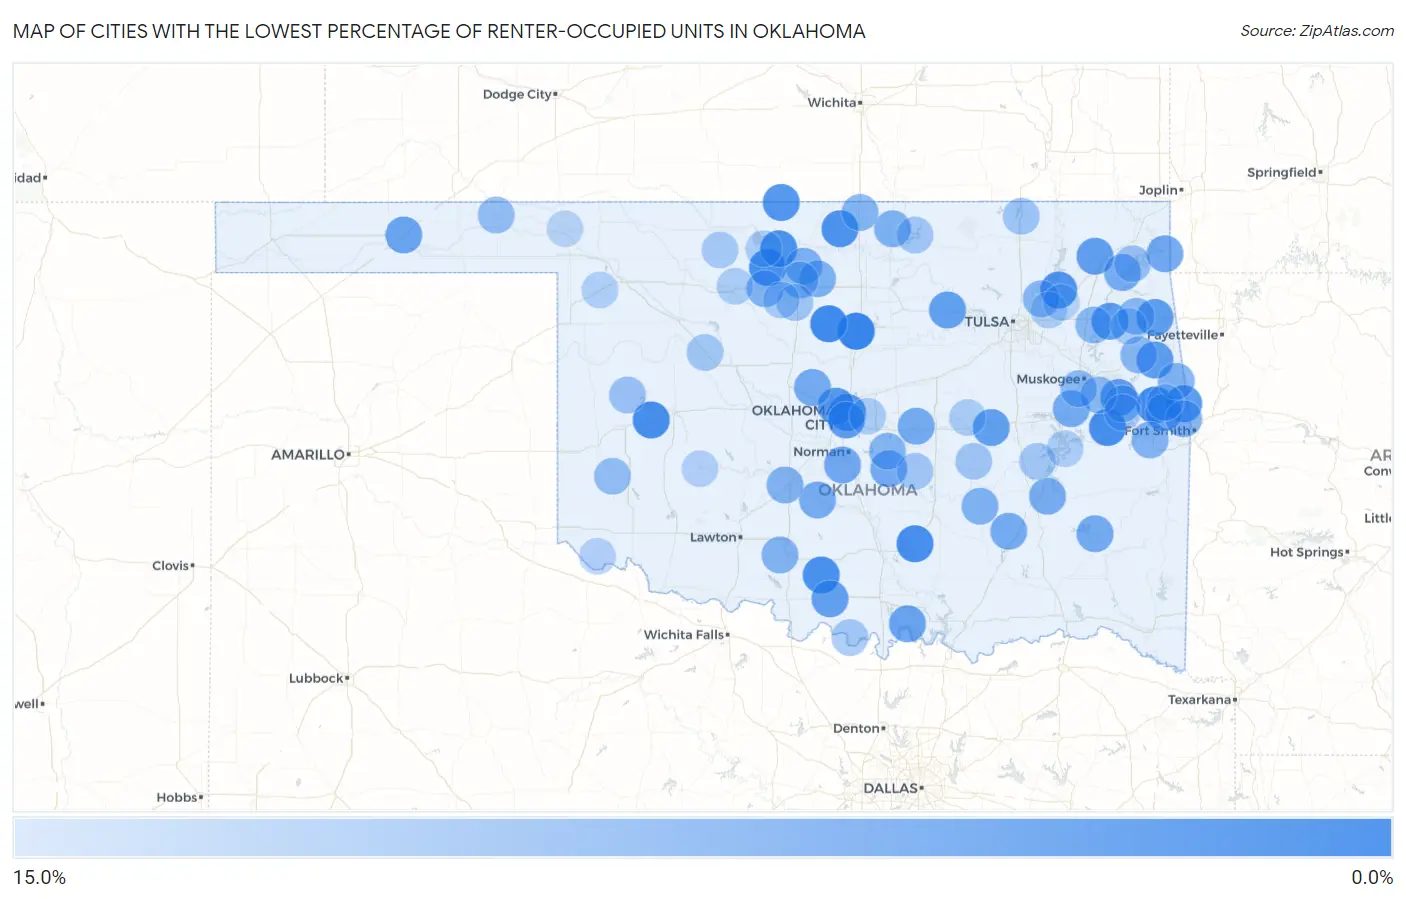
Map of Cities with the Lowest Percentage of Renter-Occupied Units in Oklahoma
15.0%
0.0%
Cities with the Lowest Percentage of Renter-Occupied Units in Oklahoma
| City | % Renter-Occupied | vs State | vs National | |
| 1. | Mulhall | 1.9% | 34.1%(-32.2)#1 | 35.2%(-33.3)#200 |
| 2. | Marshall | 2.5% | 34.1%(-31.5)#2 | 35.2%(-32.7)#369 |
| 3. | Brushy | 2.6% | 34.1%(-31.5)#3 | 35.2%(-32.6)#386 |
| 4. | Simms | 3.0% | 34.1%(-31.1)#4 | 35.2%(-32.2)#497 |
| 5. | Goltry | 3.0% | 34.1%(-31.1)#5 | 35.2%(-32.2)#499 |
| 6. | Foss | 3.0% | 34.1%(-31.0)#6 | 35.2%(-32.2)#517 |
| 7. | Hickory | 3.0% | 34.1%(-31.0)#7 | 35.2%(-32.2)#518 |
| 8. | Nash | 3.1% | 34.1%(-31.0)#8 | 35.2%(-32.1)#536 |
| 9. | Loco | 3.2% | 34.1%(-30.8)#9 | 35.2%(-32.0)#586 |
| 10. | Deer Creek | 3.4% | 34.1%(-30.6)#10 | 35.2%(-31.7)#658 |
| 11. | Sequoyah | 3.6% | 34.1%(-30.5)#11 | 35.2%(-31.6)#699 |
| 12. | Forest Park | 3.7% | 34.1%(-30.3)#12 | 35.2%(-31.5)#752 |
| 13. | Manchester | 3.8% | 34.1%(-30.3)#13 | 35.2%(-31.4)#772 |
| 14. | Short | 4.0% | 34.1%(-30.0)#14 | 35.2%(-31.1)#854 |
| 15. | Cookson | 4.1% | 34.1%(-29.9)#15 | 35.2%(-31.0)#879 |
| 16. | Nichols Hills | 4.1% | 34.1%(-29.9)#16 | 35.2%(-31.0)#880 |
| 17. | Iron Post | 4.3% | 34.1%(-29.7)#17 | 35.2%(-30.8)#953 |
| 18. | Titanic | 4.5% | 34.1%(-29.5)#18 | 35.2%(-30.6)#1,024 |
| 19. | Flint Creek | 4.7% | 34.1%(-29.4)#19 | 35.2%(-30.5)#1,090 |
| 20. | Paradise Hill | 4.8% | 34.1%(-29.3)#20 | 35.2%(-30.4)#1,122 |
| 21. | Utica | 4.8% | 34.1%(-29.3)#21 | 35.2%(-30.4)#1,128 |
| 22. | White Oak | 4.8% | 34.1%(-29.2)#22 | 35.2%(-30.3)#1,155 |
| 23. | Smith Village | 4.9% | 34.1%(-29.2)#23 | 35.2%(-30.3)#1,177 |
| 24. | Cornish | 4.9% | 34.1%(-29.1)#24 | 35.2%(-30.3)#1,191 |
| 25. | Hallett | 5.0% | 34.1%(-29.1)#25 | 35.2%(-30.2)#1,226 |
| 26. | Clearview | 5.0% | 34.1%(-29.1)#26 | 35.2%(-30.2)#1,227 |
| 27. | Lebanon | 5.4% | 34.1%(-28.7)#27 | 35.2%(-29.8)#1,391 |
| 28. | Hochatown | 5.4% | 34.1%(-28.6)#28 | 35.2%(-29.7)#1,400 |
| 29. | Akins | 5.4% | 34.1%(-28.6)#29 | 35.2%(-29.7)#1,407 |
| 30. | Taylor Ferry | 5.6% | 34.1%(-28.5)#30 | 35.2%(-29.6)#1,456 |
| 31. | Optima | 5.6% | 34.1%(-28.5)#31 | 35.2%(-29.6)#1,460 |
| 32. | Peckham | 5.9% | 34.1%(-28.2)#32 | 35.2%(-29.3)#1,603 |
| 33. | Goldsby | 6.1% | 34.1%(-28.0)#33 | 35.2%(-29.1)#1,663 |
| 34. | Cayuga | 6.1% | 34.1%(-27.9)#34 | 35.2%(-29.1)#1,693 |
| 35. | Piedmont | 6.2% | 34.1%(-27.8)#35 | 35.2%(-29.0)#1,719 |
| 36. | Tuskahoma | 6.2% | 34.1%(-27.8)#36 | 35.2%(-28.9)#1,749 |
| 37. | Tribbey | 6.3% | 34.1%(-27.8)#37 | 35.2%(-28.9)#1,761 |
| 38. | Johnson | 6.3% | 34.1%(-27.8)#38 | 35.2%(-28.9)#1,766 |
| 39. | Rentiesville | 6.4% | 34.1%(-27.7)#39 | 35.2%(-28.8)#1,799 |
| 40. | Wardville | 6.4% | 34.1%(-27.7)#40 | 35.2%(-28.8)#1,800 |
| 41. | Alderson | 6.5% | 34.1%(-27.6)#41 | 35.2%(-28.7)#1,844 |
| 42. | Bradley | 6.5% | 34.1%(-27.6)#42 | 35.2%(-28.7)#1,847 |
| 43. | Grand Lake Towne | 6.6% | 34.1%(-27.5)#43 | 35.2%(-28.6)#1,877 |
| 44. | Kremlin | 6.8% | 34.1%(-27.2)#44 | 35.2%(-28.4)#1,977 |
| 45. | Kildare | 6.9% | 34.1%(-27.2)#45 | 35.2%(-28.3)#2,006 |
| 46. | Breckenridge | 7.0% | 34.1%(-27.0)#46 | 35.2%(-28.2)#2,063 |
| 47. | Meno | 7.1% | 34.1%(-26.9)#47 | 35.2%(-28.0)#2,128 |
| 48. | Gerty | 7.1% | 34.1%(-26.9)#48 | 35.2%(-28.0)#2,141 |
| 49. | Empire City | 7.2% | 34.1%(-26.8)#49 | 35.2%(-28.0)#2,166 |
| 50. | Redbird Smith | 7.2% | 34.1%(-26.8)#50 | 35.2%(-27.9)#2,174 |
| 51. | Norge | 7.2% | 34.1%(-26.8)#51 | 35.2%(-27.9)#2,180 |
| 52. | Remy | 7.3% | 34.1%(-26.8)#52 | 35.2%(-27.9)#2,200 |
| 53. | Bell | 7.3% | 34.1%(-26.7)#53 | 35.2%(-27.9)#2,213 |
| 54. | Cowlington | 7.5% | 34.1%(-26.6)#54 | 35.2%(-27.7)#2,301 |
| 55. | Braman | 7.6% | 34.1%(-26.5)#55 | 35.2%(-27.6)#2,337 |
| 56. | Briartown | 7.6% | 34.1%(-26.5)#56 | 35.2%(-27.6)#2,338 |
| 57. | Pink | 7.7% | 34.1%(-26.4)#57 | 35.2%(-27.5)#2,367 |
| 58. | Limestone | 7.7% | 34.1%(-26.3)#58 | 35.2%(-27.5)#2,421 |
| 59. | Briggs | 7.7% | 34.1%(-26.3)#59 | 35.2%(-27.5)#2,423 |
| 60. | Leach | 7.8% | 34.1%(-26.3)#60 | 35.2%(-27.4)#2,447 |
| 61. | North Enid | 7.9% | 34.1%(-26.2)#61 | 35.2%(-27.3)#2,507 |
| 62. | Pin Oak Acres | 7.9% | 34.1%(-26.2)#62 | 35.2%(-27.3)#2,508 |
| 63. | River Bottom | 8.0% | 34.1%(-26.1)#63 | 35.2%(-27.2)#2,522 |
| 64. | Leonard | 8.0% | 34.1%(-26.1)#64 | 35.2%(-27.2)#2,538 |
| 65. | Norwood | 8.0% | 34.1%(-26.0)#65 | 35.2%(-27.2)#2,554 |
| 66. | Summit | 8.1% | 34.1%(-26.0)#66 | 35.2%(-27.1)#2,595 |
| 67. | Keefton | 8.5% | 34.1%(-25.6)#67 | 35.2%(-26.7)#2,761 |
| 68. | Forgan | 8.6% | 34.1%(-25.5)#68 | 35.2%(-26.6)#2,804 |
| 69. | Willow | 8.6% | 34.1%(-25.5)#69 | 35.2%(-26.6)#2,807 |
| 70. | Ingalls | 8.7% | 34.1%(-25.4)#70 | 35.2%(-26.5)#2,877 |
| 71. | Hammon | 8.9% | 34.1%(-25.2)#71 | 35.2%(-26.3)#2,986 |
| 72. | Cleora | 8.9% | 34.1%(-25.1)#72 | 35.2%(-26.3)#2,990 |
| 73. | Preston | 8.9% | 34.1%(-25.1)#73 | 35.2%(-26.3)#3,000 |
| 74. | Shady Grove Cdp Cherokee County | 9.3% | 34.1%(-24.8)#74 | 35.2%(-25.9)#3,203 |
| 75. | Copan | 9.3% | 34.1%(-24.8)#75 | 35.2%(-25.9)#3,207 |
| 76. | Waukomis | 9.4% | 34.1%(-24.7)#76 | 35.2%(-25.8)#3,242 |
| 77. | Little Rock | 9.4% | 34.1%(-24.6)#77 | 35.2%(-25.7)#3,280 |
| 78. | Yeager | 9.4% | 34.1%(-24.6)#78 | 35.2%(-25.7)#3,282 |
| 79. | St Louis | 9.5% | 34.1%(-24.5)#79 | 35.2%(-25.7)#3,342 |
| 80. | Indianola | 9.6% | 34.1%(-24.4)#80 | 35.2%(-25.6)#3,380 |
| 81. | Kaw City | 9.6% | 34.1%(-24.4)#81 | 35.2%(-25.5)#3,397 |
| 82. | Oakwood | 9.7% | 34.1%(-24.4)#82 | 35.2%(-25.5)#3,414 |
| 83. | Leon | 9.8% | 34.1%(-24.3)#83 | 35.2%(-25.4)#3,452 |
| 84. | Dacoma | 10.0% | 34.1%(-24.1)#84 | 35.2%(-25.2)#3,584 |
| 85. | Drummond | 10.1% | 34.1%(-24.0)#85 | 35.2%(-25.1)#3,619 |
| 86. | Cleo Springs | 10.3% | 34.1%(-23.8)#86 | 35.2%(-24.9)#3,743 |
| 87. | Stoney Point | 10.3% | 34.1%(-23.7)#87 | 35.2%(-24.8)#3,772 |
| 88. | Little Ponderosa | 10.4% | 34.1%(-23.7)#88 | 35.2%(-24.8)#3,783 |
| 89. | Castle | 10.4% | 34.1%(-23.7)#89 | 35.2%(-24.8)#3,787 |
| 90. | Choctaw | 10.4% | 34.1%(-23.7)#90 | 35.2%(-24.8)#3,796 |
| 91. | Teresita | 10.4% | 34.1%(-23.6)#91 | 35.2%(-24.8)#3,802 |
| 92. | Jet | 10.4% | 34.1%(-23.6)#92 | 35.2%(-24.7)#3,819 |
| 93. | Verdigris | 10.5% | 34.1%(-23.6)#93 | 35.2%(-24.7)#3,841 |
| 94. | Longtown | 10.5% | 34.1%(-23.5)#94 | 35.2%(-24.7)#3,849 |
| 95. | Fargo | 10.6% | 34.1%(-23.4)#95 | 35.2%(-24.6)#3,904 |
| 96. | Carlisle | 10.7% | 34.1%(-23.4)#96 | 35.2%(-24.5)#3,928 |
| 97. | Eldorado | 10.7% | 34.1%(-23.3)#97 | 35.2%(-24.4)#3,980 |
| 98. | Mountain View | 10.8% | 34.1%(-23.3)#98 | 35.2%(-24.4)#4,005 |
| 99. | Justice | 11.0% | 34.1%(-23.1)#99 | 35.2%(-24.2)#4,126 |
| 100. | Rosston | 11.1% | 34.1%(-22.9)#100 | 35.2%(-24.1)#4,198 |
Common Questions
What are the Top 10 Cities with the Lowest Percentage of Renter-Occupied Units in Oklahoma?
Top 10 Cities with the Lowest Percentage of Renter-Occupied Units in Oklahoma are:
What city has the Lowest Percentage of Renter-Occupied Units in Oklahoma?
Mulhall has the Lowest Percentage of Renter-Occupied Units in Oklahoma with 1.9%.
What is the Percentage of Renter-Occupied Units in the State of Oklahoma?
Percentage of Renter-Occupied Units in Oklahoma is 34.1%.
What is the Percentage of Renter-Occupied Units in the United States?
Percentage of Renter-Occupied Units in the United States is 35.2%.