Auburn Lake Trails, CA Map & Demographics
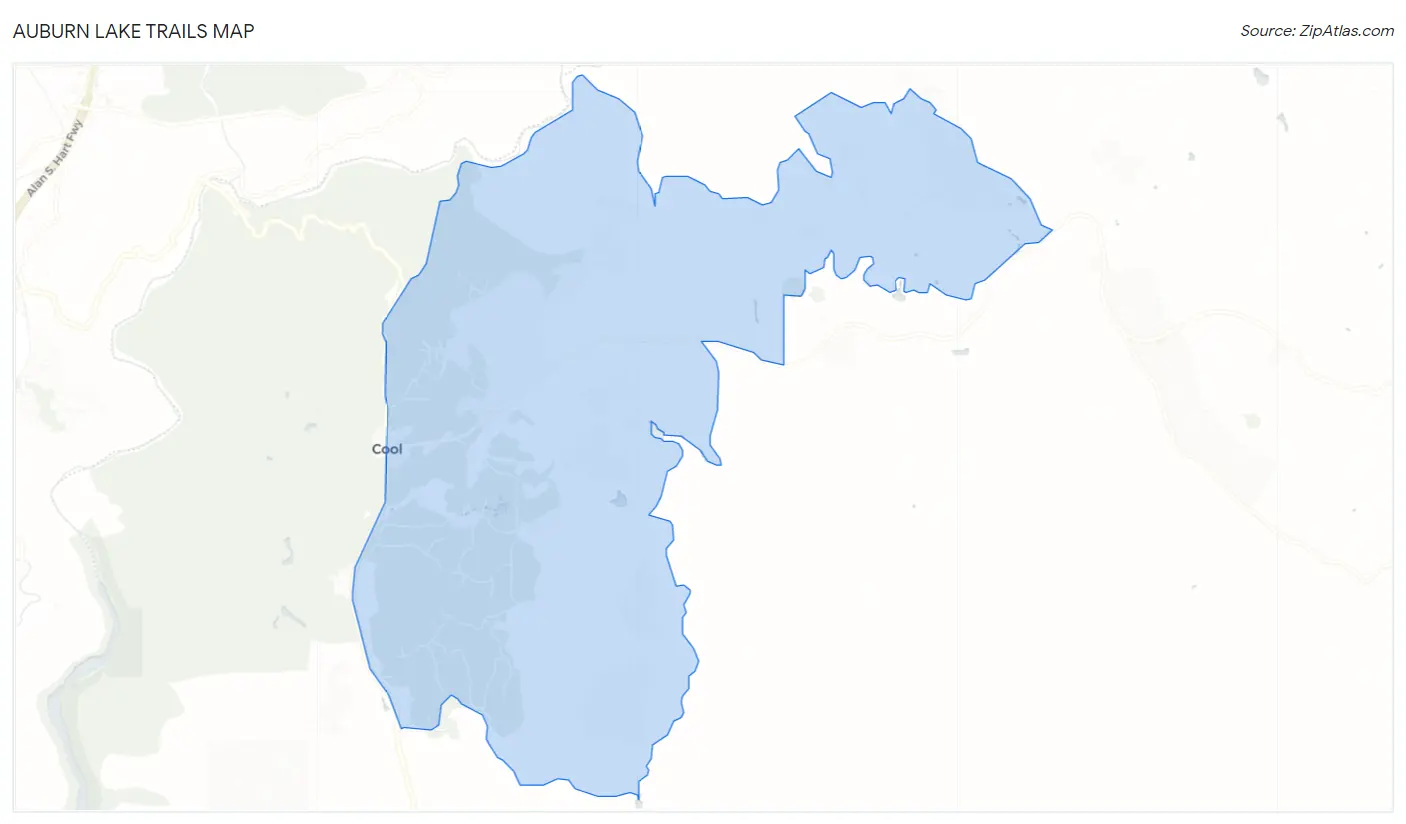
Auburn Lake Trails Map
Auburn Lake Trails Overview
$55,111
PER CAPITA INCOME
$140,430
AVG FAMILY INCOME
$122,639
AVG HOUSEHOLD INCOME
31.4%
WAGE / INCOME GAP [ % ]
68.6¢/ $1
WAGE / INCOME GAP [ $ ]
0.37
INEQUALITY / GINI INDEX
3,846
TOTAL POPULATION
1,763
MALE POPULATION
2,083
FEMALE POPULATION
84.64
MALES / 100 FEMALES
118.15
FEMALES / 100 MALES
55.1
MEDIAN AGE
2.9
AVG FAMILY SIZE
2.5
AVG HOUSEHOLD SIZE
1,829
LABOR FORCE [ PEOPLE ]
55.6%
PERCENT IN LABOR FORCE
4.0%
UNEMPLOYMENT RATE
Income in Auburn Lake Trails
Income Overview in Auburn Lake Trails
Per Capita Income in Auburn Lake Trails is $55,111, while median incomes of families and households are $140,430 and $122,639 respectively.
| Characteristic | Number | Measure |
| Per Capita Income | 3,846 | $55,111 |
| Median Family Income | 1,117 | $140,430 |
| Mean Family Income | 1,117 | $157,692 |
| Median Household Income | 1,518 | $122,639 |
| Mean Household Income | 1,518 | $138,736 |
| Income Deficit | 1,117 | $0 |
| Wage / Income Gap (%) | 3,846 | 31.36% |
| Wage / Income Gap ($) | 3,846 | 68.64¢ per $1 |
| Gini / Inequality Index | 3,846 | 0.37 |
Earnings by Sex in Auburn Lake Trails
Average Earnings in Auburn Lake Trails are $59,495, $68,361 for men and $46,923 for women, a difference of 31.4%.
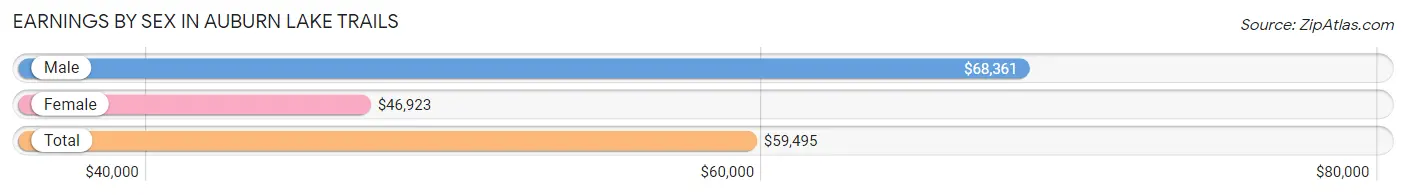
| Sex | Number | Average Earnings |
| Male | 881 (47.3%) | $68,361 |
| Female | 982 (52.7%) | $46,923 |
| Total | 1,863 (100.0%) | $59,495 |
Earnings by Sex by Income Bracket in Auburn Lake Trails
The most common earnings brackets in Auburn Lake Trails are $100,000+ for men (345 | 39.2%) and $75,000 to $99,999 for women (177 | 18.0%).
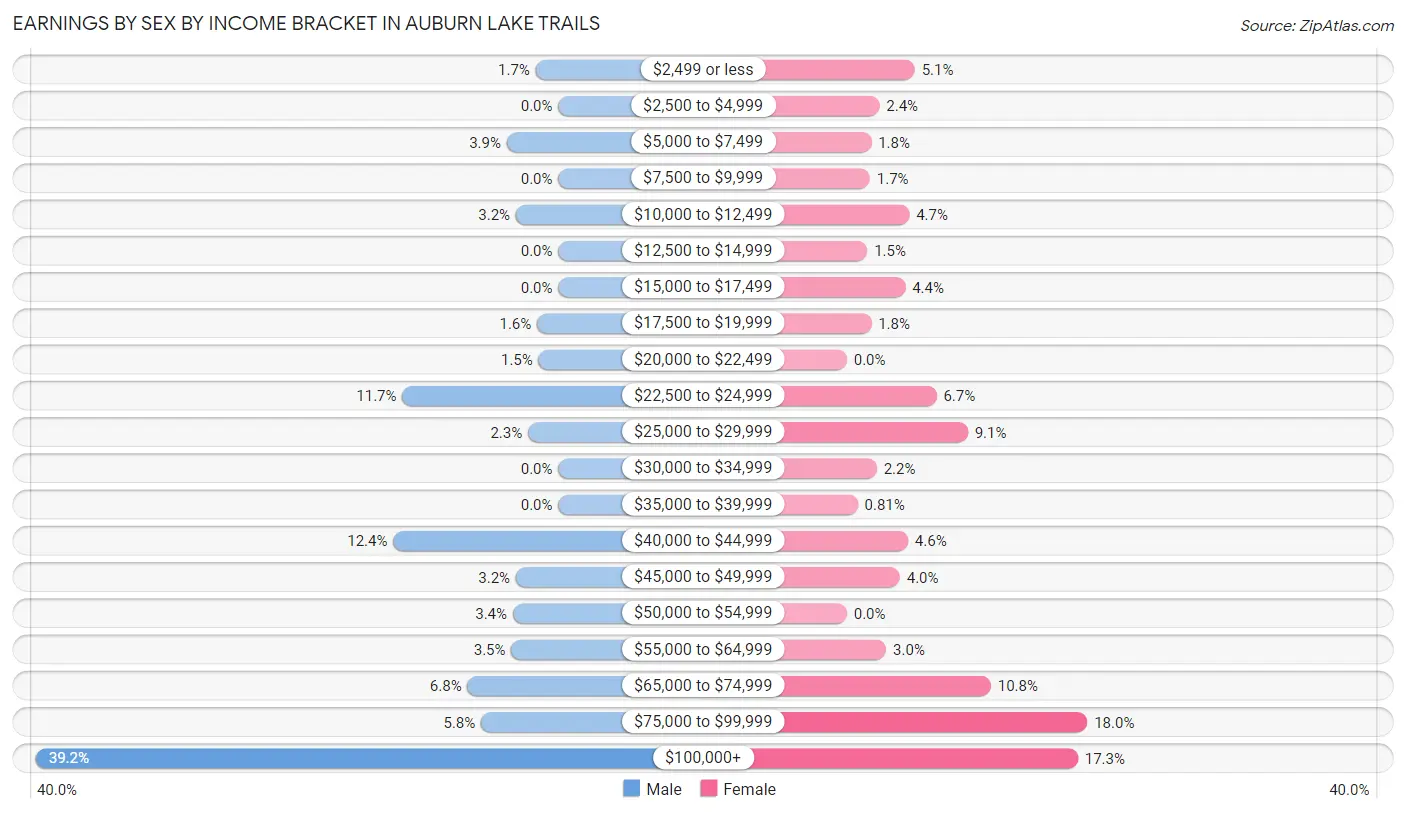
| Income | Male | Female |
| $2,499 or less | 15 (1.7%) | 50 (5.1%) |
| $2,500 to $4,999 | 0 (0.0%) | 24 (2.4%) |
| $5,000 to $7,499 | 34 (3.9%) | 18 (1.8%) |
| $7,500 to $9,999 | 0 (0.0%) | 17 (1.7%) |
| $10,000 to $12,499 | 28 (3.2%) | 46 (4.7%) |
| $12,500 to $14,999 | 0 (0.0%) | 15 (1.5%) |
| $15,000 to $17,499 | 0 (0.0%) | 43 (4.4%) |
| $17,500 to $19,999 | 14 (1.6%) | 18 (1.8%) |
| $20,000 to $22,499 | 13 (1.5%) | 0 (0.0%) |
| $22,500 to $24,999 | 103 (11.7%) | 66 (6.7%) |
| $25,000 to $29,999 | 20 (2.3%) | 89 (9.1%) |
| $30,000 to $34,999 | 0 (0.0%) | 22 (2.2%) |
| $35,000 to $39,999 | 0 (0.0%) | 8 (0.8%) |
| $40,000 to $44,999 | 109 (12.4%) | 45 (4.6%) |
| $45,000 to $49,999 | 28 (3.2%) | 39 (4.0%) |
| $50,000 to $54,999 | 30 (3.4%) | 0 (0.0%) |
| $55,000 to $64,999 | 31 (3.5%) | 29 (2.9%) |
| $65,000 to $74,999 | 60 (6.8%) | 106 (10.8%) |
| $75,000 to $99,999 | 51 (5.8%) | 177 (18.0%) |
| $100,000+ | 345 (39.2%) | 170 (17.3%) |
| Total | 881 (100.0%) | 982 (100.0%) |
Earnings by Sex by Educational Attainment in Auburn Lake Trails
Average earnings in Auburn Lake Trails are $69,528 for men and $62,308 for women, a difference of 10.4%. Men with an educational attainment of graduate degree enjoy the highest average annual earnings of $184,010, while those with high school diploma education earn the least with $41,000. Women with an educational attainment of graduate degree earn the most with the average annual earnings of $83,324, while those with high school diploma education have the smallest earnings of $33,182.
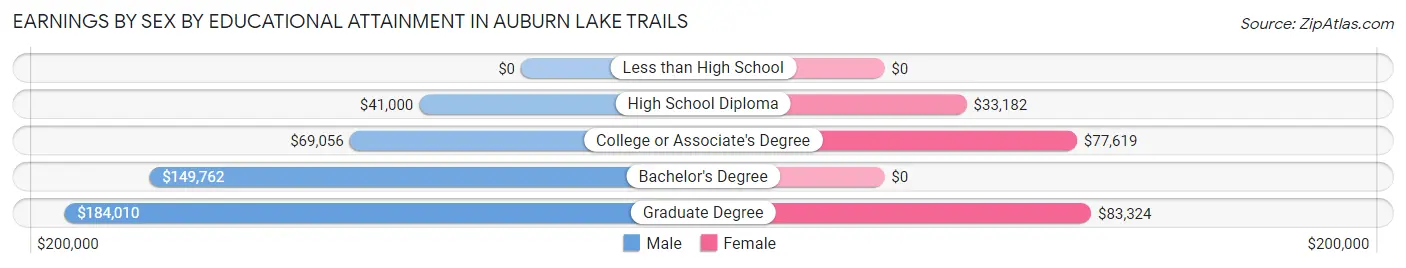
| Educational Attainment | Male Income | Female Income |
| Less than High School | - | - |
| High School Diploma | $41,000 | $33,182 |
| College or Associate's Degree | $69,056 | $77,619 |
| Bachelor's Degree | $149,762 | $0 |
| Graduate Degree | $184,010 | $83,324 |
| Total | $69,528 | $62,308 |
Family Income in Auburn Lake Trails
Family Income Brackets in Auburn Lake Trails
According to the Auburn Lake Trails family income data, there are 414 families falling into the $100,000 to $149,999 income range, which is the most common income bracket and makes up 37.1% of all families.
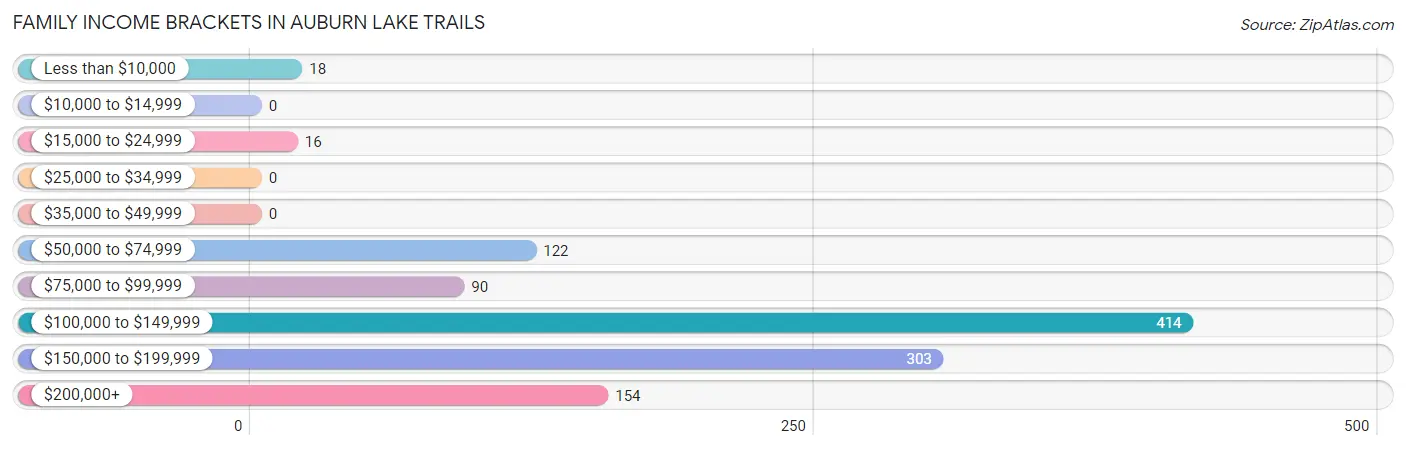
| Income Bracket | # Families | % Families |
| Less than $10,000 | 18 | 1.6% |
| $10,000 to $14,999 | 0 | 0.0% |
| $15,000 to $24,999 | 16 | 1.4% |
| $25,000 to $34,999 | 0 | 0.0% |
| $35,000 to $49,999 | 0 | 0.0% |
| $50,000 to $74,999 | 122 | 10.9% |
| $75,000 to $99,999 | 90 | 8.1% |
| $100,000 to $149,999 | 414 | 37.1% |
| $150,000 to $199,999 | 303 | 27.1% |
| $200,000+ | 154 | 13.8% |
Family Income by Famaliy Size in Auburn Lake Trails
3-person families (184 | 16.5%) account for the highest median family income in Auburn Lake Trails with $198,482 per family, while 3-person families (184 | 16.5%) have the highest median income of $66,161 per family member.
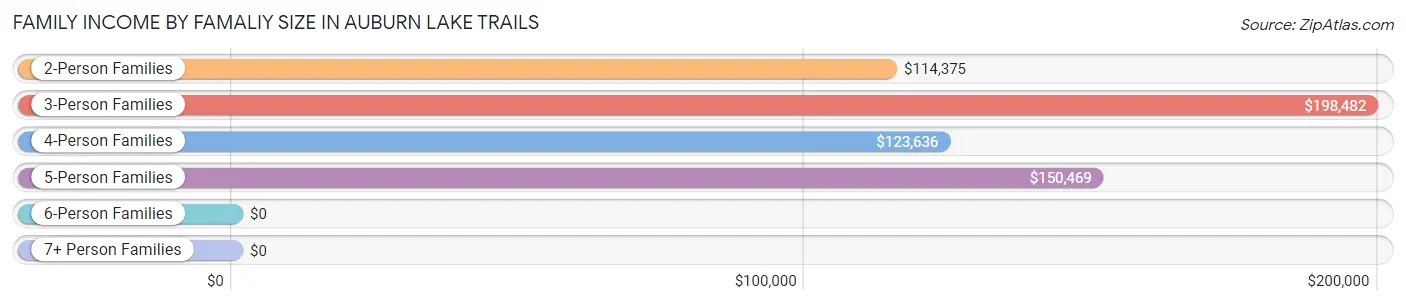
| Income Bracket | # Families | Median Income |
| 2-Person Families | 658 (58.9%) | $114,375 |
| 3-Person Families | 184 (16.5%) | $198,482 |
| 4-Person Families | 124 (11.1%) | $123,636 |
| 5-Person Families | 134 (12.0%) | $150,469 |
| 6-Person Families | 17 (1.5%) | $0 |
| 7+ Person Families | 0 (0.0%) | $0 |
| Total | 1,117 (100.0%) | $140,430 |
Family Income by Number of Earners in Auburn Lake Trails
The median family income in Auburn Lake Trails is $140,430, with families comprising 2 earners (470) having the highest median family income of $173,875, while families with no earners (233) have the lowest median family income of $99,241, accounting for 42.1% and 20.9% of families, respectively.
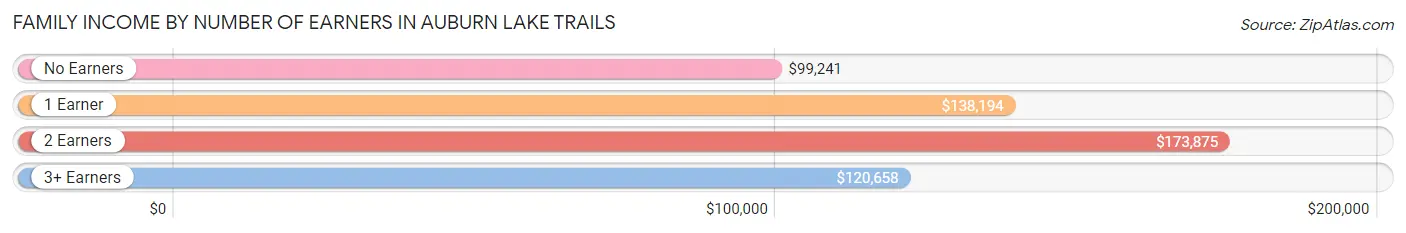
| Number of Earners | # Families | Median Income |
| No Earners | 233 (20.9%) | $99,241 |
| 1 Earner | 326 (29.2%) | $138,194 |
| 2 Earners | 470 (42.1%) | $173,875 |
| 3+ Earners | 88 (7.9%) | $120,658 |
| Total | 1,117 (100.0%) | $140,430 |
Household Income in Auburn Lake Trails
Household Income Brackets in Auburn Lake Trails
With 458 households falling in the category, the $100,000 to $149,999 income range is the most frequent in Auburn Lake Trails, accounting for 30.2% of all households. In contrast, only 27 households (1.8%) fall into the $10,000 to $14,999 income bracket, making it the least populous group.
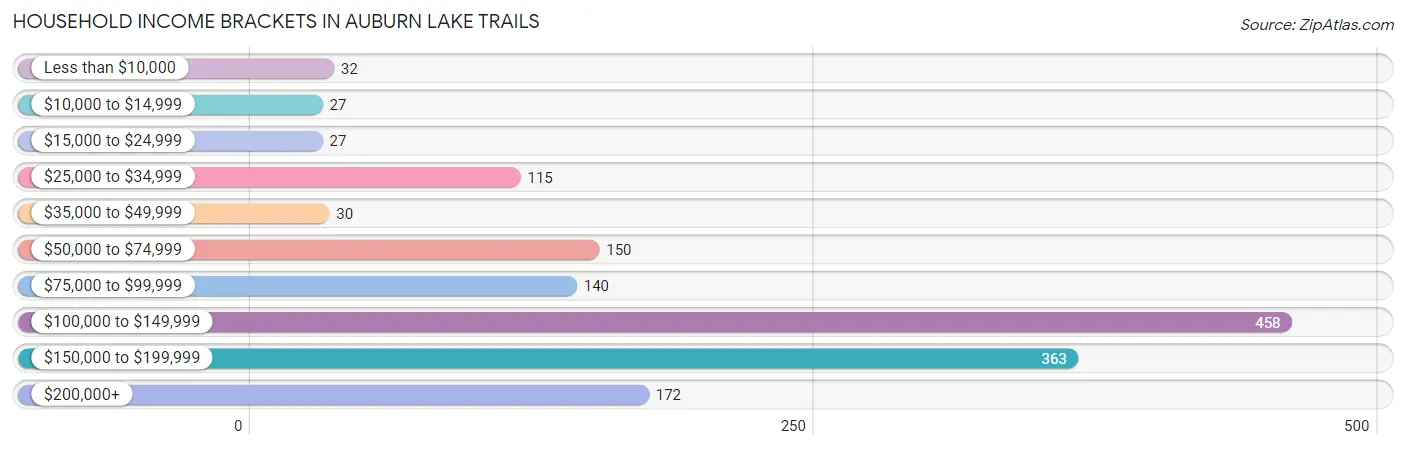
| Income Bracket | # Households | % Households |
| Less than $10,000 | 32 | 2.1% |
| $10,000 to $14,999 | 27 | 1.8% |
| $15,000 to $24,999 | 27 | 1.8% |
| $25,000 to $34,999 | 115 | 7.6% |
| $35,000 to $49,999 | 30 | 2.0% |
| $50,000 to $74,999 | 150 | 9.9% |
| $75,000 to $99,999 | 140 | 9.2% |
| $100,000 to $149,999 | 458 | 30.2% |
| $150,000 to $199,999 | 363 | 23.9% |
| $200,000+ | 172 | 11.3% |
Household Income by Householder Age in Auburn Lake Trails
The median household income in Auburn Lake Trails is $122,639, with the highest median household income of $186,750 found in the 25 to 44 years age bracket for the primary householder. A total of 181 households (11.9%) fall into this category.
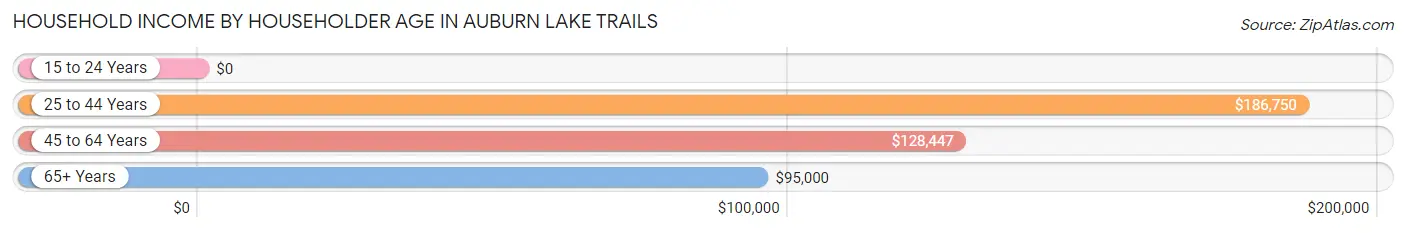
| Income Bracket | # Households | Median Income |
| 15 to 24 Years | 0 (0.0%) | $0 |
| 25 to 44 Years | 181 (11.9%) | $186,750 |
| 45 to 64 Years | 663 (43.7%) | $128,447 |
| 65+ Years | 674 (44.4%) | $95,000 |
| Total | 1,518 (100.0%) | $122,639 |
Poverty in Auburn Lake Trails
Income Below Poverty by Sex and Age in Auburn Lake Trails
With 5.8% poverty level for males and 9.5% for females among the residents of Auburn Lake Trails, 5 year old males and 16 and 17 year old females are the most vulnerable to poverty, with 23 males (100.0%) and 29 females (37.2%) in their respective age groups living below the poverty level.
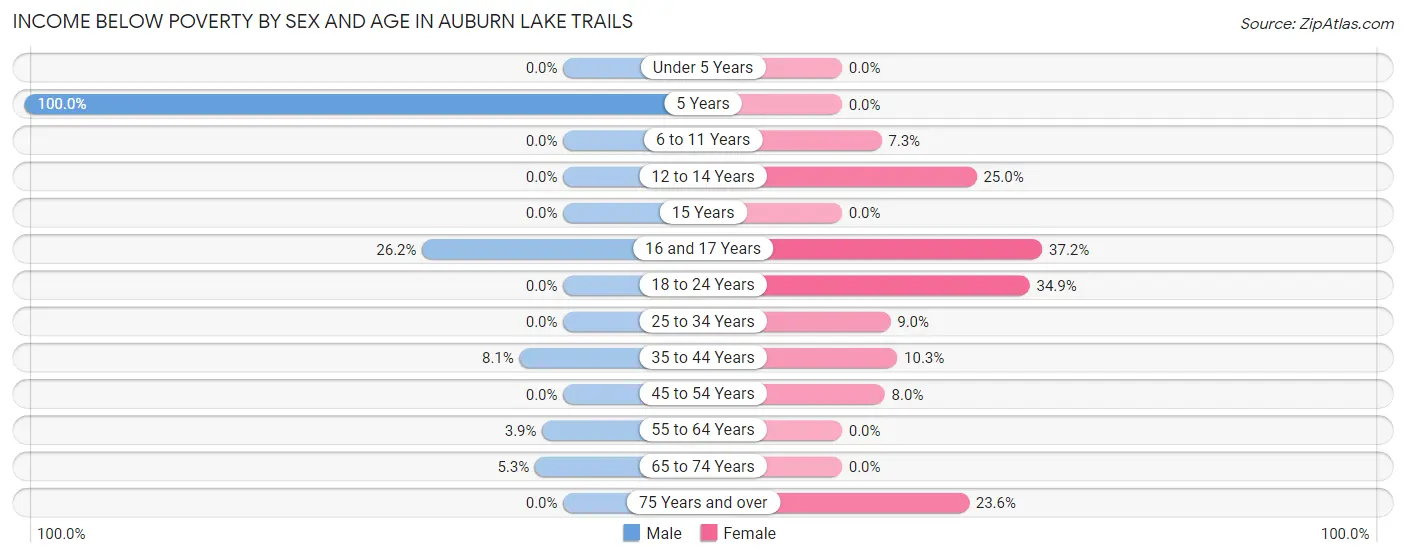
| Age Bracket | Male | Female |
| Under 5 Years | 0 (0.0%) | 0 (0.0%) |
| 5 Years | 23 (100.0%) | 0 (0.0%) |
| 6 to 11 Years | 0 (0.0%) | 13 (7.3%) |
| 12 to 14 Years | 0 (0.0%) | 11 (25.0%) |
| 15 Years | 0 (0.0%) | 0 (0.0%) |
| 16 and 17 Years | 28 (26.2%) | 29 (37.2%) |
| 18 to 24 Years | 0 (0.0%) | 23 (34.8%) |
| 25 to 34 Years | 0 (0.0%) | 18 (9.0%) |
| 35 to 44 Years | 16 (8.1%) | 19 (10.3%) |
| 45 to 54 Years | 0 (0.0%) | 18 (8.0%) |
| 55 to 64 Years | 19 (3.9%) | 0 (0.0%) |
| 65 to 74 Years | 16 (5.3%) | 0 (0.0%) |
| 75 Years and over | 0 (0.0%) | 66 (23.6%) |
| Total | 102 (5.8%) | 197 (9.5%) |
Income Above Poverty by Sex and Age in Auburn Lake Trails
According to the poverty statistics in Auburn Lake Trails, males aged under 5 years and females aged under 5 years are the age groups that are most secure financially, with 100.0% of males and 100.0% of females in these age groups living above the poverty line.
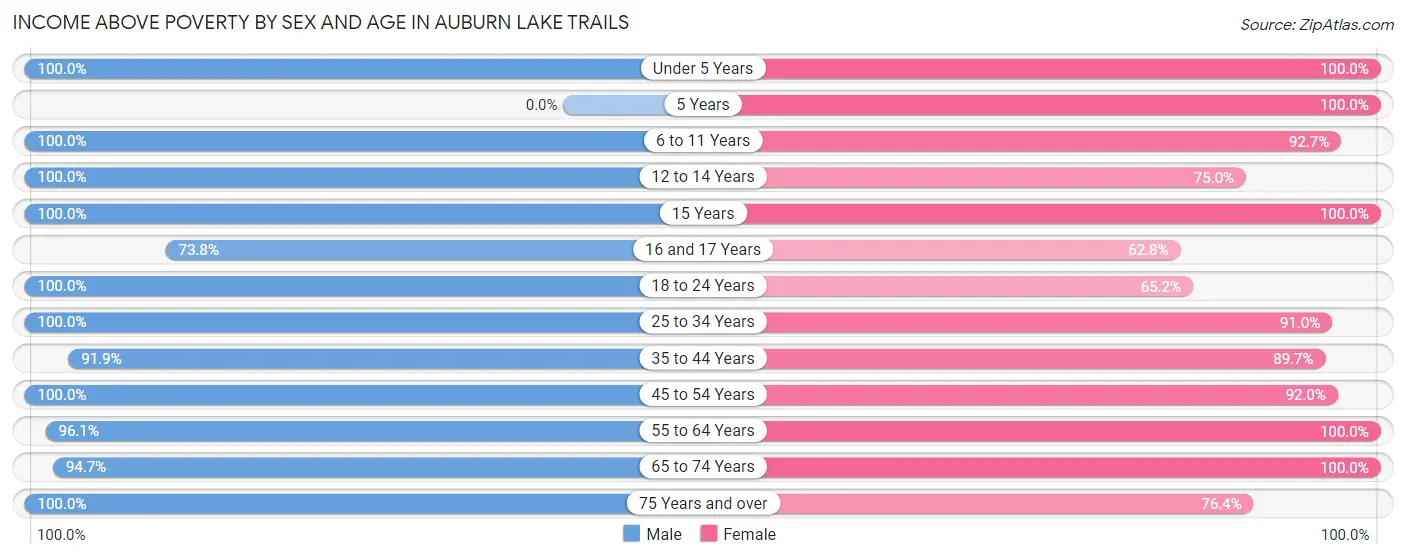
| Age Bracket | Male | Female |
| Under 5 Years | 42 (100.0%) | 52 (100.0%) |
| 5 Years | 0 (0.0%) | 63 (100.0%) |
| 6 to 11 Years | 104 (100.0%) | 164 (92.7%) |
| 12 to 14 Years | 18 (100.0%) | 33 (75.0%) |
| 15 Years | 5 (100.0%) | 16 (100.0%) |
| 16 and 17 Years | 79 (73.8%) | 49 (62.8%) |
| 18 to 24 Years | 36 (100.0%) | 43 (65.1%) |
| 25 to 34 Years | 102 (100.0%) | 182 (91.0%) |
| 35 to 44 Years | 181 (91.9%) | 166 (89.7%) |
| 45 to 54 Years | 164 (100.0%) | 208 (92.0%) |
| 55 to 64 Years | 470 (96.1%) | 448 (100.0%) |
| 65 to 74 Years | 288 (94.7%) | 248 (100.0%) |
| 75 Years and over | 160 (100.0%) | 214 (76.4%) |
| Total | 1,649 (94.2%) | 1,886 (90.5%) |
Income Below Poverty Among Married-Couple Families in Auburn Lake Trails
The poverty statistics for married-couple families in Auburn Lake Trails show that 3.4% or 34 of the total 1,003 families live below the poverty line. Families with 3 or 4 children have the highest poverty rate of 51.6%, comprising of 16 families. On the other hand, families with no children have the lowest poverty rate of 0.0%, which includes 0 families.
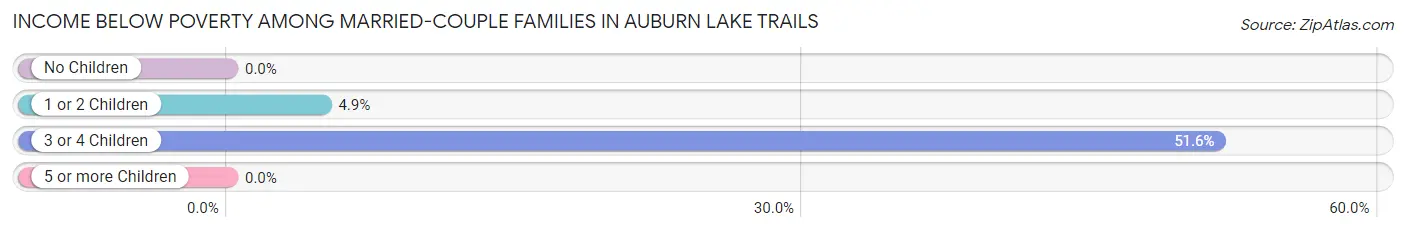
| Children | Above Poverty | Below Poverty |
| No Children | 603 (100.0%) | 0 (0.0%) |
| 1 or 2 Children | 351 (95.1%) | 18 (4.9%) |
| 3 or 4 Children | 15 (48.4%) | 16 (51.6%) |
| 5 or more Children | 0 (0.0%) | 0 (0.0%) |
| Total | 969 (96.6%) | 34 (3.4%) |
Income Below Poverty Among Single-Parent Households in Auburn Lake Trails
| Children | Single Father | Single Mother |
| No Children | 0 (0.0%) | 0 (0.0%) |
| 1 or 2 Children | 0 (0.0%) | 0 (0.0%) |
| 3 or 4 Children | 0 (0.0%) | 0 (0.0%) |
| 5 or more Children | 0 (0.0%) | 0 (0.0%) |
| Total | 0 (0.0%) | 0 (0.0%) |
Income Below Poverty Among Married-Couple vs Single-Parent Households in Auburn Lake Trails
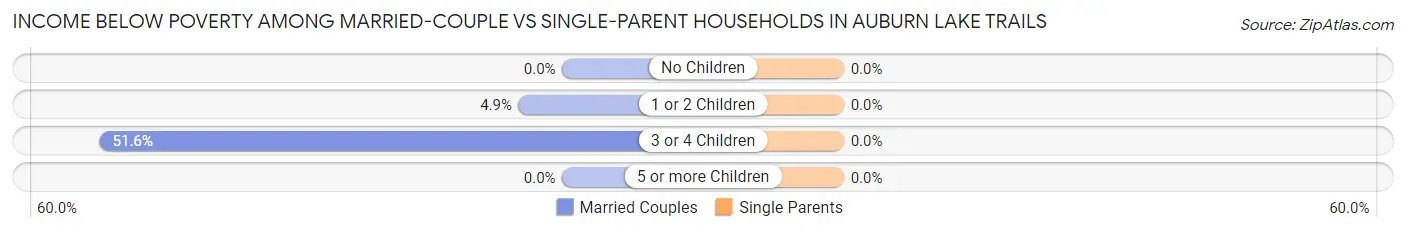
| Children | Married-Couple Families | Single-Parent Households |
| No Children | 0 (0.0%) | 0 (0.0%) |
| 1 or 2 Children | 18 (4.9%) | 0 (0.0%) |
| 3 or 4 Children | 16 (51.6%) | 0 (0.0%) |
| 5 or more Children | 0 (0.0%) | 0 (0.0%) |
| Total | 34 (3.4%) | 0 (0.0%) |
Race in Auburn Lake Trails
The most populous races in Auburn Lake Trails are White / Caucasian (3,503 | 91.1%), Hispanic or Latino (353 | 9.2%), and Two or more Races (279 | 7.2%).
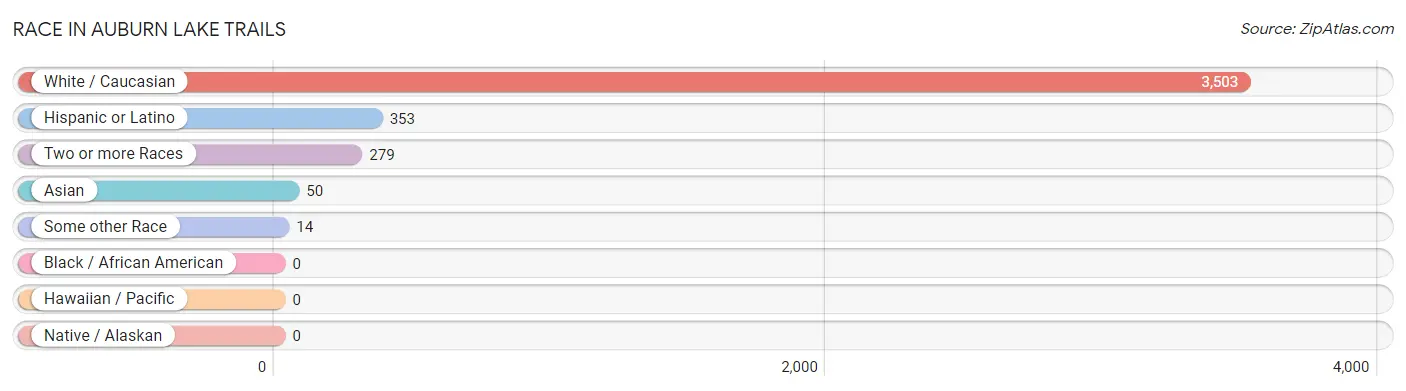
| Race | # Population | % Population |
| Asian | 50 | 1.3% |
| Black / African American | 0 | 0.0% |
| Hawaiian / Pacific | 0 | 0.0% |
| Hispanic or Latino | 353 | 9.2% |
| Native / Alaskan | 0 | 0.0% |
| White / Caucasian | 3,503 | 91.1% |
| Two or more Races | 279 | 7.2% |
| Some other Race | 14 | 0.4% |
| Total | 3,846 | 100.0% |
Ancestry in Auburn Lake Trails
The most populous ancestries reported in Auburn Lake Trails are German (800 | 20.8%), English (463 | 12.0%), Irish (376 | 9.8%), Italian (274 | 7.1%), and American (258 | 6.7%), together accounting for 56.5% of all Auburn Lake Trails residents.
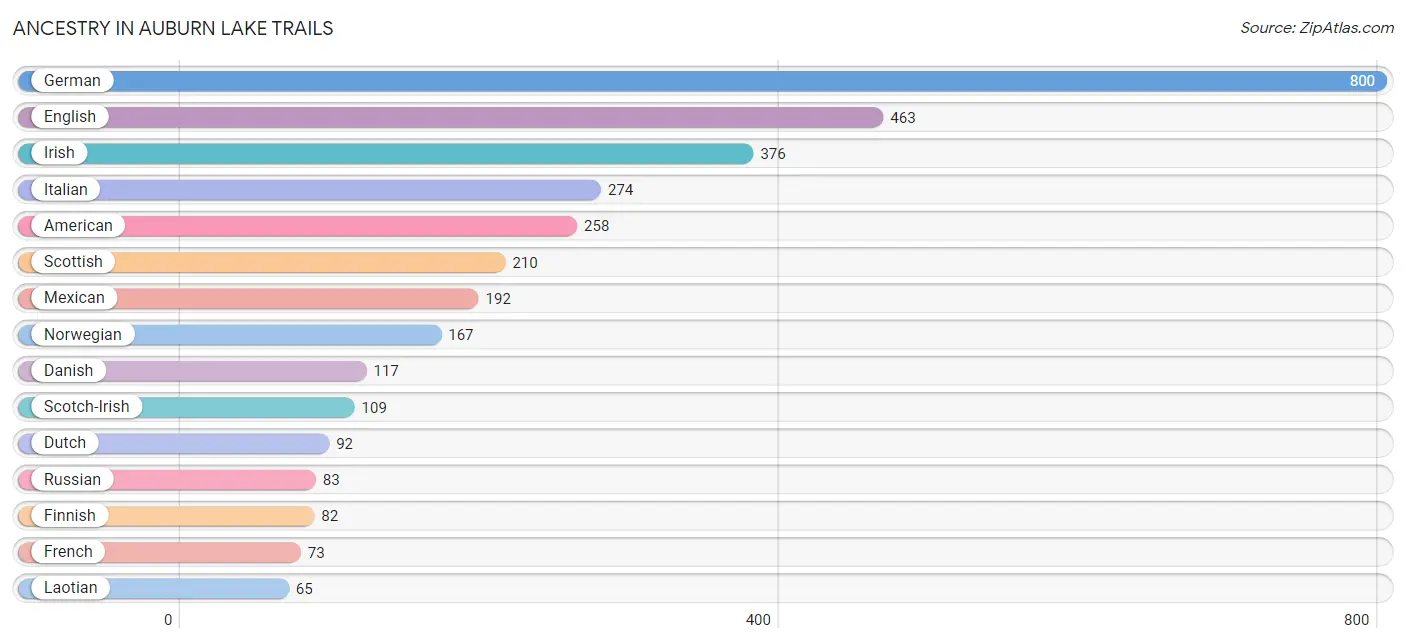
| Ancestry | # Population | % Population |
| American | 258 | 6.7% |
| Austrian | 12 | 0.3% |
| Basque | 59 | 1.5% |
| Bhutanese | 12 | 0.3% |
| Central American | 58 | 1.5% |
| Cherokee | 56 | 1.5% |
| Danish | 117 | 3.0% |
| Dutch | 92 | 2.4% |
| English | 463 | 12.0% |
| European | 36 | 0.9% |
| Finnish | 82 | 2.1% |
| French | 73 | 1.9% |
| German | 800 | 20.8% |
| Hungarian | 17 | 0.4% |
| Indian (Asian) | 17 | 0.4% |
| Irish | 376 | 9.8% |
| Italian | 274 | 7.1% |
| Laotian | 65 | 1.7% |
| Lithuanian | 16 | 0.4% |
| Mexican | 192 | 5.0% |
| Nicaraguan | 18 | 0.5% |
| Norwegian | 167 | 4.3% |
| Polish | 13 | 0.3% |
| Portuguese | 59 | 1.5% |
| Puerto Rican | 19 | 0.5% |
| Russian | 83 | 2.2% |
| Salvadoran | 40 | 1.0% |
| Scandinavian | 37 | 1.0% |
| Scotch-Irish | 109 | 2.8% |
| Scottish | 210 | 5.5% |
| South African | 16 | 0.4% |
| Spanish | 62 | 1.6% |
| Subsaharan African | 16 | 0.4% |
| Swedish | 17 | 0.4% |
| Thai | 38 | 1.0% |
| Ukrainian | 18 | 0.5% |
| Welsh | 38 | 1.0% |
| Yugoslavian | 16 | 0.4% | View All 38 Rows |
Immigrants in Auburn Lake Trails
The most numerous immigrant groups reported in Auburn Lake Trails came from Europe (107 | 2.8%), Western Europe (107 | 2.8%), Germany (64 | 1.7%), France (31 | 0.8%), and Central America (28 | 0.7%), together accounting for 8.8% of all Auburn Lake Trails residents.
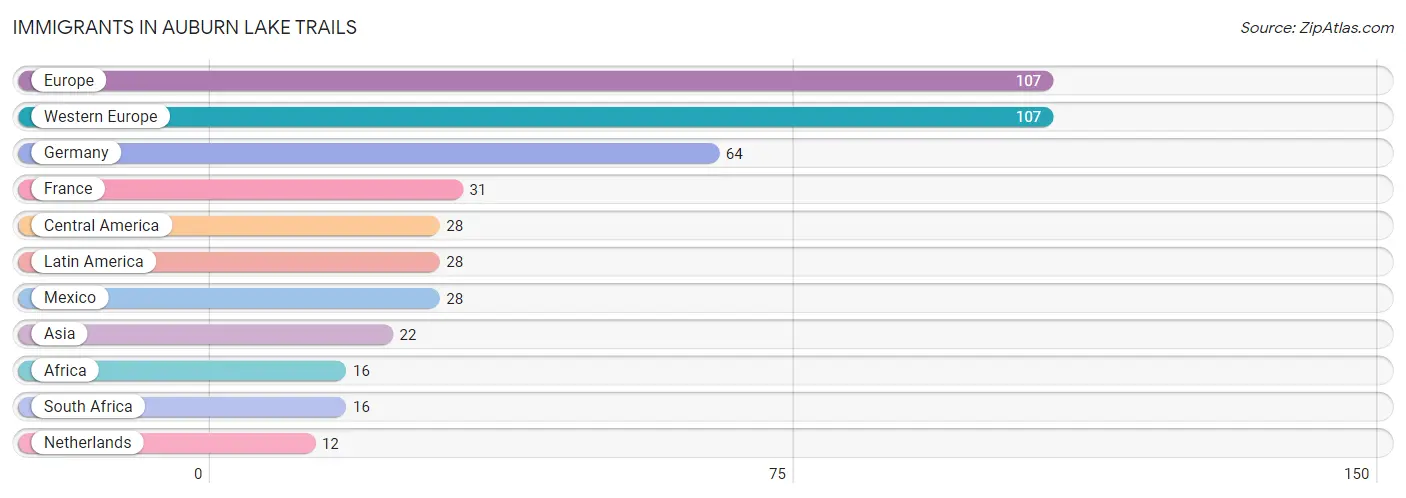
| Immigration Origin | # Population | % Population |
| Africa | 16 | 0.4% |
| Asia | 22 | 0.6% |
| Central America | 28 | 0.7% |
| Europe | 107 | 2.8% |
| France | 31 | 0.8% |
| Germany | 64 | 1.7% |
| Latin America | 28 | 0.7% |
| Mexico | 28 | 0.7% |
| Netherlands | 12 | 0.3% |
| South Africa | 16 | 0.4% |
| Western Europe | 107 | 2.8% | View All 11 Rows |
Sex and Age in Auburn Lake Trails
Sex and Age in Auburn Lake Trails
The most populous age groups in Auburn Lake Trails are 55 to 59 Years (299 | 17.0%) for men and 60 to 64 Years (314 | 15.1%) for women.
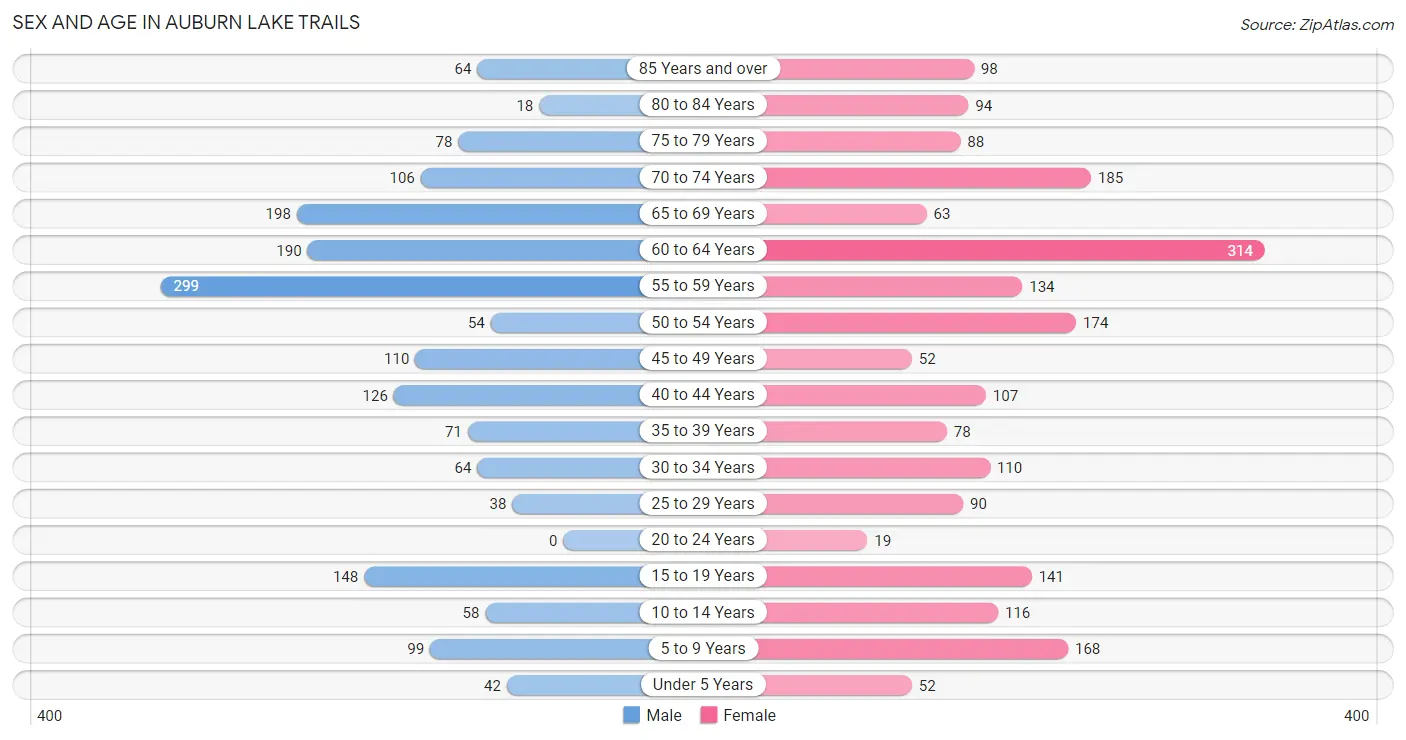
| Age Bracket | Male | Female |
| Under 5 Years | 42 (2.4%) | 52 (2.5%) |
| 5 to 9 Years | 99 (5.6%) | 168 (8.1%) |
| 10 to 14 Years | 58 (3.3%) | 116 (5.6%) |
| 15 to 19 Years | 148 (8.4%) | 141 (6.8%) |
| 20 to 24 Years | 0 (0.0%) | 19 (0.9%) |
| 25 to 29 Years | 38 (2.2%) | 90 (4.3%) |
| 30 to 34 Years | 64 (3.6%) | 110 (5.3%) |
| 35 to 39 Years | 71 (4.0%) | 78 (3.7%) |
| 40 to 44 Years | 126 (7.1%) | 107 (5.1%) |
| 45 to 49 Years | 110 (6.2%) | 52 (2.5%) |
| 50 to 54 Years | 54 (3.1%) | 174 (8.4%) |
| 55 to 59 Years | 299 (17.0%) | 134 (6.4%) |
| 60 to 64 Years | 190 (10.8%) | 314 (15.1%) |
| 65 to 69 Years | 198 (11.2%) | 63 (3.0%) |
| 70 to 74 Years | 106 (6.0%) | 185 (8.9%) |
| 75 to 79 Years | 78 (4.4%) | 88 (4.2%) |
| 80 to 84 Years | 18 (1.0%) | 94 (4.5%) |
| 85 Years and over | 64 (3.6%) | 98 (4.7%) |
| Total | 1,763 (100.0%) | 2,083 (100.0%) |
Families and Households in Auburn Lake Trails
Median Family Size in Auburn Lake Trails
The median family size in Auburn Lake Trails is 2.86 persons per family, with married-couple families (1,003 | 89.8%) accounting for the largest median family size of 2.94 persons per family. On the other hand, single female/mother families (84 | 7.5%) represent the smallest median family size with 1.98 persons per family.
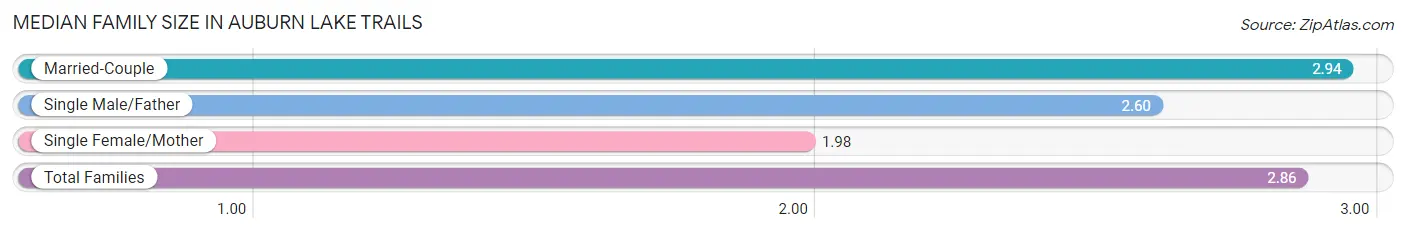
| Family Type | # Families | Family Size |
| Married-Couple | 1,003 (89.8%) | 2.94 |
| Single Male/Father | 30 (2.7%) | 2.60 |
| Single Female/Mother | 84 (7.5%) | 1.98 |
| Total Families | 1,117 (100.0%) | 2.86 |
Median Household Size in Auburn Lake Trails
The median household size in Auburn Lake Trails is 2.53 persons per household, with married-couple households (1,003 | 66.1%) accounting for the largest median household size of 2.96 persons per household. non-family households (401 | 26.4%) represent the smallest median household size with 1.45 persons per household.
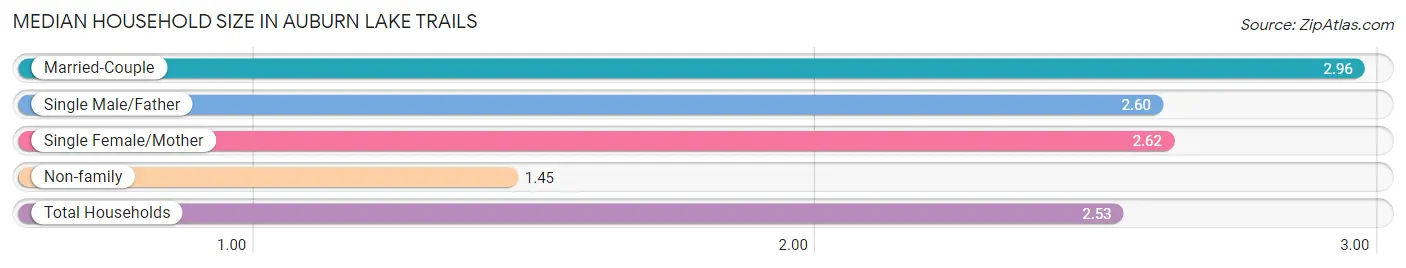
| Household Type | # Households | Household Size |
| Married-Couple | 1,003 (66.1%) | 2.96 |
| Single Male/Father | 30 (2.0%) | 2.60 |
| Single Female/Mother | 84 (5.5%) | 2.62 |
| Non-family | 401 (26.4%) | 1.45 |
| Total Households | 1,518 (100.0%) | 2.53 |
Household Size by Marriage Status in Auburn Lake Trails
Out of a total of 1,518 households in Auburn Lake Trails, 1,117 (73.6%) are family households, while 401 (26.4%) are nonfamily households. The most numerous type of family households are 2-person households, comprising 612, and the most common type of nonfamily households are 1-person households, comprising 264.
| Household Size | Family Households | Nonfamily Households |
| 1-Person Households | - | 264 (17.4%) |
| 2-Person Households | 612 (40.3%) | 119 (7.8%) |
| 3-Person Households | 218 (14.4%) | 18 (1.2%) |
| 4-Person Households | 121 (8.0%) | 0 (0.0%) |
| 5-Person Households | 149 (9.8%) | 0 (0.0%) |
| 6-Person Households | 17 (1.1%) | 0 (0.0%) |
| 7+ Person Households | 0 (0.0%) | 0 (0.0%) |
| Total | 1,117 (73.6%) | 401 (26.4%) |
Female Fertility in Auburn Lake Trails
Fertility by Age in Auburn Lake Trails
Average fertility rate in Auburn Lake Trails is 21.0 births per 1,000 women. Women in the age bracket of 20 to 34 years have the highest fertility rate with 64.0 births per 1,000 women. Women in the age bracket of 20 to 34 years acount for 100.0% of all women with births.
| Age Bracket | Women with Births | Births / 1,000 Women |
| 15 to 19 years | 0 (0.0%) | 0.0 |
| 20 to 34 years | 14 (100.0%) | 64.0 |
| 35 to 50 years | 0 (0.0%) | 0.0 |
| Total | 14 (100.0%) | 21.0 |
Fertility by Age by Marriage Status in Auburn Lake Trails
| Age Bracket | Married | Unmarried |
| 15 to 19 years | 0 (0.0%) | 0 (0.0%) |
| 20 to 34 years | 14 (100.0%) | 0 (0.0%) |
| 35 to 50 years | 0 (0.0%) | 0 (0.0%) |
| Total | 14 (100.0%) | 0 (0.0%) |
Fertility by Education in Auburn Lake Trails
| Educational Attainment | Women with Births | Births / 1,000 Women |
| Less than High School | 0 (0.0%) | 0.0 |
| High School Diploma | 0 (0.0%) | 0.0 |
| College or Associate's Degree | 0 (0.0%) | 0.0 |
| Bachelor's Degree | 0 (0.0%) | 0.0 |
| Graduate Degree | 14 (100.0%) | 203.0 |
| Total | 14 (100.0%) | 21.0 |
Fertility by Education by Marriage Status in Auburn Lake Trails
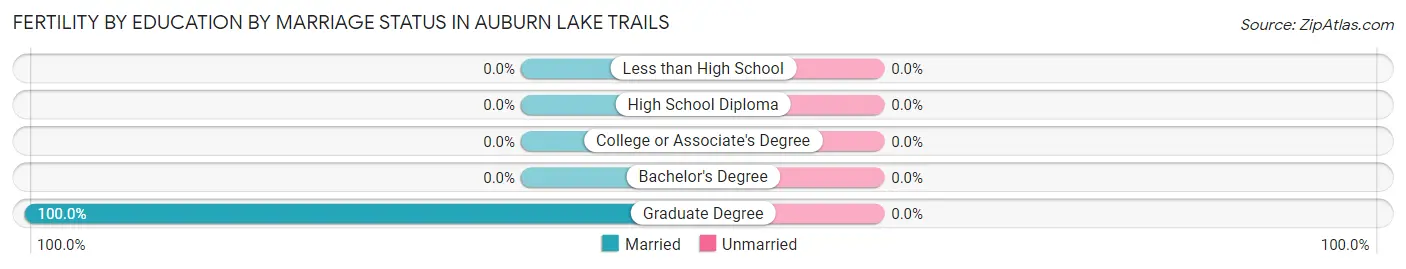
| Educational Attainment | Married | Unmarried |
| Less than High School | 0 (0.0%) | 0 (0.0%) |
| High School Diploma | 0 (0.0%) | 0 (0.0%) |
| College or Associate's Degree | 0 (0.0%) | 0 (0.0%) |
| Bachelor's Degree | 0 (0.0%) | 0 (0.0%) |
| Graduate Degree | 14 (100.0%) | 0 (0.0%) |
| Total | 14 (100.0%) | 0 (0.0%) |
Employment Characteristics in Auburn Lake Trails
Employment by Class of Employer in Auburn Lake Trails
Among the 1,731 employed individuals in Auburn Lake Trails, private company employees (1,026 | 59.3%), not-for-profit organizations (174 | 10.1%), and local government employees (172 | 9.9%) make up the most common classes of employment.
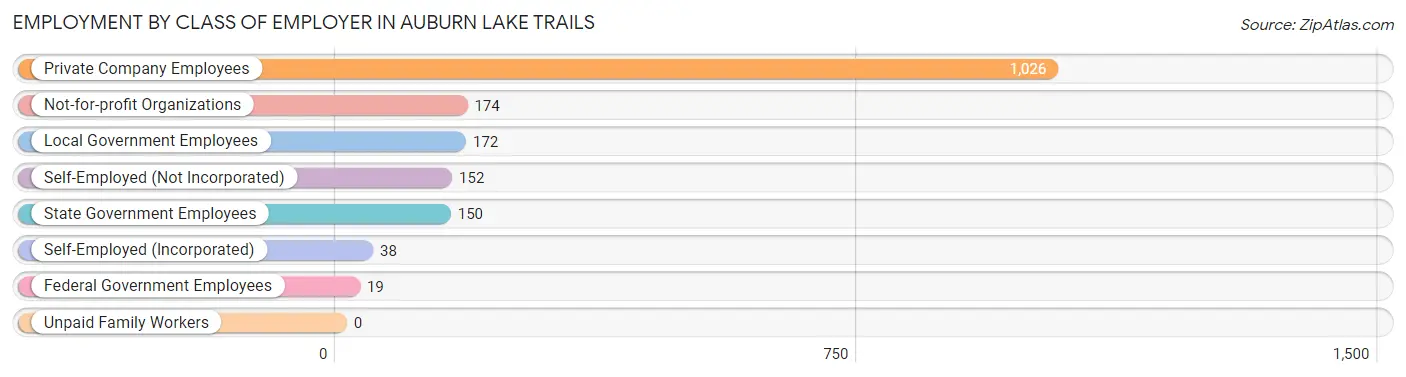
| Employer Class | # Employees | % Employees |
| Private Company Employees | 1,026 | 59.3% |
| Self-Employed (Incorporated) | 38 | 2.2% |
| Self-Employed (Not Incorporated) | 152 | 8.8% |
| Not-for-profit Organizations | 174 | 10.1% |
| Local Government Employees | 172 | 9.9% |
| State Government Employees | 150 | 8.7% |
| Federal Government Employees | 19 | 1.1% |
| Unpaid Family Workers | 0 | 0.0% |
| Total | 1,731 | 100.0% |
Employment Status by Age in Auburn Lake Trails
According to the labor force statistics for Auburn Lake Trails, out of the total population over 16 years of age (3,290), 55.6% or 1,829 individuals are in the labor force, with 4.0% or 73 of them unemployed. The age group with the highest labor force participation rate is 20 to 24 years, with 100.0% or 19 individuals in the labor force. Within the labor force, the 60 to 64 years age range has the highest percentage of unemployed individuals, with 13.6% or 55 of them being unemployed.
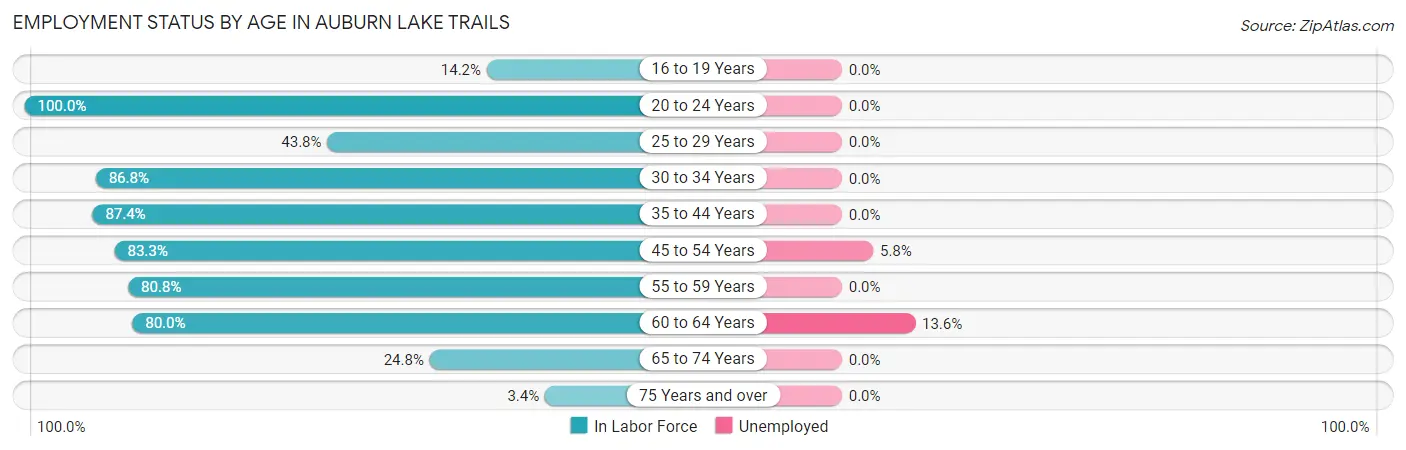
| Age Bracket | In Labor Force | Unemployed |
| 16 to 19 Years | 38 (14.2%) | 0 (0.0%) |
| 20 to 24 Years | 19 (100.0%) | 0 (0.0%) |
| 25 to 29 Years | 56 (43.8%) | 0 (0.0%) |
| 30 to 34 Years | 151 (86.8%) | 0 (0.0%) |
| 35 to 44 Years | 334 (87.4%) | 0 (0.0%) |
| 45 to 54 Years | 325 (83.3%) | 19 (5.8%) |
| 55 to 59 Years | 350 (80.8%) | 0 (0.0%) |
| 60 to 64 Years | 403 (80.0%) | 55 (13.6%) |
| 65 to 74 Years | 137 (24.8%) | 0 (0.0%) |
| 75 Years and over | 15 (3.4%) | 0 (0.0%) |
| Total | 1,829 (55.6%) | 73 (4.0%) |
Employment Status by Educational Attainment in Auburn Lake Trails
According to labor force statistics for Auburn Lake Trails, 80.5% of individuals (1,619) out of the total population between 25 and 64 years of age (2,011) are in the labor force, with 4.6% or 74 of them being unemployed. The group with the highest labor force participation rate are those with the educational attainment of bachelor's degree or higher, with 87.2% or 578 individuals in the labor force. Within the labor force, individuals with bachelor's degree or higher education have the highest percentage of unemployment, with 7.8% or 45 of them being unemployed.
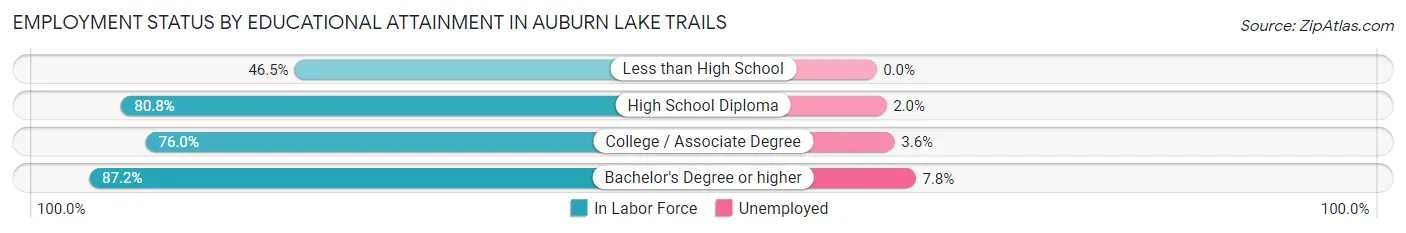
| Educational Attainment | In Labor Force | Unemployed |
| Less than High School | 20 (46.5%) | 0 (0.0%) |
| High School Diploma | 491 (80.8%) | 12 (2.0%) |
| College / Associate Degree | 530 (76.0%) | 25 (3.6%) |
| Bachelor's Degree or higher | 578 (87.2%) | 52 (7.8%) |
| Total | 1,619 (80.5%) | 93 (4.6%) |
Employment Occupations by Sex in Auburn Lake Trails
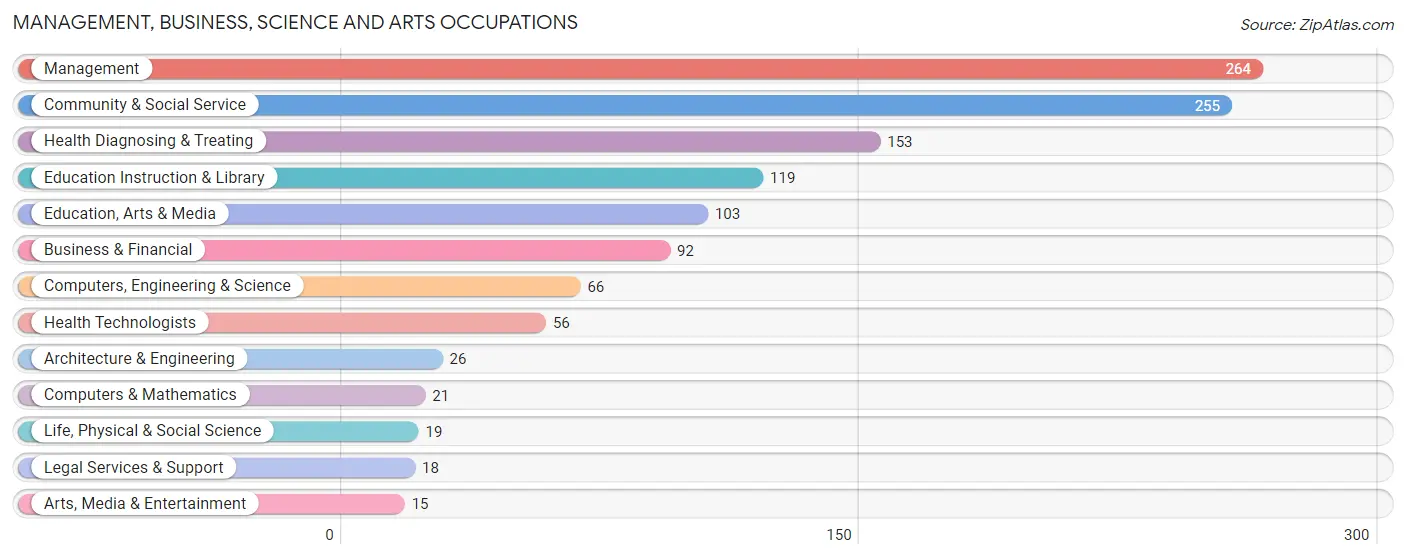
Management, Business, Science and Arts Occupations
The most common Management, Business, Science and Arts occupations in Auburn Lake Trails are Management (264 | 15.0%), Community & Social Service (255 | 14.5%), Health Diagnosing & Treating (153 | 8.7%), Education Instruction & Library (119 | 6.8%), and Education, Arts & Media (103 | 5.9%).
Management, Business, Science and Arts Occupations by Sex
Within the Management, Business, Science and Arts occupations in Auburn Lake Trails, the most male-oriented occupations are Computers, Engineering & Science (100.0%), Computers & Mathematics (100.0%), and Architecture & Engineering (100.0%), while the most female-oriented occupations are Education, Arts & Media (100.0%), Arts, Media & Entertainment (100.0%), and Health Diagnosing & Treating (84.3%).
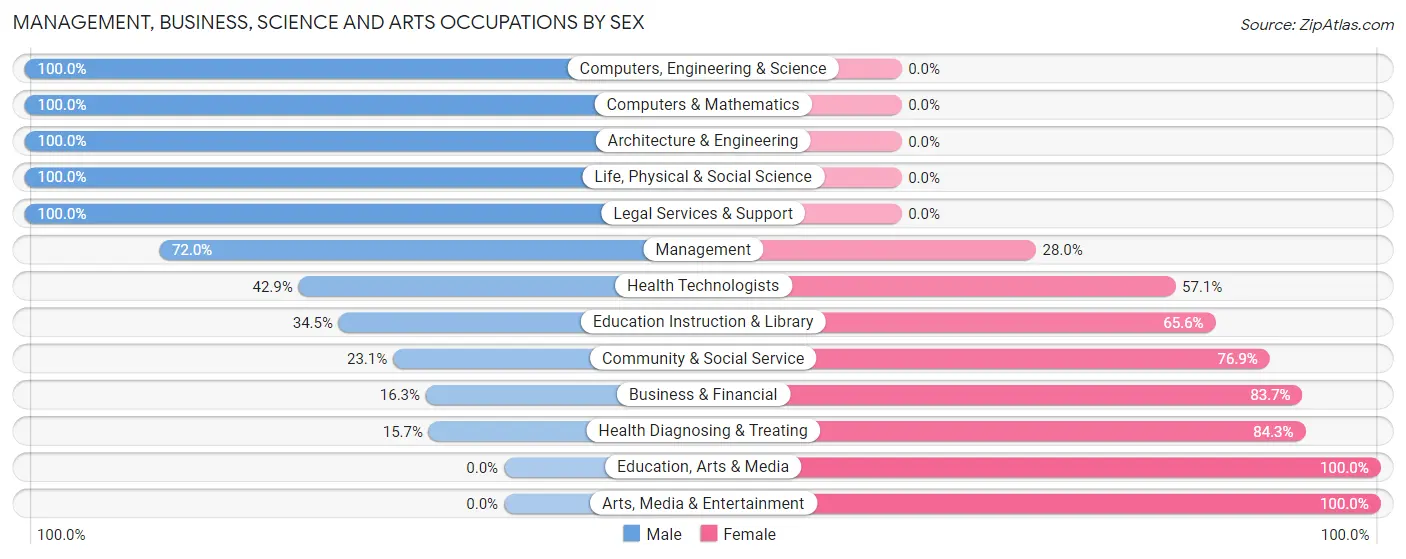
| Occupation | Male | Female |
| Management | 190 (72.0%) | 74 (28.0%) |
| Business & Financial | 15 (16.3%) | 77 (83.7%) |
| Computers, Engineering & Science | 66 (100.0%) | 0 (0.0%) |
| Computers & Mathematics | 21 (100.0%) | 0 (0.0%) |
| Architecture & Engineering | 26 (100.0%) | 0 (0.0%) |
| Life, Physical & Social Science | 19 (100.0%) | 0 (0.0%) |
| Community & Social Service | 59 (23.1%) | 196 (76.9%) |
| Education, Arts & Media | 0 (0.0%) | 103 (100.0%) |
| Legal Services & Support | 18 (100.0%) | 0 (0.0%) |
| Education Instruction & Library | 41 (34.4%) | 78 (65.5%) |
| Arts, Media & Entertainment | 0 (0.0%) | 15 (100.0%) |
| Health Diagnosing & Treating | 24 (15.7%) | 129 (84.3%) |
| Health Technologists | 24 (42.9%) | 32 (57.1%) |
| Total (Category) | 354 (42.6%) | 476 (57.4%) |
| Total (Overall) | 822 (46.9%) | 932 (53.1%) |
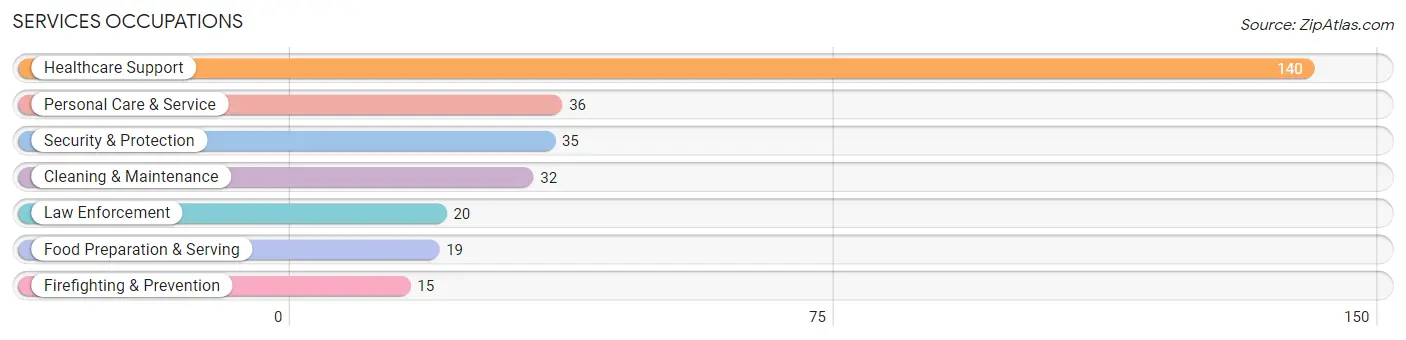
Services Occupations
The most common Services occupations in Auburn Lake Trails are Healthcare Support (140 | 8.0%), Personal Care & Service (36 | 2.1%), Security & Protection (35 | 2.0%), Cleaning & Maintenance (32 | 1.8%), and Law Enforcement (20 | 1.1%).
Services Occupations by Sex
Within the Services occupations in Auburn Lake Trails, the most male-oriented occupations are Law Enforcement (100.0%), Food Preparation & Serving (100.0%), and Cleaning & Maintenance (100.0%), while the most female-oriented occupations are Firefighting & Prevention (100.0%), Healthcare Support (80.0%), and Personal Care & Service (47.2%).
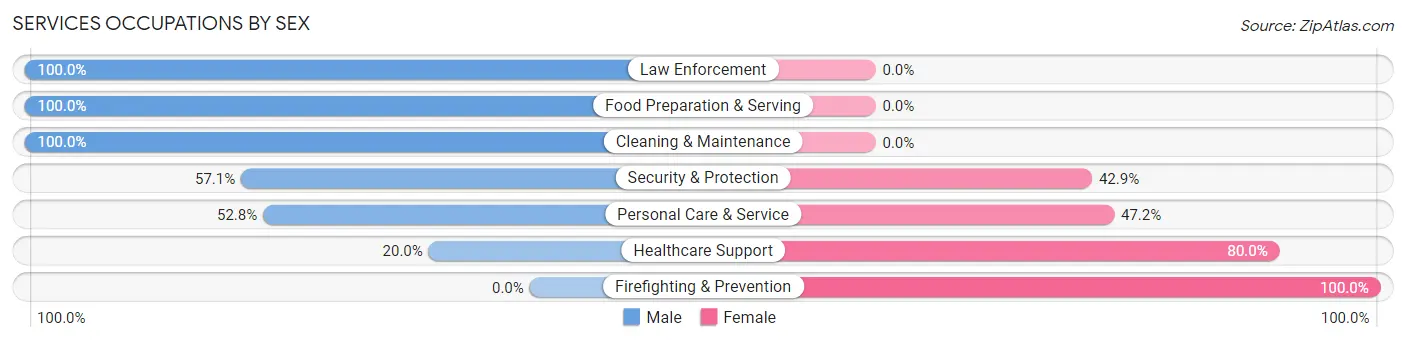
| Occupation | Male | Female |
| Healthcare Support | 28 (20.0%) | 112 (80.0%) |
| Security & Protection | 20 (57.1%) | 15 (42.9%) |
| Firefighting & Prevention | 0 (0.0%) | 15 (100.0%) |
| Law Enforcement | 20 (100.0%) | 0 (0.0%) |
| Food Preparation & Serving | 19 (100.0%) | 0 (0.0%) |
| Cleaning & Maintenance | 32 (100.0%) | 0 (0.0%) |
| Personal Care & Service | 19 (52.8%) | 17 (47.2%) |
| Total (Category) | 118 (45.0%) | 144 (55.0%) |
| Total (Overall) | 822 (46.9%) | 932 (53.1%) |
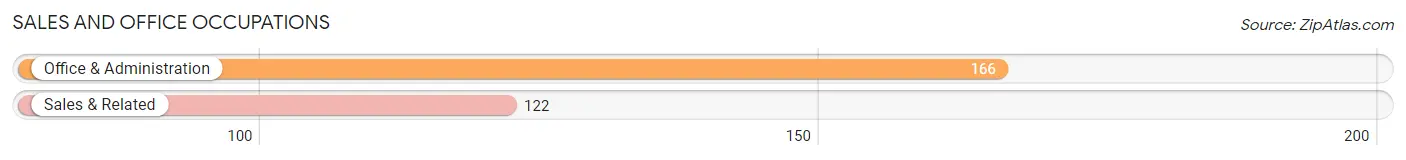
Sales and Office Occupations
The most common Sales and Office occupations in Auburn Lake Trails are Office & Administration (166 | 9.5%), and Sales & Related (122 | 7.0%).
Sales and Office Occupations by Sex
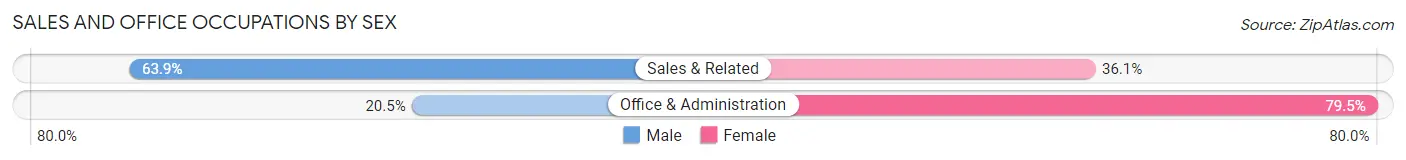
| Occupation | Male | Female |
| Sales & Related | 78 (63.9%) | 44 (36.1%) |
| Office & Administration | 34 (20.5%) | 132 (79.5%) |
| Total (Category) | 112 (38.9%) | 176 (61.1%) |
| Total (Overall) | 822 (46.9%) | 932 (53.1%) |
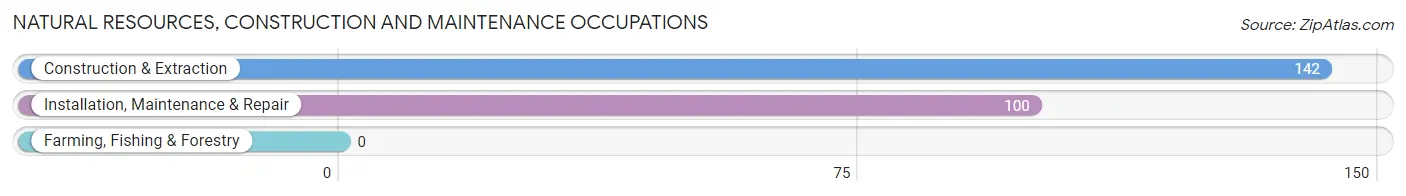
Natural Resources, Construction and Maintenance Occupations
The most common Natural Resources, Construction and Maintenance occupations in Auburn Lake Trails are Construction & Extraction (142 | 8.1%), and Installation, Maintenance & Repair (100 | 5.7%).
Natural Resources, Construction and Maintenance Occupations by Sex
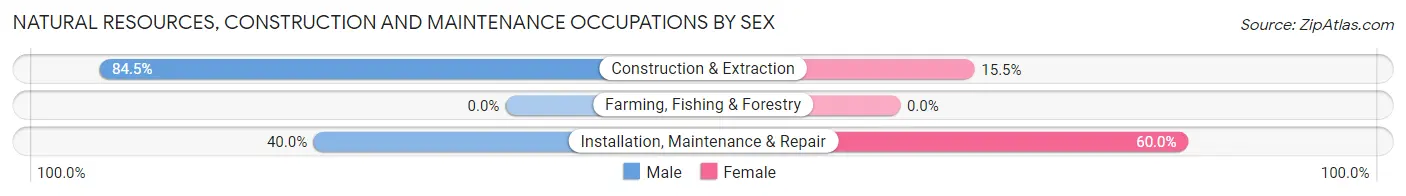
| Occupation | Male | Female |
| Farming, Fishing & Forestry | 0 (0.0%) | 0 (0.0%) |
| Construction & Extraction | 120 (84.5%) | 22 (15.5%) |
| Installation, Maintenance & Repair | 40 (40.0%) | 60 (60.0%) |
| Total (Category) | 160 (66.1%) | 82 (33.9%) |
| Total (Overall) | 822 (46.9%) | 932 (53.1%) |
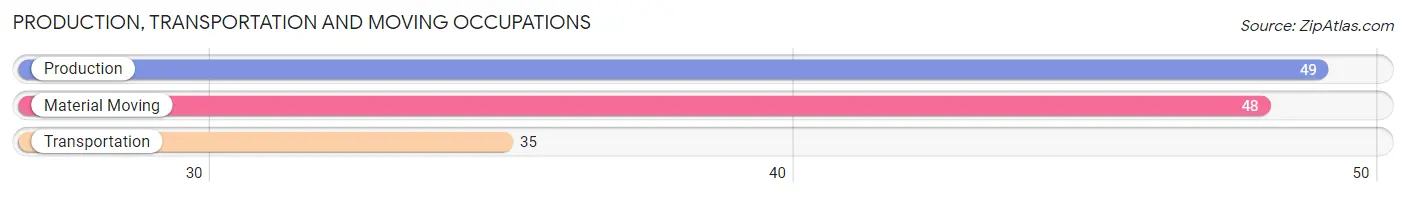
Production, Transportation and Moving Occupations
The most common Production, Transportation and Moving occupations in Auburn Lake Trails are Production (49 | 2.8%), Material Moving (48 | 2.7%), and Transportation (35 | 2.0%).
Production, Transportation and Moving Occupations by Sex
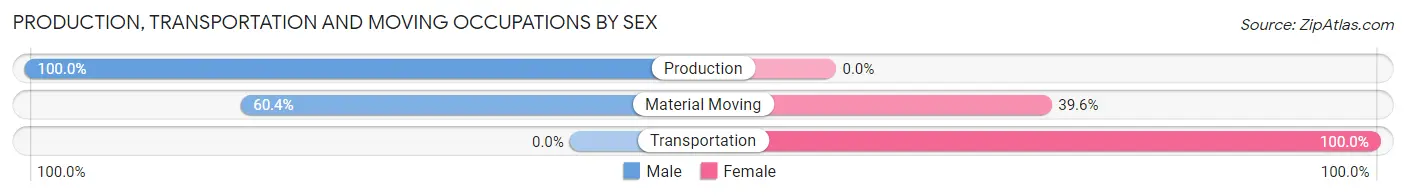
| Occupation | Male | Female |
| Production | 49 (100.0%) | 0 (0.0%) |
| Transportation | 0 (0.0%) | 35 (100.0%) |
| Material Moving | 29 (60.4%) | 19 (39.6%) |
| Total (Category) | 78 (59.1%) | 54 (40.9%) |
| Total (Overall) | 822 (46.9%) | 932 (53.1%) |
Employment Industries by Sex in Auburn Lake Trails
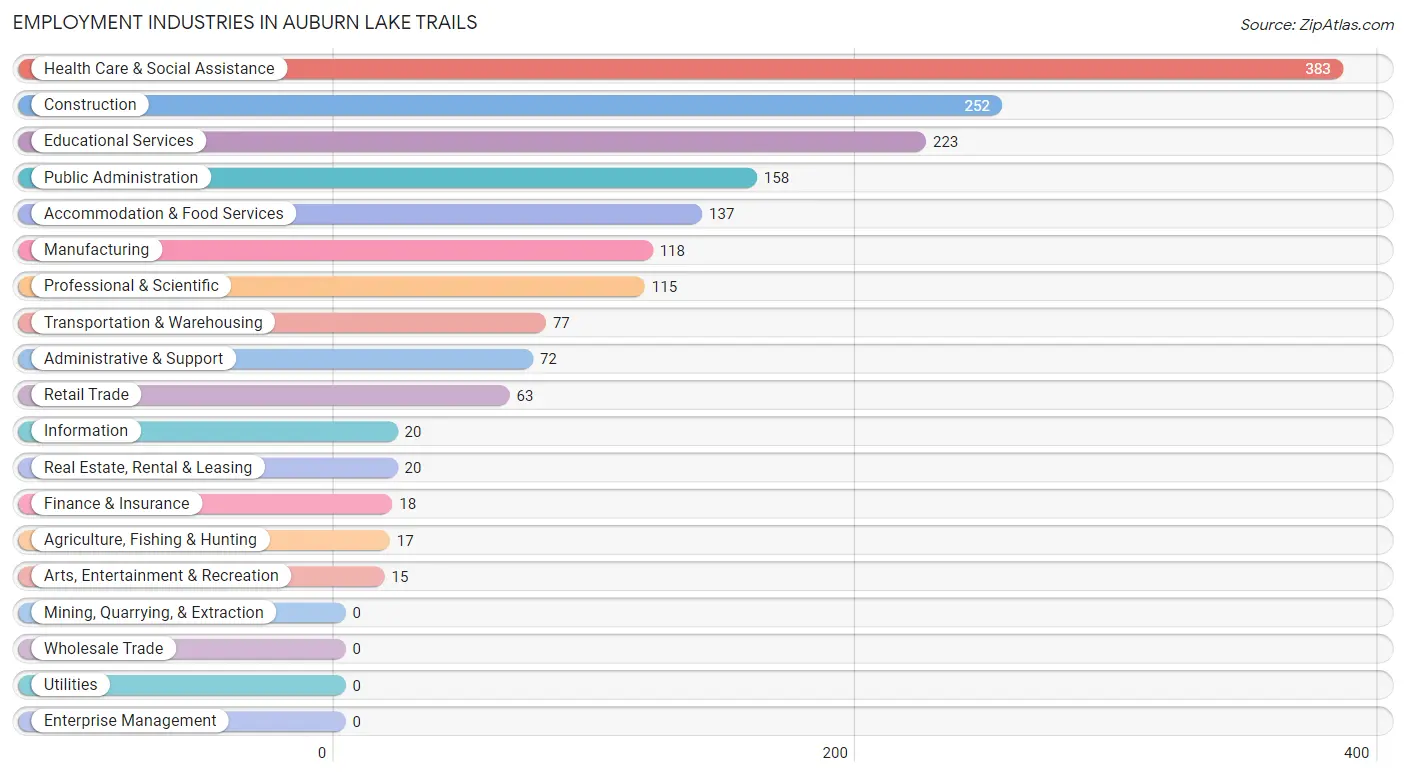
Employment Industries in Auburn Lake Trails
The major employment industries in Auburn Lake Trails include Health Care & Social Assistance (383 | 21.8%), Construction (252 | 14.4%), Educational Services (223 | 12.7%), Public Administration (158 | 9.0%), and Accommodation & Food Services (137 | 7.8%).
Employment Industries by Sex in Auburn Lake Trails
The Auburn Lake Trails industries that see more men than women are Information (100.0%), Arts, Entertainment & Recreation (100.0%), and Administrative & Support (88.9%), whereas the industries that tend to have a higher number of women are Agriculture, Fishing & Hunting (100.0%), Finance & Insurance (100.0%), and Real Estate, Rental & Leasing (100.0%).
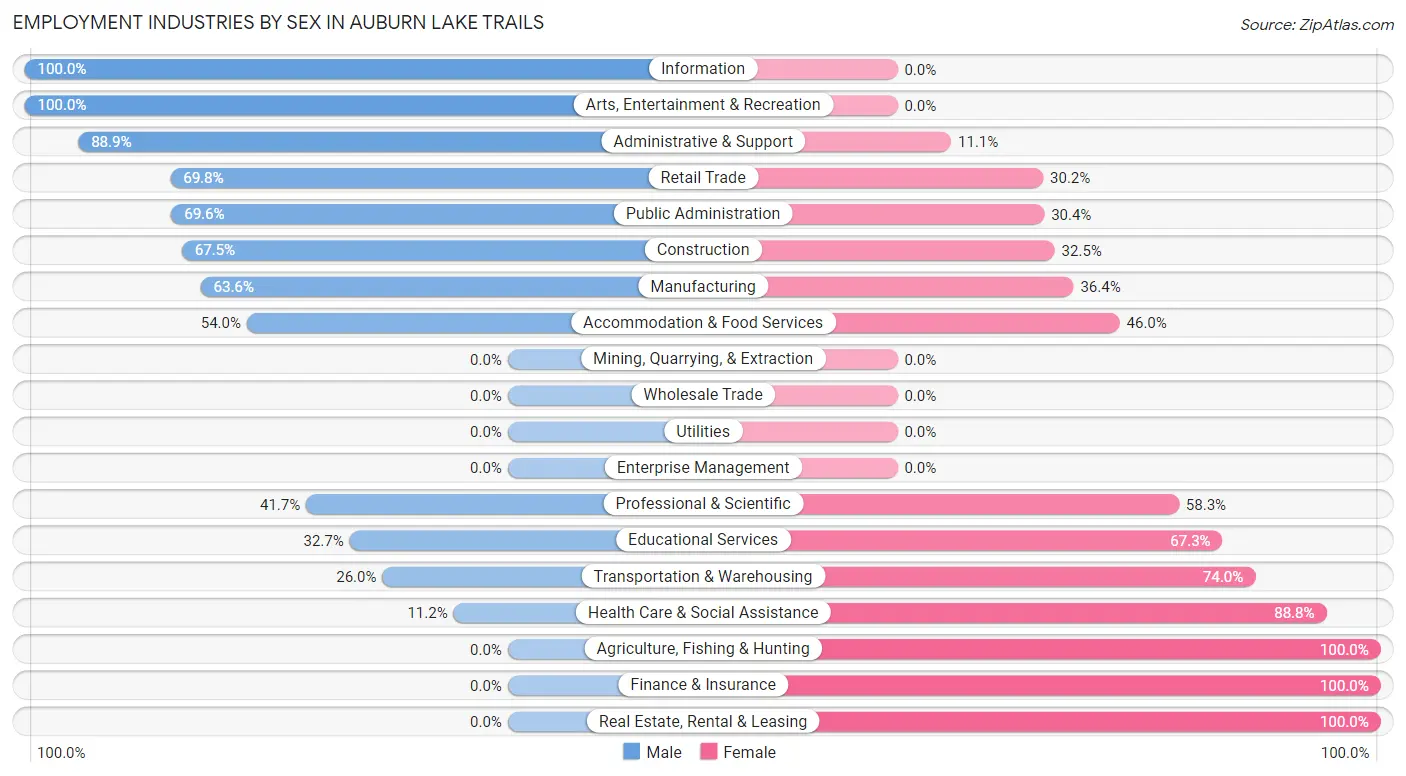
| Industry | Male | Female |
| Agriculture, Fishing & Hunting | 0 (0.0%) | 17 (100.0%) |
| Mining, Quarrying, & Extraction | 0 (0.0%) | 0 (0.0%) |
| Construction | 170 (67.5%) | 82 (32.5%) |
| Manufacturing | 75 (63.6%) | 43 (36.4%) |
| Wholesale Trade | 0 (0.0%) | 0 (0.0%) |
| Retail Trade | 44 (69.8%) | 19 (30.2%) |
| Transportation & Warehousing | 20 (26.0%) | 57 (74.0%) |
| Utilities | 0 (0.0%) | 0 (0.0%) |
| Information | 20 (100.0%) | 0 (0.0%) |
| Finance & Insurance | 0 (0.0%) | 18 (100.0%) |
| Real Estate, Rental & Leasing | 0 (0.0%) | 20 (100.0%) |
| Professional & Scientific | 48 (41.7%) | 67 (58.3%) |
| Enterprise Management | 0 (0.0%) | 0 (0.0%) |
| Administrative & Support | 64 (88.9%) | 8 (11.1%) |
| Educational Services | 73 (32.7%) | 150 (67.3%) |
| Health Care & Social Assistance | 43 (11.2%) | 340 (88.8%) |
| Arts, Entertainment & Recreation | 15 (100.0%) | 0 (0.0%) |
| Accommodation & Food Services | 74 (54.0%) | 63 (46.0%) |
| Public Administration | 110 (69.6%) | 48 (30.4%) |
| Total | 822 (46.9%) | 932 (53.1%) |
Education in Auburn Lake Trails
School Enrollment in Auburn Lake Trails
The most common levels of schooling among the 793 students in Auburn Lake Trails are high school (224 | 28.2%), elementary school (174 | 21.9%), and kindergarten (146 | 18.4%).
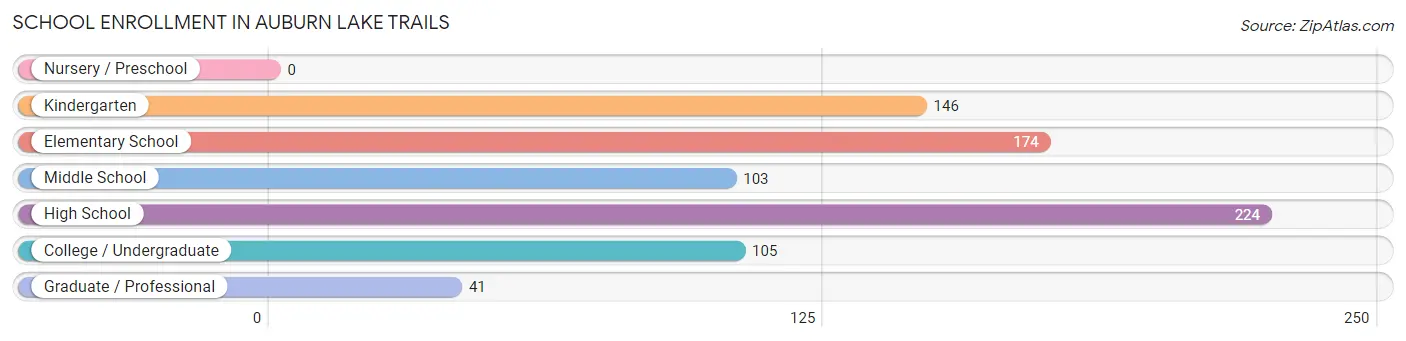
| School Level | # Students | % Students |
| Nursery / Preschool | 0 | 0.0% |
| Kindergarten | 146 | 18.4% |
| Elementary School | 174 | 21.9% |
| Middle School | 103 | 13.0% |
| High School | 224 | 28.2% |
| College / Undergraduate | 105 | 13.2% |
| Graduate / Professional | 41 | 5.2% |
| Total | 793 | 100.0% |
School Enrollment by Age by Funding Source in Auburn Lake Trails
Out of a total of 793 students who are enrolled in schools in Auburn Lake Trails, 132 (16.6%) attend a private institution, while the remaining 661 (83.4%) are enrolled in public schools. The age group of 15 to 17 year olds has the highest likelihood of being enrolled in private schools, with 59 (28.6% in the age bracket) enrolled. Conversely, the age group of 18 to 19 year olds has the lowest likelihood of being enrolled in a private school, with 24 (100.0% in the age bracket) attending a public institution.
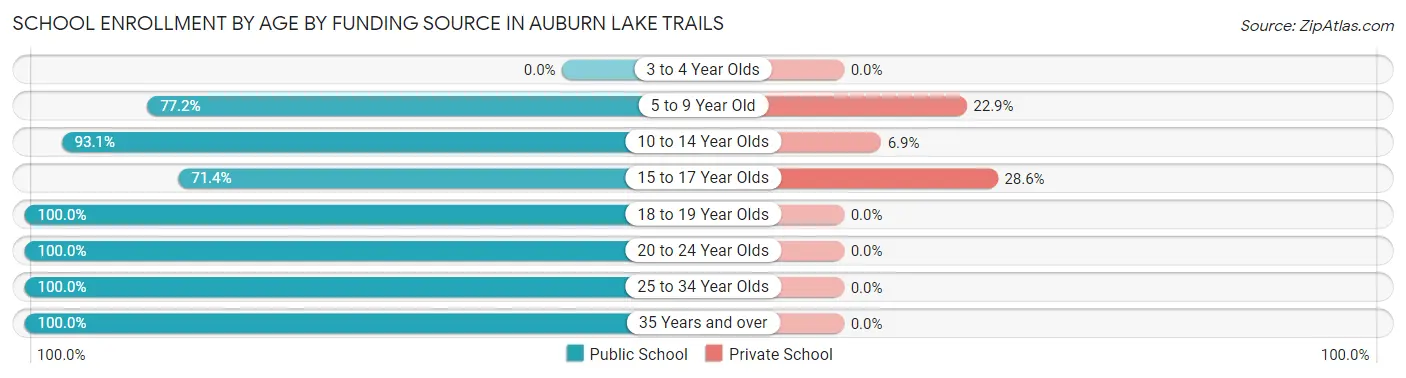
| Age Bracket | Public School | Private School |
| 3 to 4 Year Olds | 0 (0.0%) | 0 (0.0%) |
| 5 to 9 Year Old | 206 (77.1%) | 61 (22.9%) |
| 10 to 14 Year Olds | 162 (93.1%) | 12 (6.9%) |
| 15 to 17 Year Olds | 147 (71.4%) | 59 (28.6%) |
| 18 to 19 Year Olds | 24 (100.0%) | 0 (0.0%) |
| 20 to 24 Year Olds | 19 (100.0%) | 0 (0.0%) |
| 25 to 34 Year Olds | 45 (100.0%) | 0 (0.0%) |
| 35 Years and over | 58 (100.0%) | 0 (0.0%) |
| Total | 661 (83.4%) | 132 (16.6%) |
Educational Attainment by Field of Study in Auburn Lake Trails
Business (179 | 17.0%), science & technology (163 | 15.5%), arts & humanities (133 | 12.6%), engineering (126 | 12.0%), and literature & languages (96 | 9.1%) are the most common fields of study among 1,053 individuals in Auburn Lake Trails who have obtained a bachelor's degree or higher.
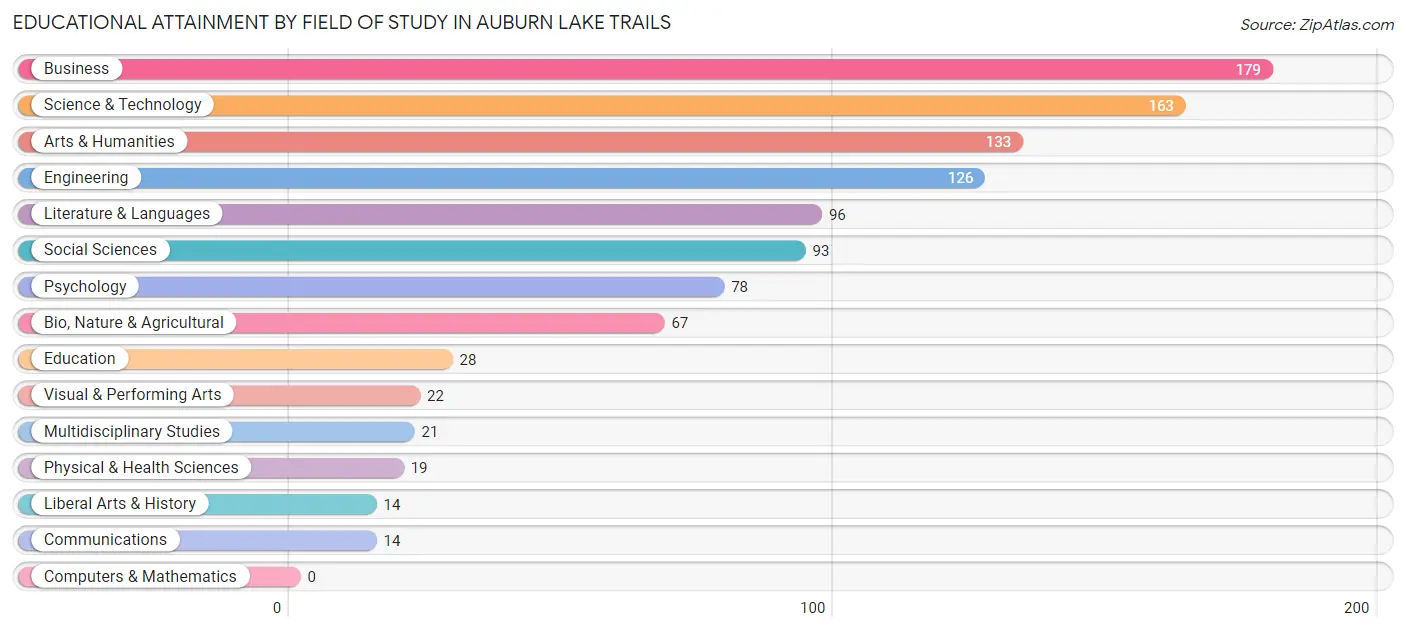
| Field of Study | # Graduates | % Graduates |
| Computers & Mathematics | 0 | 0.0% |
| Bio, Nature & Agricultural | 67 | 6.4% |
| Physical & Health Sciences | 19 | 1.8% |
| Psychology | 78 | 7.4% |
| Social Sciences | 93 | 8.8% |
| Engineering | 126 | 12.0% |
| Multidisciplinary Studies | 21 | 2.0% |
| Science & Technology | 163 | 15.5% |
| Business | 179 | 17.0% |
| Education | 28 | 2.7% |
| Literature & Languages | 96 | 9.1% |
| Liberal Arts & History | 14 | 1.3% |
| Visual & Performing Arts | 22 | 2.1% |
| Communications | 14 | 1.3% |
| Arts & Humanities | 133 | 12.6% |
| Total | 1,053 | 100.0% |
Transportation & Commute in Auburn Lake Trails
Vehicle Availability by Sex in Auburn Lake Trails
The most prevalent vehicle ownership categories in Auburn Lake Trails are males with 3 vehicles (292, accounting for 36.2%) and females with 3 vehicles (456, making up 31.6%).
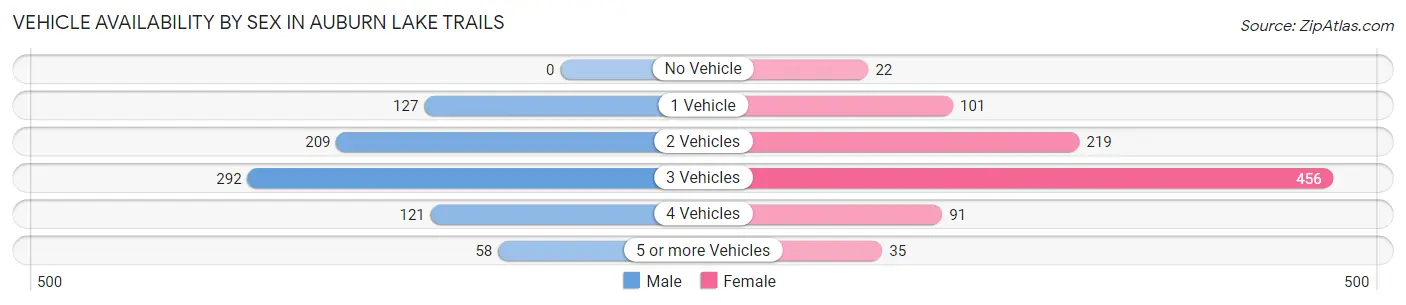
| Vehicles Available | Male | Female |
| No Vehicle | 0 (0.0%) | 22 (2.4%) |
| 1 Vehicle | 127 (15.7%) | 101 (10.9%) |
| 2 Vehicles | 209 (25.9%) | 219 (23.7%) |
| 3 Vehicles | 292 (36.2%) | 456 (49.3%) |
| 4 Vehicles | 121 (15.0%) | 91 (9.9%) |
| 5 or more Vehicles | 58 (7.2%) | 35 (3.8%) |
| Total | 807 (100.0%) | 924 (100.0%) |
Commute Time in Auburn Lake Trails
The most frequently occuring commute durations in Auburn Lake Trails are 30 to 34 minutes (280 commuters, 20.8%), 45 to 59 minutes (247 commuters, 18.3%), and 60 to 89 minutes (162 commuters, 12.0%).
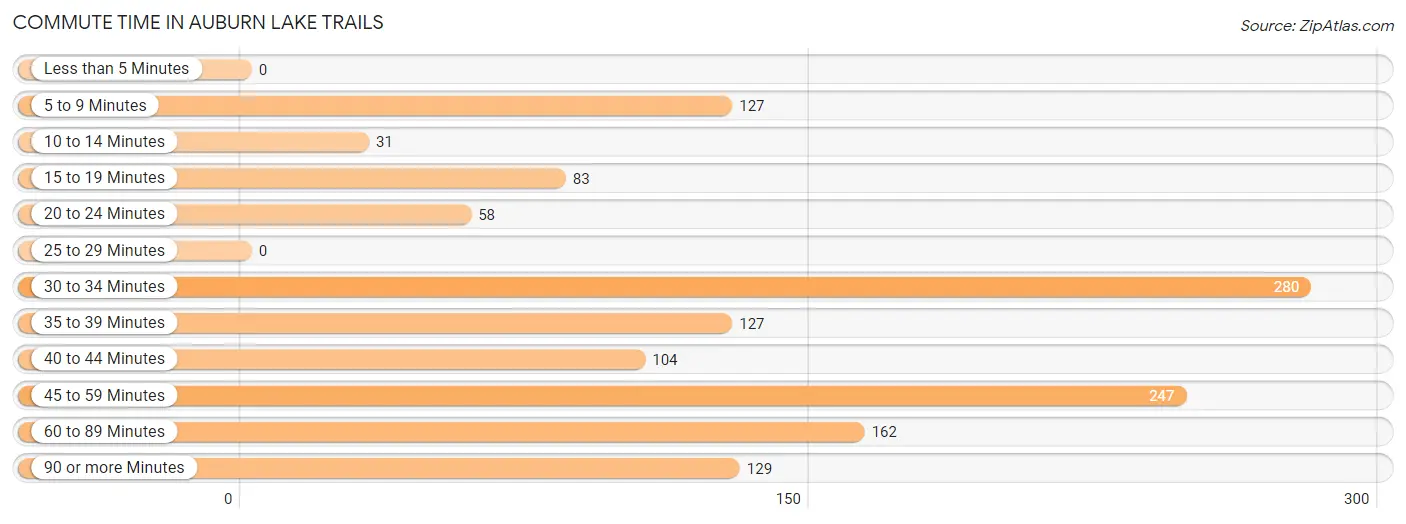
| Commute Time | # Commuters | % Commuters |
| Less than 5 Minutes | 0 | 0.0% |
| 5 to 9 Minutes | 127 | 9.4% |
| 10 to 14 Minutes | 31 | 2.3% |
| 15 to 19 Minutes | 83 | 6.2% |
| 20 to 24 Minutes | 58 | 4.3% |
| 25 to 29 Minutes | 0 | 0.0% |
| 30 to 34 Minutes | 280 | 20.8% |
| 35 to 39 Minutes | 127 | 9.4% |
| 40 to 44 Minutes | 104 | 7.7% |
| 45 to 59 Minutes | 247 | 18.3% |
| 60 to 89 Minutes | 162 | 12.0% |
| 90 or more Minutes | 129 | 9.6% |
Commute Time by Sex in Auburn Lake Trails
The most common commute times in Auburn Lake Trails are 60 to 89 minutes (150 commuters, 23.5%) for males and 45 to 59 minutes (166 commuters, 23.4%) for females.
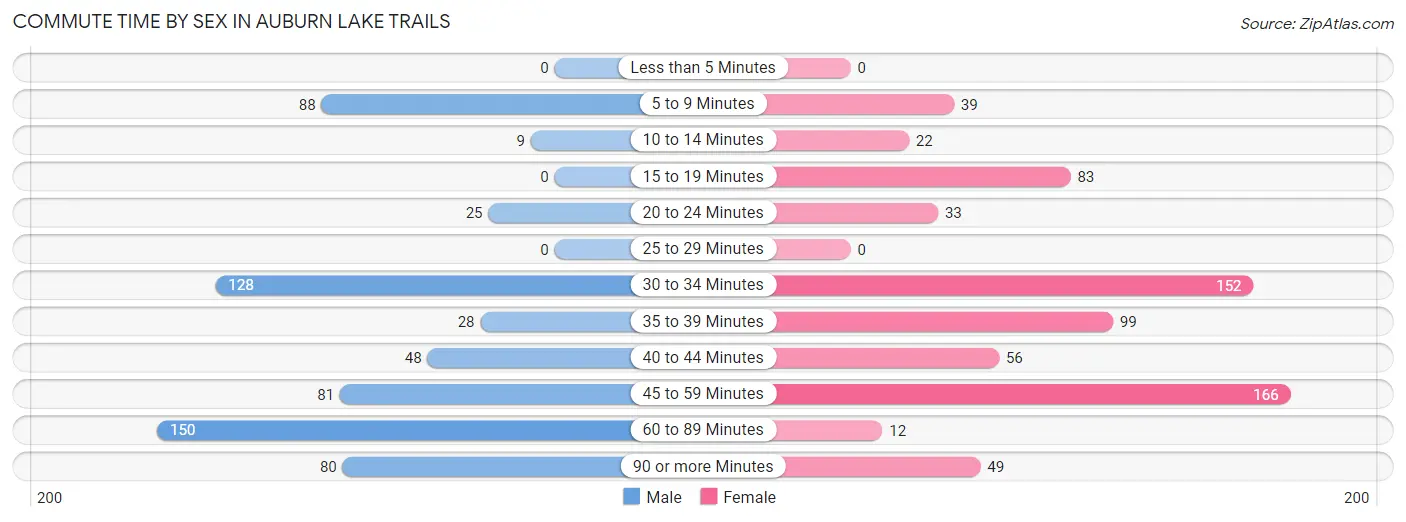
| Commute Time | Male | Female |
| Less than 5 Minutes | 0 (0.0%) | 0 (0.0%) |
| 5 to 9 Minutes | 88 (13.8%) | 39 (5.5%) |
| 10 to 14 Minutes | 9 (1.4%) | 22 (3.1%) |
| 15 to 19 Minutes | 0 (0.0%) | 83 (11.7%) |
| 20 to 24 Minutes | 25 (3.9%) | 33 (4.6%) |
| 25 to 29 Minutes | 0 (0.0%) | 0 (0.0%) |
| 30 to 34 Minutes | 128 (20.1%) | 152 (21.4%) |
| 35 to 39 Minutes | 28 (4.4%) | 99 (13.9%) |
| 40 to 44 Minutes | 48 (7.5%) | 56 (7.9%) |
| 45 to 59 Minutes | 81 (12.7%) | 166 (23.4%) |
| 60 to 89 Minutes | 150 (23.5%) | 12 (1.7%) |
| 90 or more Minutes | 80 (12.6%) | 49 (6.9%) |
Time of Departure to Work by Sex in Auburn Lake Trails
The most frequent times of departure to work in Auburn Lake Trails are 9:00 AM to 9:59 AM (111, 17.4%) for males and 7:00 AM to 7:29 AM (131, 18.4%) for females.
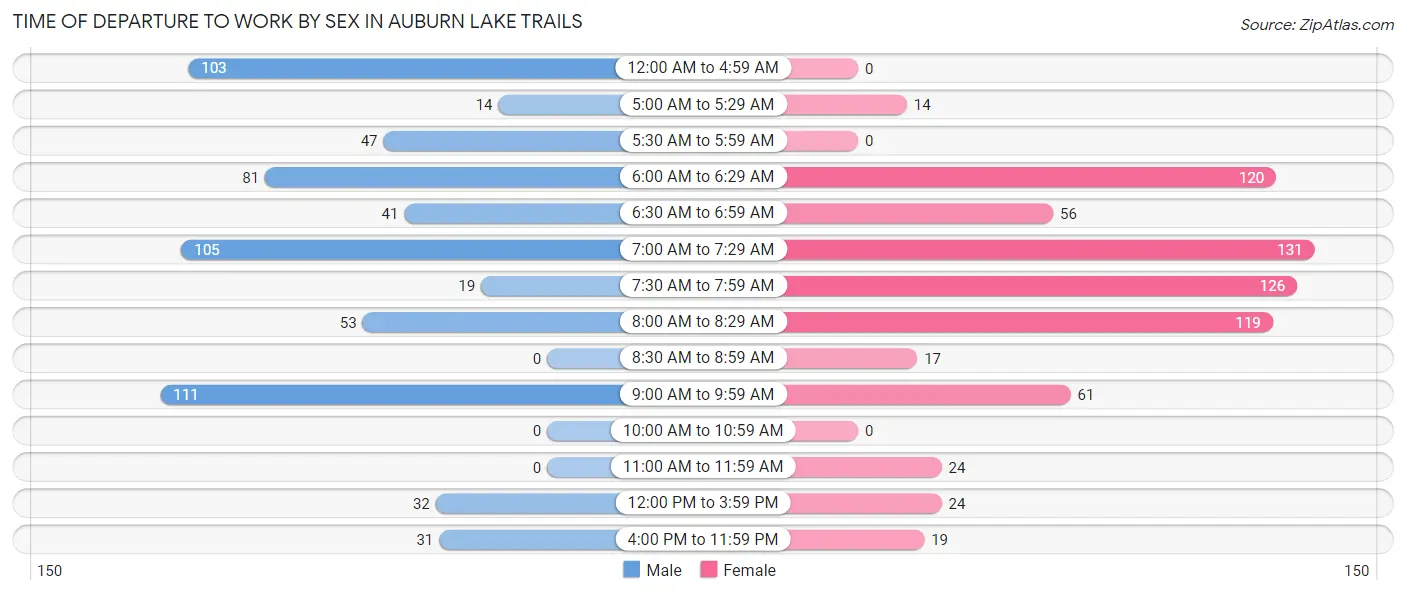
| Time of Departure | Male | Female |
| 12:00 AM to 4:59 AM | 103 (16.2%) | 0 (0.0%) |
| 5:00 AM to 5:29 AM | 14 (2.2%) | 14 (2.0%) |
| 5:30 AM to 5:59 AM | 47 (7.4%) | 0 (0.0%) |
| 6:00 AM to 6:29 AM | 81 (12.7%) | 120 (16.9%) |
| 6:30 AM to 6:59 AM | 41 (6.4%) | 56 (7.9%) |
| 7:00 AM to 7:29 AM | 105 (16.5%) | 131 (18.4%) |
| 7:30 AM to 7:59 AM | 19 (3.0%) | 126 (17.7%) |
| 8:00 AM to 8:29 AM | 53 (8.3%) | 119 (16.7%) |
| 8:30 AM to 8:59 AM | 0 (0.0%) | 17 (2.4%) |
| 9:00 AM to 9:59 AM | 111 (17.4%) | 61 (8.6%) |
| 10:00 AM to 10:59 AM | 0 (0.0%) | 0 (0.0%) |
| 11:00 AM to 11:59 AM | 0 (0.0%) | 24 (3.4%) |
| 12:00 PM to 3:59 PM | 32 (5.0%) | 24 (3.4%) |
| 4:00 PM to 11:59 PM | 31 (4.9%) | 19 (2.7%) |
| Total | 637 (100.0%) | 711 (100.0%) |
Housing Occupancy in Auburn Lake Trails
Occupancy by Ownership in Auburn Lake Trails
Of the total 1,518 dwellings in Auburn Lake Trails, owner-occupied units account for 1,407 (92.7%), while renter-occupied units make up 111 (7.3%).
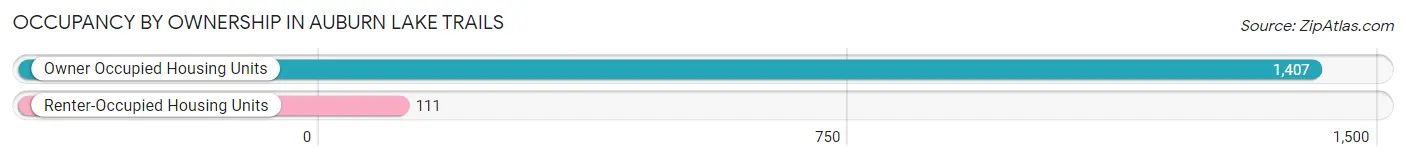
| Occupancy | # Housing Units | % Housing Units |
| Owner Occupied Housing Units | 1,407 | 92.7% |
| Renter-Occupied Housing Units | 111 | 7.3% |
| Total Occupied Housing Units | 1,518 | 100.0% |
Occupancy by Household Size in Auburn Lake Trails
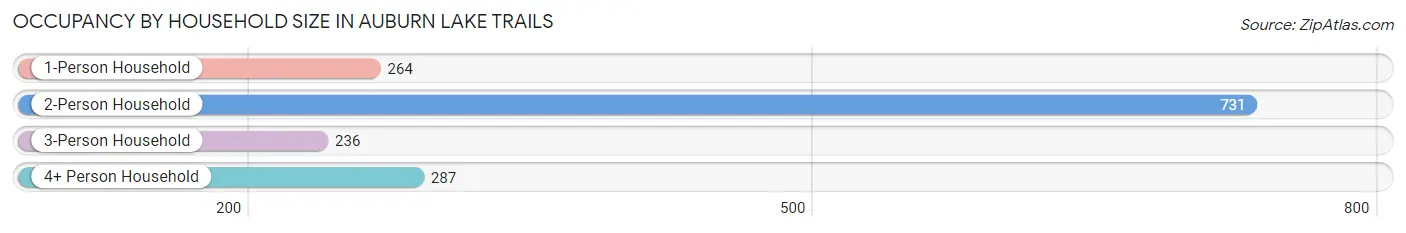
| Household Size | # Housing Units | % Housing Units |
| 1-Person Household | 264 | 17.4% |
| 2-Person Household | 731 | 48.2% |
| 3-Person Household | 236 | 15.5% |
| 4+ Person Household | 287 | 18.9% |
| Total Housing Units | 1,518 | 100.0% |
Occupancy by Ownership by Household Size in Auburn Lake Trails
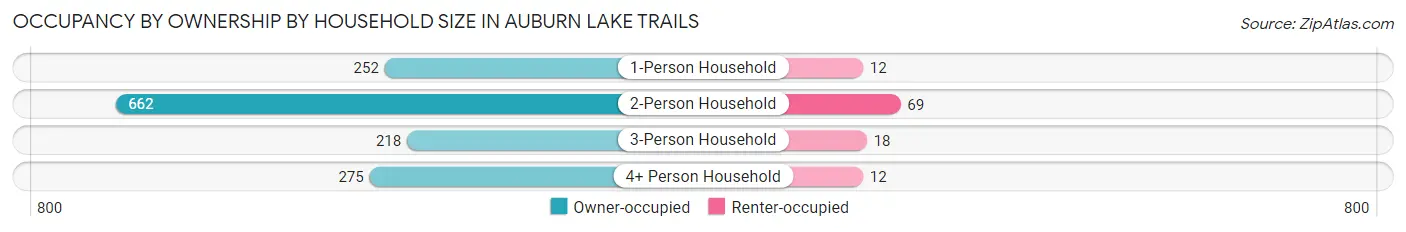
| Household Size | Owner-occupied | Renter-occupied |
| 1-Person Household | 252 (95.5%) | 12 (4.5%) |
| 2-Person Household | 662 (90.6%) | 69 (9.4%) |
| 3-Person Household | 218 (92.4%) | 18 (7.6%) |
| 4+ Person Household | 275 (95.8%) | 12 (4.2%) |
| Total Housing Units | 1,407 (92.7%) | 111 (7.3%) |
Occupancy by Educational Attainment in Auburn Lake Trails
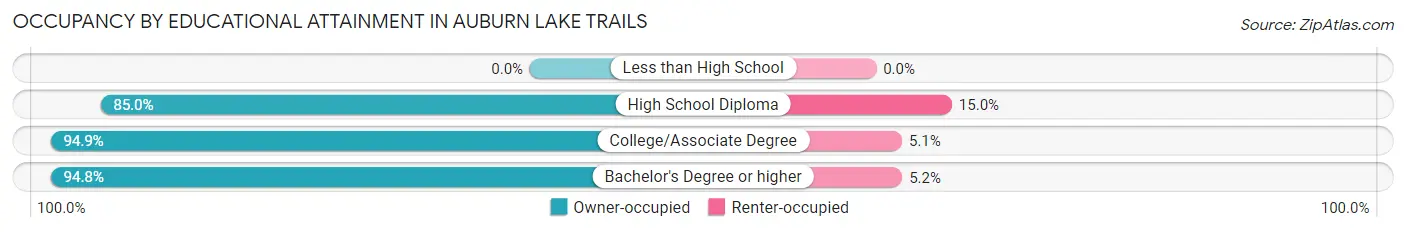
| Household Size | Owner-occupied | Renter-occupied |
| Less than High School | 0 (0.0%) | 0 (0.0%) |
| High School Diploma | 283 (85.0%) | 50 (15.0%) |
| College/Associate Degree | 573 (94.9%) | 31 (5.1%) |
| Bachelor's Degree or higher | 551 (94.8%) | 30 (5.2%) |
Occupancy by Age of Householder in Auburn Lake Trails
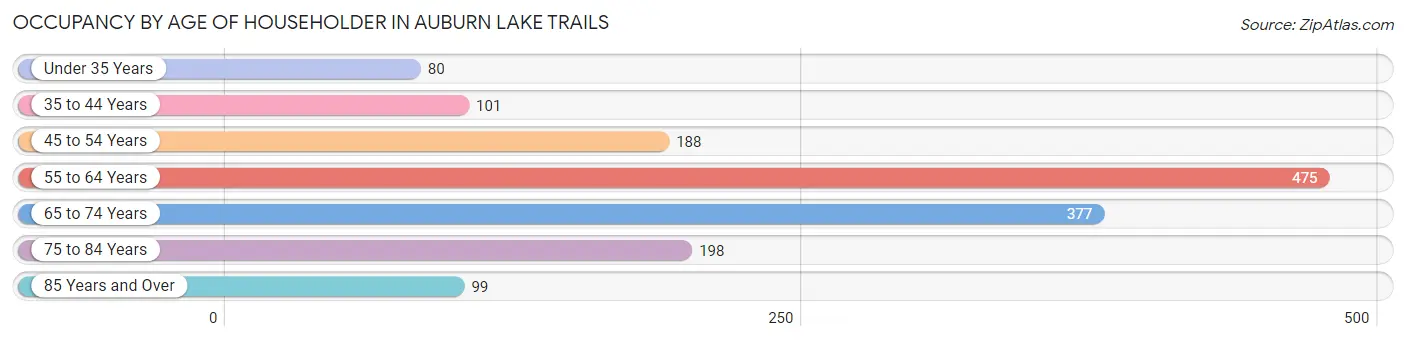
| Age Bracket | # Households | % Households |
| Under 35 Years | 80 | 5.3% |
| 35 to 44 Years | 101 | 6.7% |
| 45 to 54 Years | 188 | 12.4% |
| 55 to 64 Years | 475 | 31.3% |
| 65 to 74 Years | 377 | 24.8% |
| 75 to 84 Years | 198 | 13.0% |
| 85 Years and Over | 99 | 6.5% |
| Total | 1,518 | 100.0% |
Housing Finances in Auburn Lake Trails
Median Income by Occupancy in Auburn Lake Trails
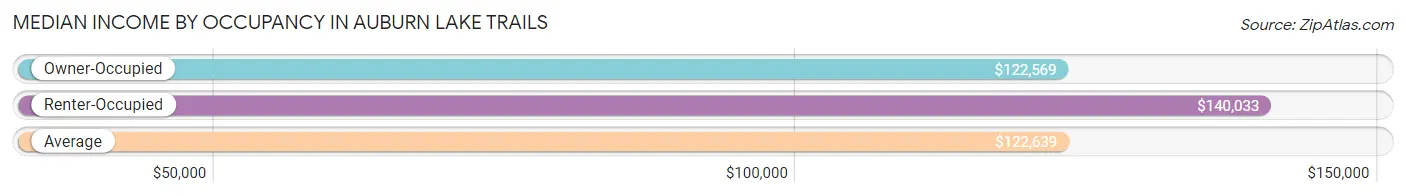
| Occupancy Type | # Households | Median Income |
| Owner-Occupied | 1,407 (92.7%) | $122,569 |
| Renter-Occupied | 111 (7.3%) | $140,033 |
| Average | 1,518 (100.0%) | $122,639 |
Occupancy by Householder Income Bracket in Auburn Lake Trails
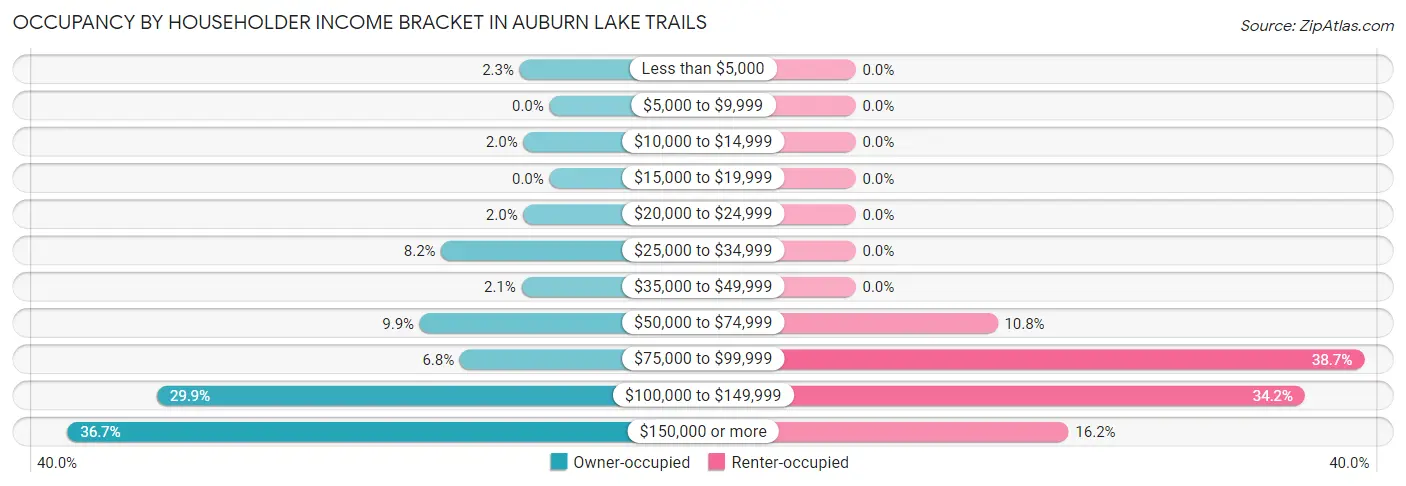
| Income Bracket | Owner-occupied | Renter-occupied |
| Less than $5,000 | 32 (2.3%) | 0 (0.0%) |
| $5,000 to $9,999 | 0 (0.0%) | 0 (0.0%) |
| $10,000 to $14,999 | 28 (2.0%) | 0 (0.0%) |
| $15,000 to $19,999 | 0 (0.0%) | 0 (0.0%) |
| $20,000 to $24,999 | 28 (2.0%) | 0 (0.0%) |
| $25,000 to $34,999 | 116 (8.2%) | 0 (0.0%) |
| $35,000 to $49,999 | 30 (2.1%) | 0 (0.0%) |
| $50,000 to $74,999 | 139 (9.9%) | 12 (10.8%) |
| $75,000 to $99,999 | 96 (6.8%) | 43 (38.7%) |
| $100,000 to $149,999 | 421 (29.9%) | 38 (34.2%) |
| $150,000 or more | 517 (36.7%) | 18 (16.2%) |
| Total | 1,407 (100.0%) | 111 (100.0%) |
Monthly Housing Cost Tiers in Auburn Lake Trails
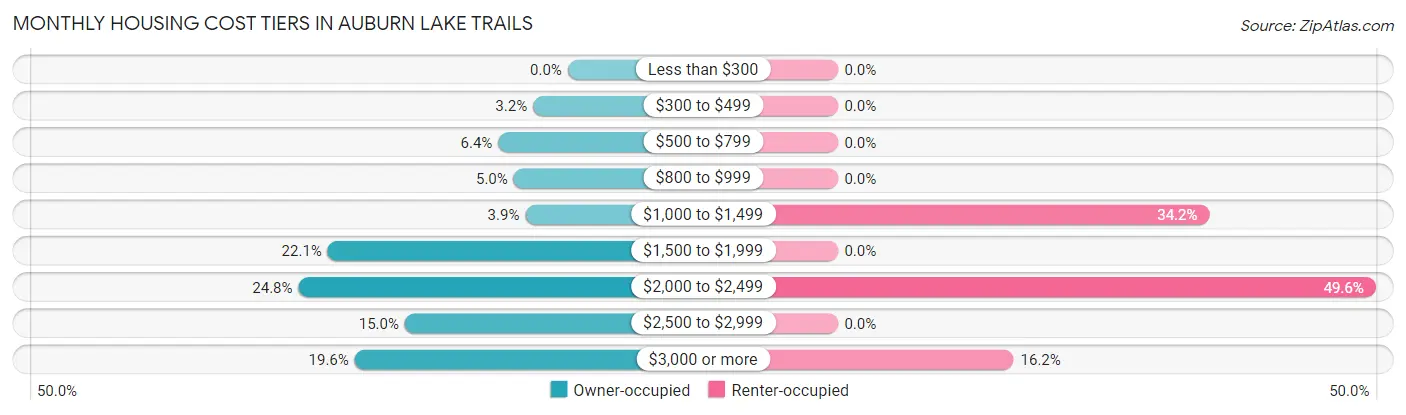
| Monthly Cost | Owner-occupied | Renter-occupied |
| Less than $300 | 0 (0.0%) | 0 (0.0%) |
| $300 to $499 | 45 (3.2%) | 0 (0.0%) |
| $500 to $799 | 90 (6.4%) | 0 (0.0%) |
| $800 to $999 | 70 (5.0%) | 0 (0.0%) |
| $1,000 to $1,499 | 55 (3.9%) | 38 (34.2%) |
| $1,500 to $1,999 | 311 (22.1%) | 0 (0.0%) |
| $2,000 to $2,499 | 349 (24.8%) | 55 (49.5%) |
| $2,500 to $2,999 | 211 (15.0%) | 0 (0.0%) |
| $3,000 or more | 276 (19.6%) | 18 (16.2%) |
| Total | 1,407 (100.0%) | 111 (100.0%) |
Physical Housing Characteristics in Auburn Lake Trails
Housing Structures in Auburn Lake Trails
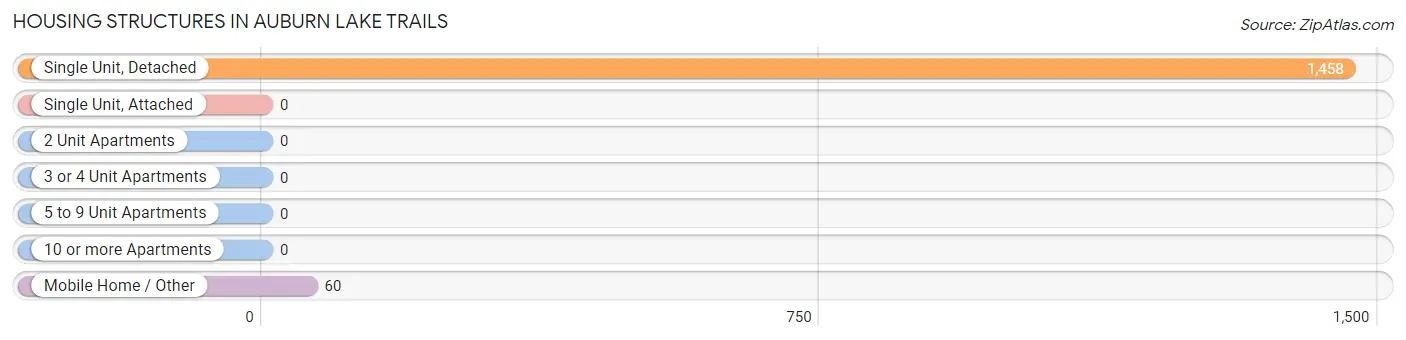
| Structure Type | # Housing Units | % Housing Units |
| Single Unit, Detached | 1,458 | 96.1% |
| Single Unit, Attached | 0 | 0.0% |
| 2 Unit Apartments | 0 | 0.0% |
| 3 or 4 Unit Apartments | 0 | 0.0% |
| 5 to 9 Unit Apartments | 0 | 0.0% |
| 10 or more Apartments | 0 | 0.0% |
| Mobile Home / Other | 60 | 4.0% |
| Total | 1,518 | 100.0% |
Housing Structures by Occupancy in Auburn Lake Trails
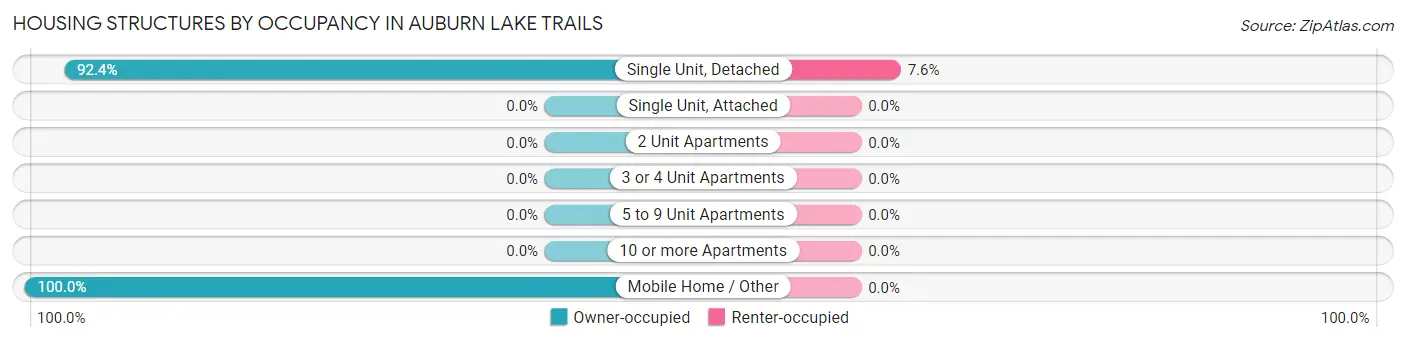
| Structure Type | Owner-occupied | Renter-occupied |
| Single Unit, Detached | 1,347 (92.4%) | 111 (7.6%) |
| Single Unit, Attached | 0 (0.0%) | 0 (0.0%) |
| 2 Unit Apartments | 0 (0.0%) | 0 (0.0%) |
| 3 or 4 Unit Apartments | 0 (0.0%) | 0 (0.0%) |
| 5 to 9 Unit Apartments | 0 (0.0%) | 0 (0.0%) |
| 10 or more Apartments | 0 (0.0%) | 0 (0.0%) |
| Mobile Home / Other | 60 (100.0%) | 0 (0.0%) |
| Total | 1,407 (92.7%) | 111 (7.3%) |
Housing Structures by Number of Rooms in Auburn Lake Trails
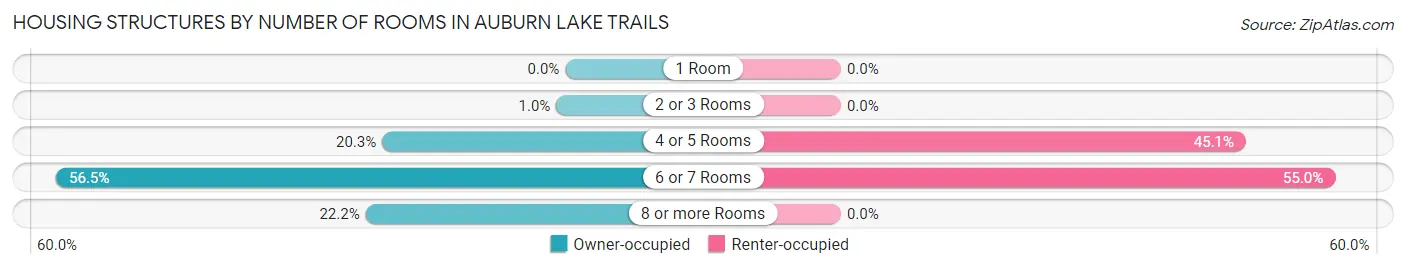
| Number of Rooms | Owner-occupied | Renter-occupied |
| 1 Room | 0 (0.0%) | 0 (0.0%) |
| 2 or 3 Rooms | 14 (1.0%) | 0 (0.0%) |
| 4 or 5 Rooms | 286 (20.3%) | 50 (45.1%) |
| 6 or 7 Rooms | 795 (56.5%) | 61 (54.9%) |
| 8 or more Rooms | 312 (22.2%) | 0 (0.0%) |
| Total | 1,407 (100.0%) | 111 (100.0%) |
Housing Structure by Heating Type in Auburn Lake Trails
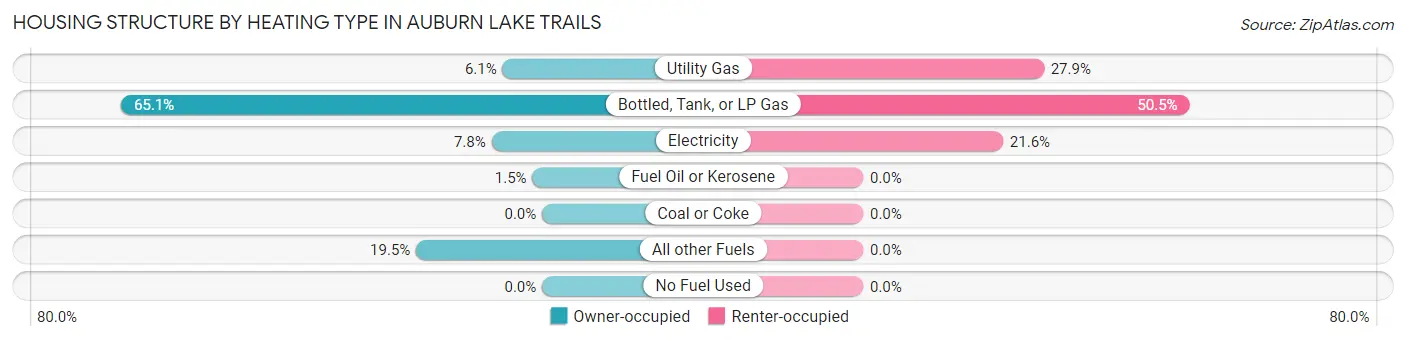
| Heating Type | Owner-occupied | Renter-occupied |
| Utility Gas | 86 (6.1%) | 31 (27.9%) |
| Bottled, Tank, or LP Gas | 916 (65.1%) | 56 (50.4%) |
| Electricity | 110 (7.8%) | 24 (21.6%) |
| Fuel Oil or Kerosene | 21 (1.5%) | 0 (0.0%) |
| Coal or Coke | 0 (0.0%) | 0 (0.0%) |
| All other Fuels | 274 (19.5%) | 0 (0.0%) |
| No Fuel Used | 0 (0.0%) | 0 (0.0%) |
| Total | 1,407 (100.0%) | 111 (100.0%) |
Household Vehicle Usage in Auburn Lake Trails
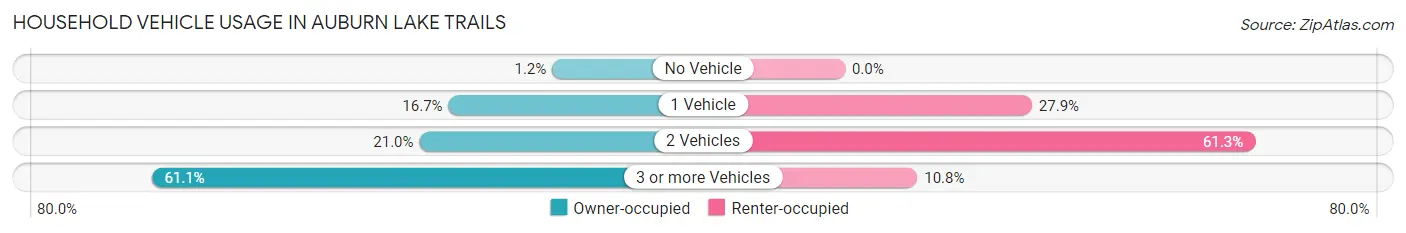
| Vehicles per Household | Owner-occupied | Renter-occupied |
| No Vehicle | 17 (1.2%) | 0 (0.0%) |
| 1 Vehicle | 235 (16.7%) | 31 (27.9%) |
| 2 Vehicles | 296 (21.0%) | 68 (61.3%) |
| 3 or more Vehicles | 859 (61.1%) | 12 (10.8%) |
| Total | 1,407 (100.0%) | 111 (100.0%) |
Real Estate & Mortgages in Auburn Lake Trails
Real Estate and Mortgage Overview in Auburn Lake Trails
| Characteristic | Without Mortgage | With Mortgage |
| Housing Units | 307 | 1,100 |
| Median Property Value | $455,200 | $475,200 |
| Median Household Income | $66,776 | $456 |
| Monthly Housing Costs | $893 | $276 |
| Real Estate Taxes | $2,905 | $28 |
Property Value by Mortgage Status in Auburn Lake Trails
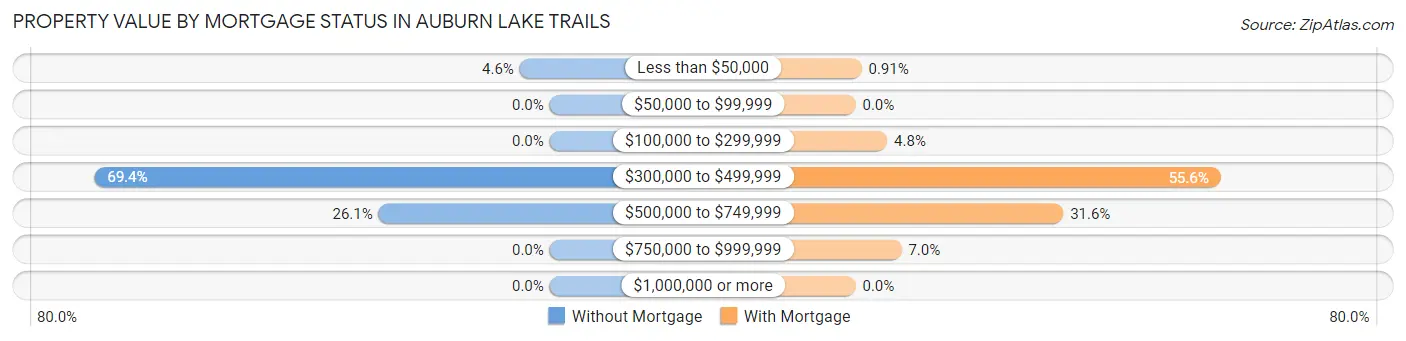
| Property Value | Without Mortgage | With Mortgage |
| Less than $50,000 | 14 (4.6%) | 10 (0.9%) |
| $50,000 to $99,999 | 0 (0.0%) | 0 (0.0%) |
| $100,000 to $299,999 | 0 (0.0%) | 53 (4.8%) |
| $300,000 to $499,999 | 213 (69.4%) | 612 (55.6%) |
| $500,000 to $749,999 | 80 (26.1%) | 348 (31.6%) |
| $750,000 to $999,999 | 0 (0.0%) | 77 (7.0%) |
| $1,000,000 or more | 0 (0.0%) | 0 (0.0%) |
| Total | 307 (100.0%) | 1,100 (100.0%) |
Household Income by Mortgage Status in Auburn Lake Trails
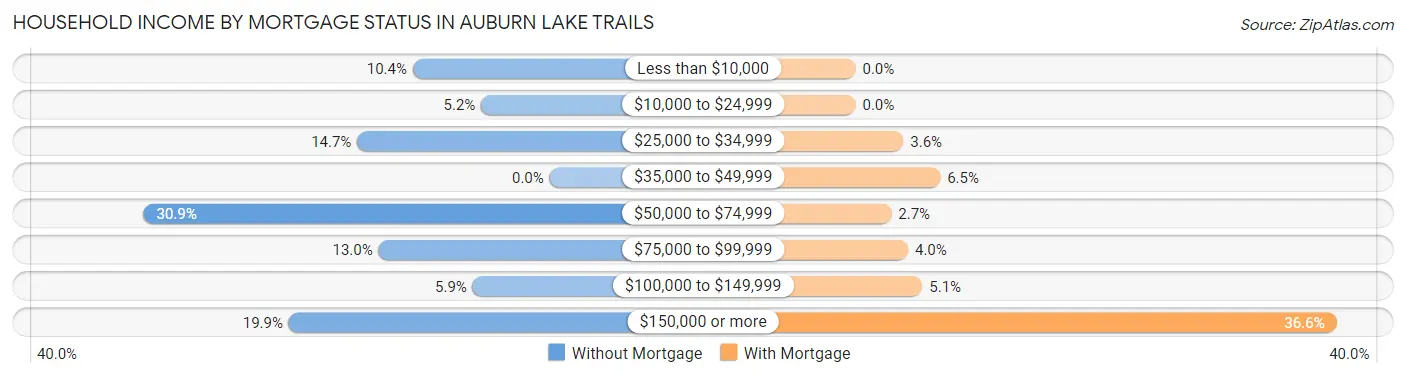
| Household Income | Without Mortgage | With Mortgage |
| Less than $10,000 | 32 (10.4%) | 0 (0.0%) |
| $10,000 to $24,999 | 16 (5.2%) | 0 (0.0%) |
| $25,000 to $34,999 | 45 (14.7%) | 40 (3.6%) |
| $35,000 to $49,999 | 0 (0.0%) | 71 (6.5%) |
| $50,000 to $74,999 | 95 (30.9%) | 30 (2.7%) |
| $75,000 to $99,999 | 40 (13.0%) | 44 (4.0%) |
| $100,000 to $149,999 | 18 (5.9%) | 56 (5.1%) |
| $150,000 or more | 61 (19.9%) | 403 (36.6%) |
| Total | 307 (100.0%) | 1,100 (100.0%) |
Property Value to Household Income Ratio in Auburn Lake Trails
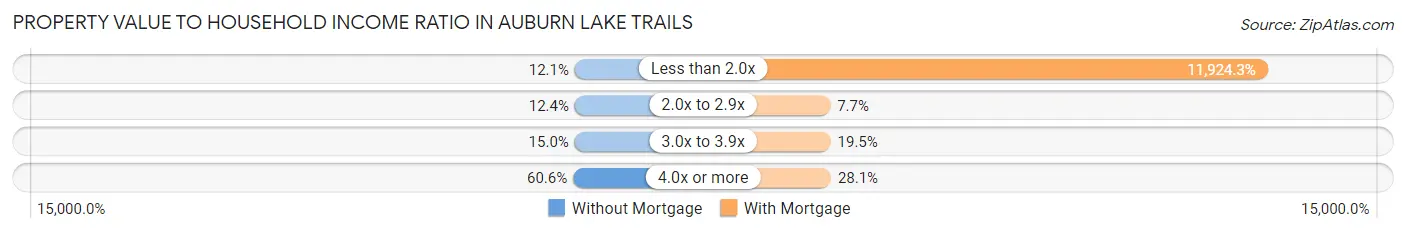
| Value-to-Income Ratio | Without Mortgage | With Mortgage |
| Less than 2.0x | 37 (12.0%) | 131,167 (11,924.3%) |
| 2.0x to 2.9x | 38 (12.4%) | 85 (7.7%) |
| 3.0x to 3.9x | 46 (15.0%) | 214 (19.5%) |
| 4.0x or more | 186 (60.6%) | 309 (28.1%) |
| Total | 307 (100.0%) | 1,100 (100.0%) |
Real Estate Taxes by Mortgage Status in Auburn Lake Trails
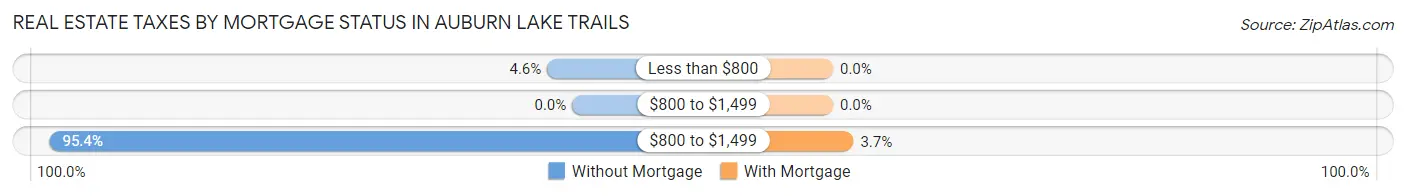
| Property Taxes | Without Mortgage | With Mortgage |
| Less than $800 | 14 (4.6%) | 0 (0.0%) |
| $800 to $1,499 | 0 (0.0%) | 0 (0.0%) |
| $800 to $1,499 | 293 (95.4%) | 41 (3.7%) |
| Total | 307 (100.0%) | 1,100 (100.0%) |
Health & Disability in Auburn Lake Trails
Health Insurance Coverage by Age in Auburn Lake Trails
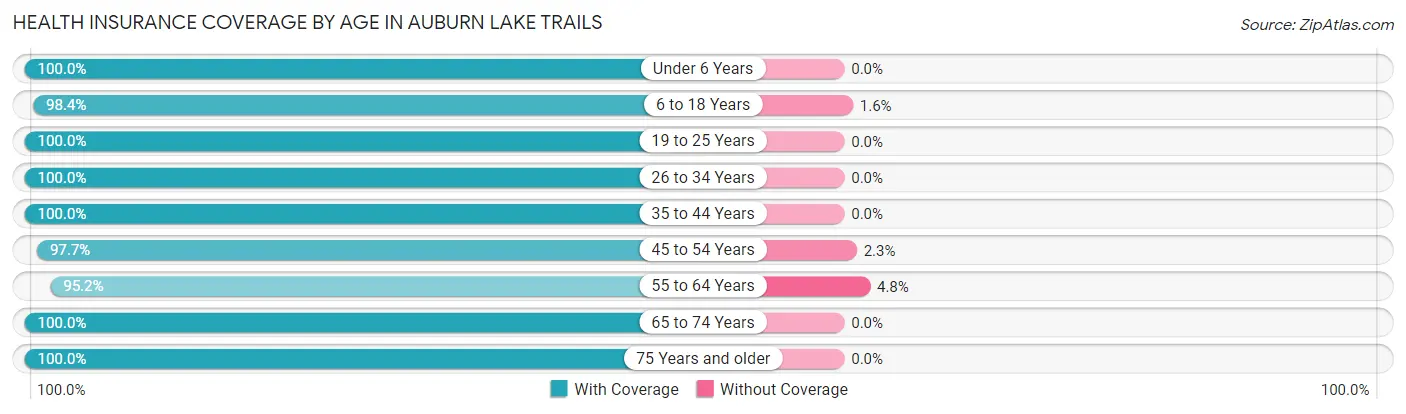
| Age Bracket | With Coverage | Without Coverage |
| Under 6 Years | 180 (100.0%) | 0 (0.0%) |
| 6 to 18 Years | 620 (98.4%) | 10 (1.6%) |
| 19 to 25 Years | 52 (100.0%) | 0 (0.0%) |
| 26 to 34 Years | 283 (100.0%) | 0 (0.0%) |
| 35 to 44 Years | 382 (100.0%) | 0 (0.0%) |
| 45 to 54 Years | 381 (97.7%) | 9 (2.3%) |
| 55 to 64 Years | 892 (95.2%) | 45 (4.8%) |
| 65 to 74 Years | 552 (100.0%) | 0 (0.0%) |
| 75 Years and older | 440 (100.0%) | 0 (0.0%) |
| Total | 3,782 (98.3%) | 64 (1.7%) |
Health Insurance Coverage by Citizenship Status in Auburn Lake Trails
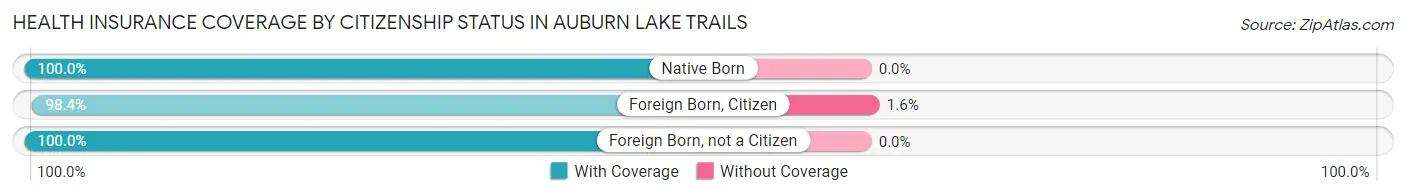
| Citizenship Status | With Coverage | Without Coverage |
| Native Born | 180 (100.0%) | 0 (0.0%) |
| Foreign Born, Citizen | 620 (98.4%) | 10 (1.6%) |
| Foreign Born, not a Citizen | 52 (100.0%) | 0 (0.0%) |
Health Insurance Coverage by Household Income in Auburn Lake Trails
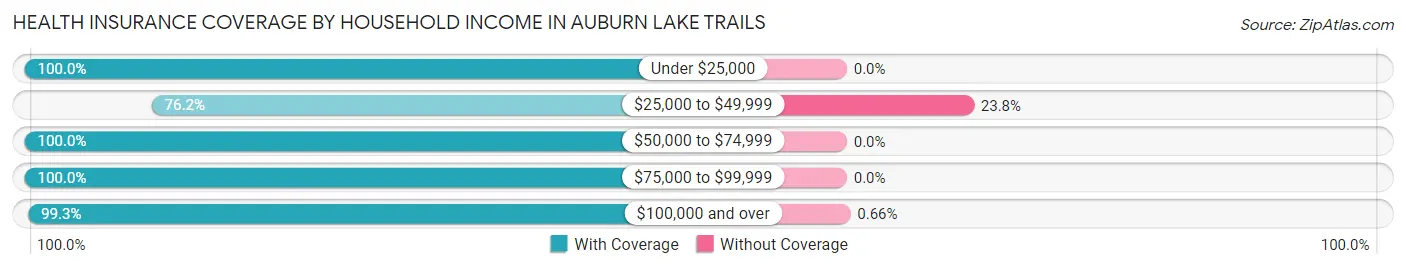
| Household Income | With Coverage | Without Coverage |
| Under $25,000 | 214 (100.0%) | 0 (0.0%) |
| $25,000 to $49,999 | 144 (76.2%) | 45 (23.8%) |
| $50,000 to $74,999 | 300 (100.0%) | 0 (0.0%) |
| $75,000 to $99,999 | 255 (100.0%) | 0 (0.0%) |
| $100,000 and over | 2,869 (99.3%) | 19 (0.7%) |
Public vs Private Health Insurance Coverage by Age in Auburn Lake Trails
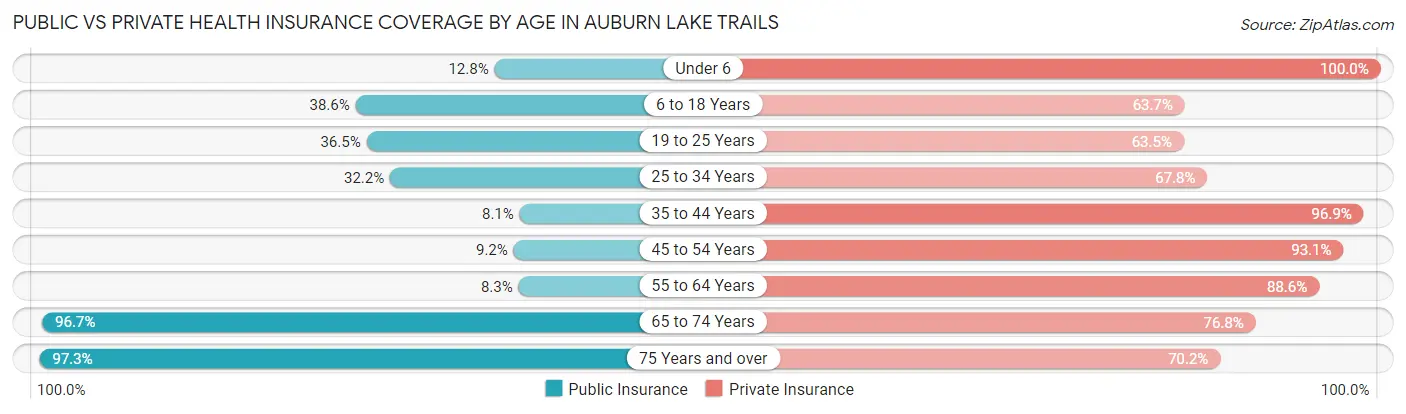
| Age Bracket | Public Insurance | Private Insurance |
| Under 6 | 23 (12.8%) | 180 (100.0%) |
| 6 to 18 Years | 243 (38.6%) | 401 (63.6%) |
| 19 to 25 Years | 19 (36.5%) | 33 (63.5%) |
| 25 to 34 Years | 91 (32.2%) | 192 (67.8%) |
| 35 to 44 Years | 31 (8.1%) | 370 (96.9%) |
| 45 to 54 Years | 36 (9.2%) | 363 (93.1%) |
| 55 to 64 Years | 78 (8.3%) | 830 (88.6%) |
| 65 to 74 Years | 534 (96.7%) | 424 (76.8%) |
| 75 Years and over | 428 (97.3%) | 309 (70.2%) |
| Total | 1,483 (38.6%) | 3,102 (80.7%) |
Disability Status by Sex by Age in Auburn Lake Trails
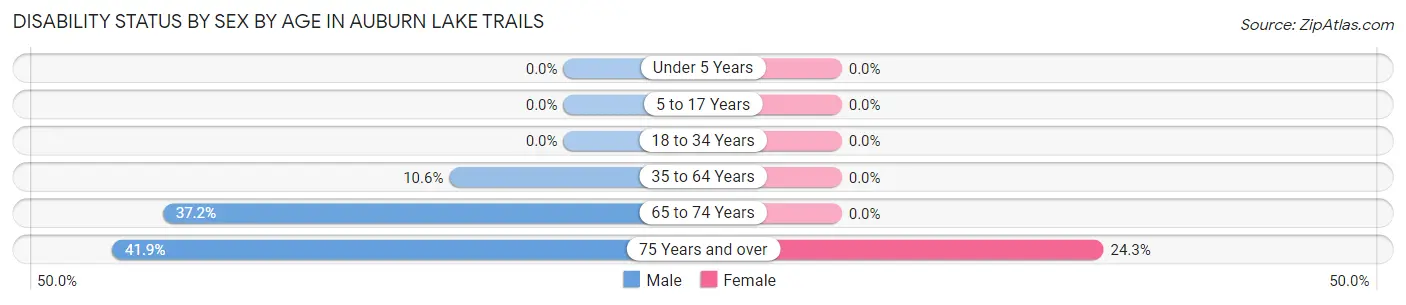
| Age Bracket | Male | Female |
| Under 5 Years | 0 (0.0%) | 0 (0.0%) |
| 5 to 17 Years | 0 (0.0%) | 0 (0.0%) |
| 18 to 34 Years | 0 (0.0%) | 0 (0.0%) |
| 35 to 64 Years | 90 (10.6%) | 0 (0.0%) |
| 65 to 74 Years | 113 (37.2%) | 0 (0.0%) |
| 75 Years and over | 67 (41.9%) | 68 (24.3%) |
Disability Class by Sex by Age in Auburn Lake Trails
Disability Class: Hearing Difficulty
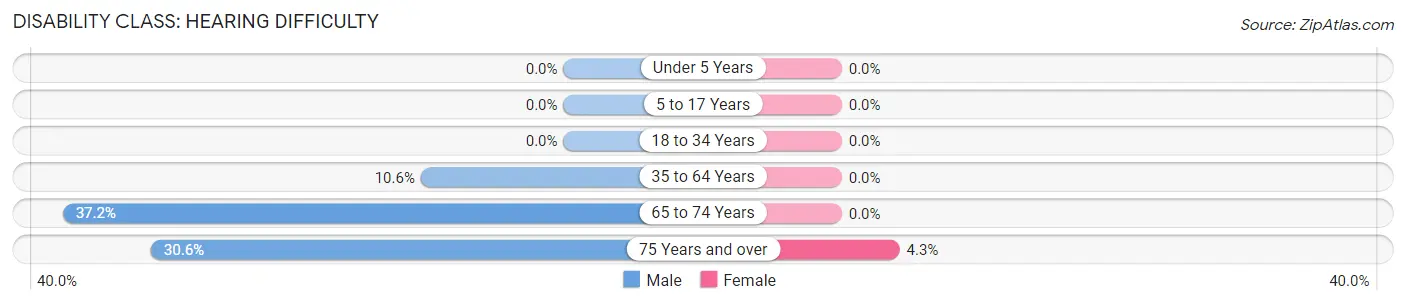
| Age Bracket | Male | Female |
| Under 5 Years | 0 (0.0%) | 0 (0.0%) |
| 5 to 17 Years | 0 (0.0%) | 0 (0.0%) |
| 18 to 34 Years | 0 (0.0%) | 0 (0.0%) |
| 35 to 64 Years | 90 (10.6%) | 0 (0.0%) |
| 65 to 74 Years | 113 (37.2%) | 0 (0.0%) |
| 75 Years and over | 49 (30.6%) | 12 (4.3%) |
Disability Class: Vision Difficulty
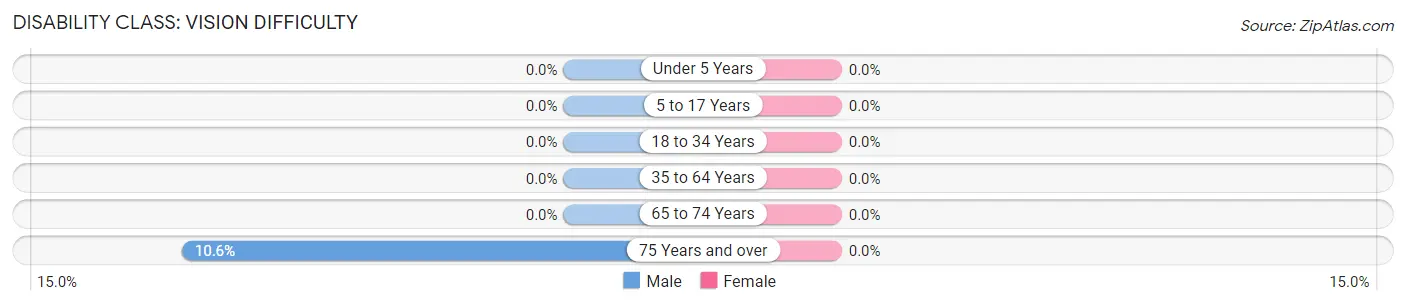
| Age Bracket | Male | Female |
| Under 5 Years | 0 (0.0%) | 0 (0.0%) |
| 5 to 17 Years | 0 (0.0%) | 0 (0.0%) |
| 18 to 34 Years | 0 (0.0%) | 0 (0.0%) |
| 35 to 64 Years | 0 (0.0%) | 0 (0.0%) |
| 65 to 74 Years | 0 (0.0%) | 0 (0.0%) |
| 75 Years and over | 17 (10.6%) | 0 (0.0%) |
Disability Class: Cognitive Difficulty
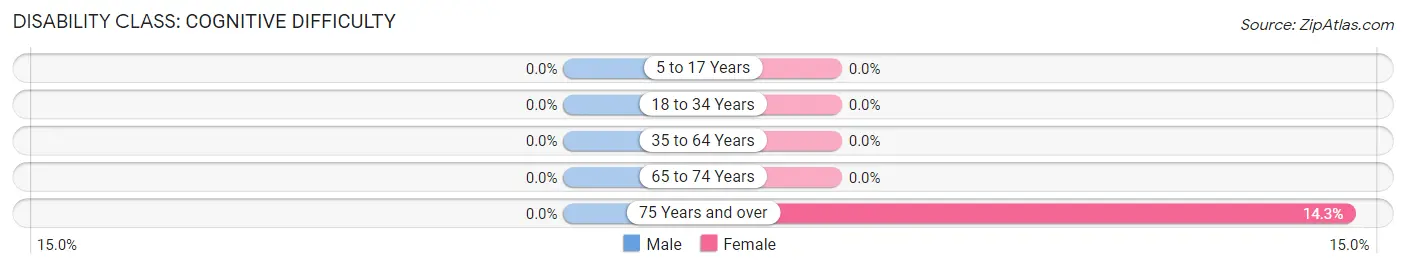
| Age Bracket | Male | Female |
| 5 to 17 Years | 0 (0.0%) | 0 (0.0%) |
| 18 to 34 Years | 0 (0.0%) | 0 (0.0%) |
| 35 to 64 Years | 0 (0.0%) | 0 (0.0%) |
| 65 to 74 Years | 0 (0.0%) | 0 (0.0%) |
| 75 Years and over | 0 (0.0%) | 40 (14.3%) |
Disability Class: Ambulatory Difficulty
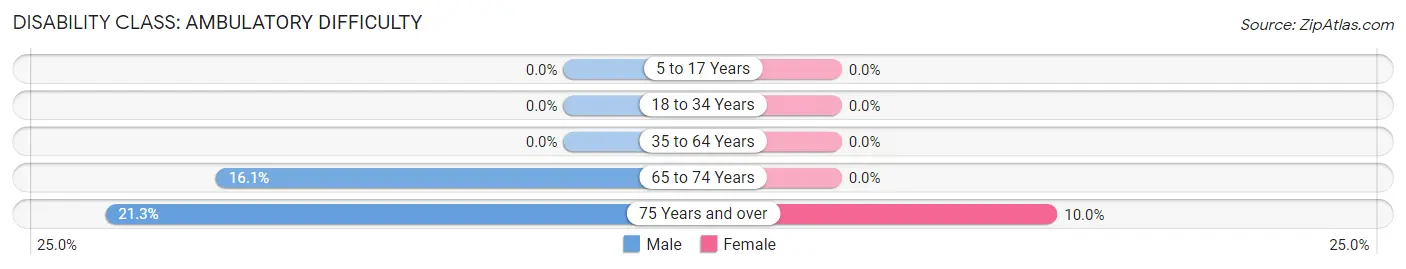
| Age Bracket | Male | Female |
| 5 to 17 Years | 0 (0.0%) | 0 (0.0%) |
| 18 to 34 Years | 0 (0.0%) | 0 (0.0%) |
| 35 to 64 Years | 0 (0.0%) | 0 (0.0%) |
| 65 to 74 Years | 49 (16.1%) | 0 (0.0%) |
| 75 Years and over | 34 (21.2%) | 28 (10.0%) |
Disability Class: Self-Care Difficulty
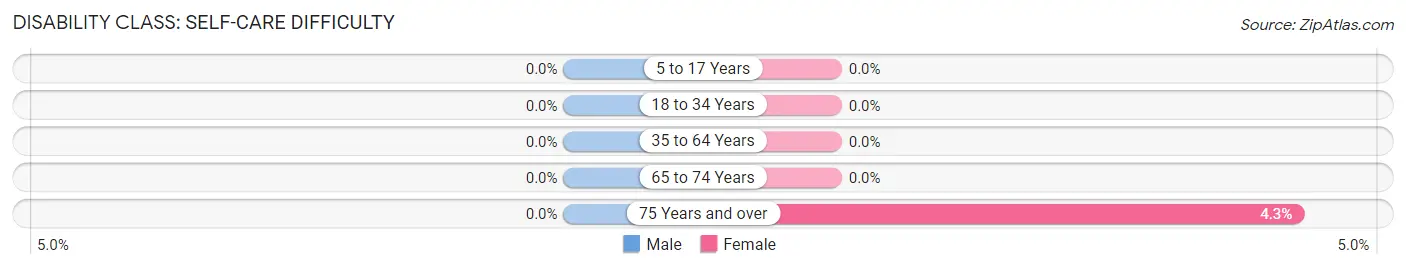
| Age Bracket | Male | Female |
| 5 to 17 Years | 0 (0.0%) | 0 (0.0%) |
| 18 to 34 Years | 0 (0.0%) | 0 (0.0%) |
| 35 to 64 Years | 0 (0.0%) | 0 (0.0%) |
| 65 to 74 Years | 0 (0.0%) | 0 (0.0%) |
| 75 Years and over | 0 (0.0%) | 12 (4.3%) |
Technology Access in Auburn Lake Trails
Computing Device Access in Auburn Lake Trails
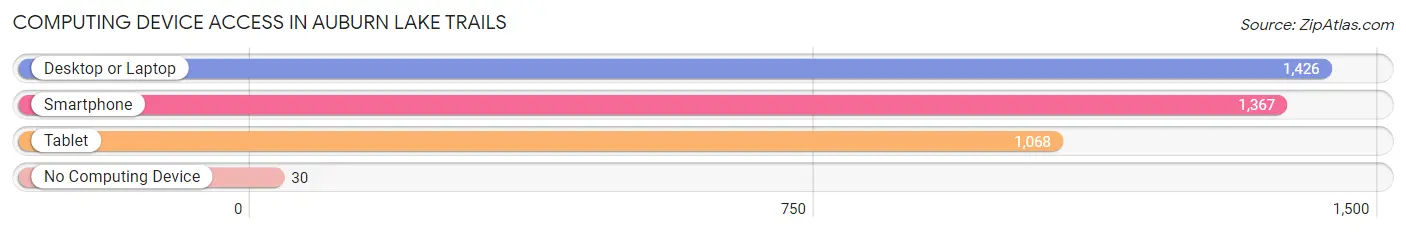
| Device Type | # Households | % Households |
| Desktop or Laptop | 1,426 | 93.9% |
| Smartphone | 1,367 | 90.0% |
| Tablet | 1,068 | 70.4% |
| No Computing Device | 30 | 2.0% |
| Total | 1,518 | 100.0% |
Internet Access in Auburn Lake Trails
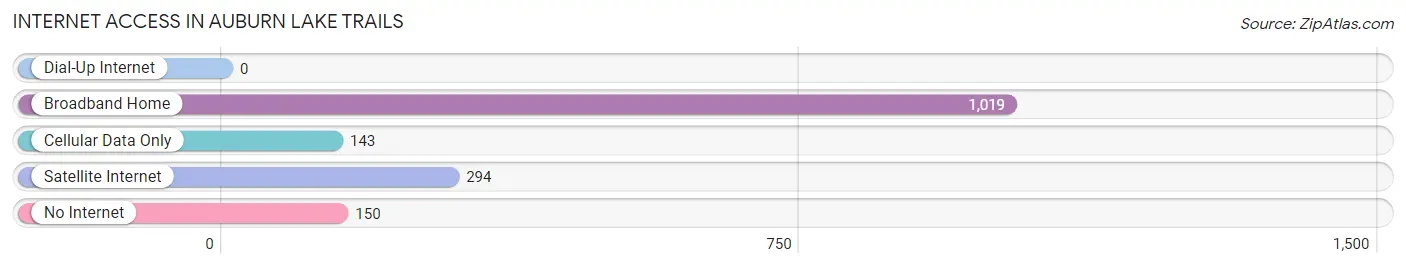
| Internet Type | # Households | % Households |
| Dial-Up Internet | 0 | 0.0% |
| Broadband Home | 1,019 | 67.1% |
| Cellular Data Only | 143 | 9.4% |
| Satellite Internet | 294 | 19.4% |
| No Internet | 150 | 9.9% |
| Total | 1,518 | 100.0% |
Auburn Lake Trails Summary
Auburn Lake Trails is a census-designated place (CDP) located in El Dorado County, California. It is situated in the Sierra Nevada foothills, approximately 25 miles east of the state capital, Sacramento. The population of Auburn Lake Trails was 1,845 at the 2010 census.
History
The area that is now Auburn Lake Trails was originally inhabited by the Nisenan Native Americans. The first European settlers arrived in the area in the mid-1800s, and the town of Auburn Lake Trails was established in 1849. The town was named after the nearby Auburn Lake, which was named after the Auburn Ravine, which was named after the Auburn Mining Company.
The town of Auburn Lake Trails was originally a mining town, and the area was home to several gold mines. The town was also home to a number of lumber mills, which provided lumber for the construction of homes and other buildings in the area.
In the early 1900s, the town of Auburn Lake Trails began to transition from a mining town to a resort town. The area was home to several resorts, including the Auburn Lake Trails Resort, which was established in the 1920s. The resort was a popular destination for tourists, and it was home to a number of activities, including fishing, swimming, and horseback riding.
Geography
Auburn Lake Trails is located in El Dorado County, California. It is situated in the Sierra Nevada foothills, approximately 25 miles east of the state capital, Sacramento. The town is located at an elevation of 2,000 feet above sea level.
The town of Auburn Lake Trails is located in a rural area, and it is surrounded by forests and rolling hills. The nearby Auburn Lake is a popular destination for fishing and other recreational activities.
Economy
The economy of Auburn Lake Trails is largely based on tourism. The town is home to several resorts, including the Auburn Lake Trails Resort, which is a popular destination for tourists. The town is also home to a number of restaurants, shops, and other businesses that cater to tourists.
In addition to tourism, the town of Auburn Lake Trails is also home to a number of small businesses, including a number of wineries and vineyards. The town is also home to a number of farms, which produce a variety of fruits and vegetables.
Demographics
As of the 2010 census, the population of Auburn Lake Trails was 1,845. The racial makeup of the town was 94.3% White, 0.7% African American, 0.7% Native American, 0.7% Asian, 0.2% Pacific Islander, 1.2% from other races, and 2.1% from two or more races. Hispanic or Latino of any race were 4.2% of the population.
The median household income in Auburn Lake Trails was $50,938, and the median family income was $58,906. The per capita income for the town was $25,945. About 8.3% of families and 10.7% of the population were below the poverty line, including 14.2% of those under age 18 and 5.2% of those age 65 or over.
Common Questions
What is Per Capita Income in Auburn Lake Trails?
Per Capita income in Auburn Lake Trails is $55,111.
What is the Median Family Income in Auburn Lake Trails?
Median Family Income in Auburn Lake Trails is $140,430.
What is the Median Household income in Auburn Lake Trails?
Median Household Income in Auburn Lake Trails is $122,639.
What is Income or Wage Gap in Auburn Lake Trails?
Income or Wage Gap in Auburn Lake Trails is 31.4%.
Women in Auburn Lake Trails earn 68.6 cents for every dollar earned by a man.
What is Inequality or Gini Index in Auburn Lake Trails?
Inequality or Gini Index in Auburn Lake Trails is 0.37.
What is the Total Population of Auburn Lake Trails?
Total Population of Auburn Lake Trails is 3,846.
What is the Total Male Population of Auburn Lake Trails?
Total Male Population of Auburn Lake Trails is 1,763.
What is the Total Female Population of Auburn Lake Trails?
Total Female Population of Auburn Lake Trails is 2,083.
What is the Ratio of Males per 100 Females in Auburn Lake Trails?
There are 84.64 Males per 100 Females in Auburn Lake Trails.
What is the Ratio of Females per 100 Males in Auburn Lake Trails?
There are 118.15 Females per 100 Males in Auburn Lake Trails.
What is the Median Population Age in Auburn Lake Trails?
Median Population Age in Auburn Lake Trails is 55.1 Years.
What is the Average Family Size in Auburn Lake Trails
Average Family Size in Auburn Lake Trails is 2.9 People.
What is the Average Household Size in Auburn Lake Trails
Average Household Size in Auburn Lake Trails is 2.5 People.
How Large is the Labor Force in Auburn Lake Trails?
There are 1,829 People in the Labor Forcein in Auburn Lake Trails.
What is the Percentage of People in the Labor Force in Auburn Lake Trails?
55.6% of People are in the Labor Force in Auburn Lake Trails.
What is the Unemployment Rate in Auburn Lake Trails?
Unemployment Rate in Auburn Lake Trails is 4.0%.