Ruth, CA Map & Demographics
Ruth Map
Ruth Overview
$39,678
PER CAPITA INCOME
$58,333
AVG HOUSEHOLD INCOME
0.39
INEQUALITY / GINI INDEX
151
TOTAL POPULATION
88
MALE POPULATION
63
FEMALE POPULATION
139.68
MALES / 100 FEMALES
71.59
FEMALES / 100 MALES
70.2
MEDIAN AGE
2.2
AVG FAMILY SIZE
2.1
AVG HOUSEHOLD SIZE
28
LABOR FORCE [ PEOPLE ]
18.5%
PERCENT IN LABOR FORCE
Ruth Area Codes
Income in Ruth
Income Overview in Ruth
| Characteristic | Number | Measure |
| Per Capita Income | 151 | $39,678 |
| Median Family Income | 42 | $0 |
| Mean Family Income | 42 | $106,038 |
| Median Household Income | 72 | $58,333 |
| Mean Household Income | 72 | $74,890 |
| Income Deficit | 42 | $0 |
| Wage / Income Gap (%) | 151 | 0.00% |
| Wage / Income Gap ($) | 151 | 100.00¢ per $1 |
| Gini / Inequality Index | 151 | 0.39 |
Earnings by Sex in Ruth
| Sex | Number | Average Earnings |
| Male | 18 (41.9%) | $0 |
| Female | 25 (58.1%) | $0 |
| Total | 43 (100.0%) | $0 |
Earnings by Sex by Income Bracket in Ruth
The most common earnings brackets in Ruth are $2,499 or less for men (15 | 83.3%) and $100,000+ for women (13 | 52.0%).
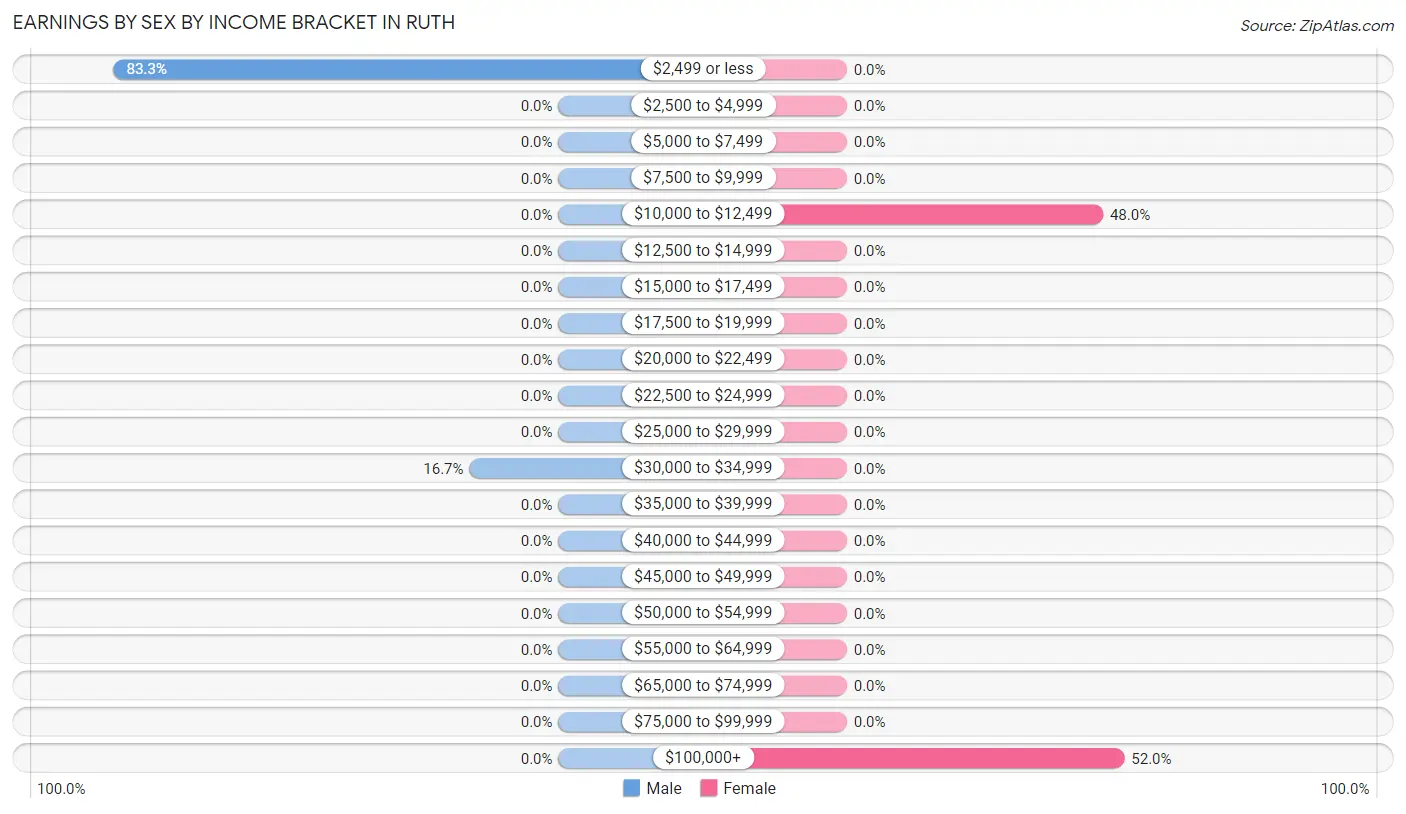
| Income | Male | Female |
| $2,499 or less | 15 (83.3%) | 0 (0.0%) |
| $2,500 to $4,999 | 0 (0.0%) | 0 (0.0%) |
| $5,000 to $7,499 | 0 (0.0%) | 0 (0.0%) |
| $7,500 to $9,999 | 0 (0.0%) | 0 (0.0%) |
| $10,000 to $12,499 | 0 (0.0%) | 12 (48.0%) |
| $12,500 to $14,999 | 0 (0.0%) | 0 (0.0%) |
| $15,000 to $17,499 | 0 (0.0%) | 0 (0.0%) |
| $17,500 to $19,999 | 0 (0.0%) | 0 (0.0%) |
| $20,000 to $22,499 | 0 (0.0%) | 0 (0.0%) |
| $22,500 to $24,999 | 0 (0.0%) | 0 (0.0%) |
| $25,000 to $29,999 | 0 (0.0%) | 0 (0.0%) |
| $30,000 to $34,999 | 3 (16.7%) | 0 (0.0%) |
| $35,000 to $39,999 | 0 (0.0%) | 0 (0.0%) |
| $40,000 to $44,999 | 0 (0.0%) | 0 (0.0%) |
| $45,000 to $49,999 | 0 (0.0%) | 0 (0.0%) |
| $50,000 to $54,999 | 0 (0.0%) | 0 (0.0%) |
| $55,000 to $64,999 | 0 (0.0%) | 0 (0.0%) |
| $65,000 to $74,999 | 0 (0.0%) | 0 (0.0%) |
| $75,000 to $99,999 | 0 (0.0%) | 0 (0.0%) |
| $100,000+ | 0 (0.0%) | 13 (52.0%) |
| Total | 18 (100.0%) | 25 (100.0%) |
Earnings by Sex by Educational Attainment in Ruth
| Educational Attainment | Male Income | Female Income |
| Less than High School | - | - |
| High School Diploma | - | - |
| College or Associate's Degree | - | - |
| Bachelor's Degree | - | - |
| Graduate Degree | - | - |
| Total | - | - |
Family Income in Ruth
Family Income Brackets in Ruth
According to the Ruth family income data, there are 19 families falling into the $150,000 to $199,999 income range, which is the most common income bracket and makes up 45.2% of all families.
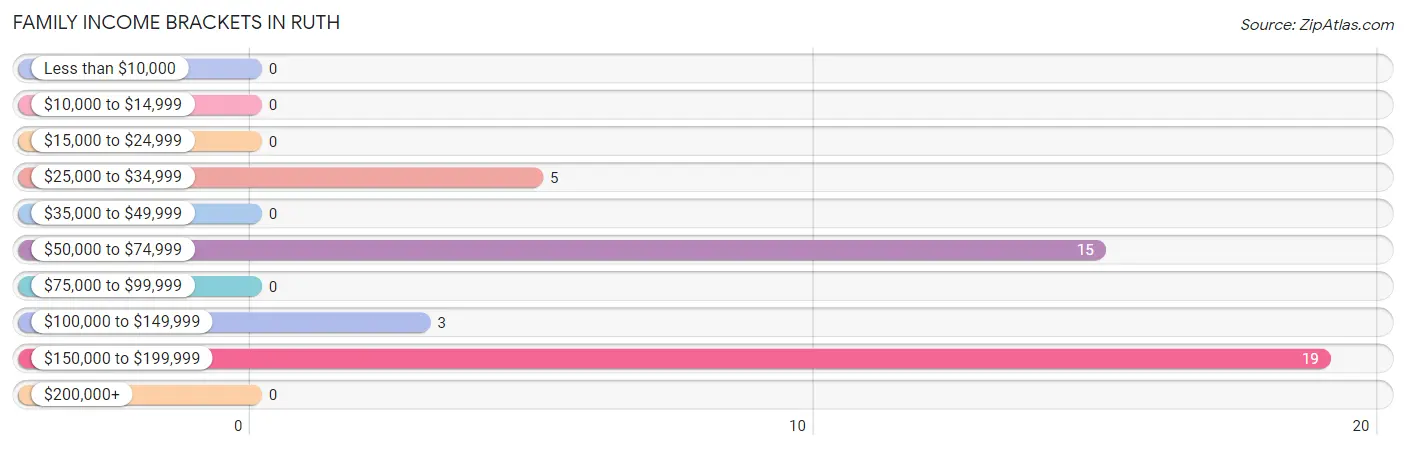
| Income Bracket | # Families | % Families |
| Less than $10,000 | 0 | 0.0% |
| $10,000 to $14,999 | 0 | 0.0% |
| $15,000 to $24,999 | 0 | 0.0% |
| $25,000 to $34,999 | 5 | 11.9% |
| $35,000 to $49,999 | 0 | 0.0% |
| $50,000 to $74,999 | 15 | 35.7% |
| $75,000 to $99,999 | 0 | 0.0% |
| $100,000 to $149,999 | 3 | 7.1% |
| $150,000 to $199,999 | 19 | 45.2% |
| $200,000+ | 0 | 0.0% |
Family Income by Famaliy Size in Ruth
| Income Bracket | # Families | Median Income |
| 2-Person Families | 42 (100.0%) | $0 |
| 3-Person Families | 0 (0.0%) | $0 |
| 4-Person Families | 0 (0.0%) | $0 |
| 5-Person Families | 0 (0.0%) | $0 |
| 6-Person Families | 0 (0.0%) | $0 |
| 7+ Person Families | 0 (0.0%) | $0 |
| Total | 42 (100.0%) | $0 |
Family Income by Number of Earners in Ruth
| Number of Earners | # Families | Median Income |
| No Earners | 17 (40.5%) | $0 |
| 1 Earner | 15 (35.7%) | $0 |
| 2 Earners | 10 (23.8%) | $0 |
| 3+ Earners | 0 (0.0%) | $0 |
| Total | 42 (100.0%) | $0 |
Household Income in Ruth
Household Income Brackets in Ruth
With 23 households falling in the category, the $25,000 to $34,999 income range is the most frequent in Ruth, accounting for 31.9% of all households.
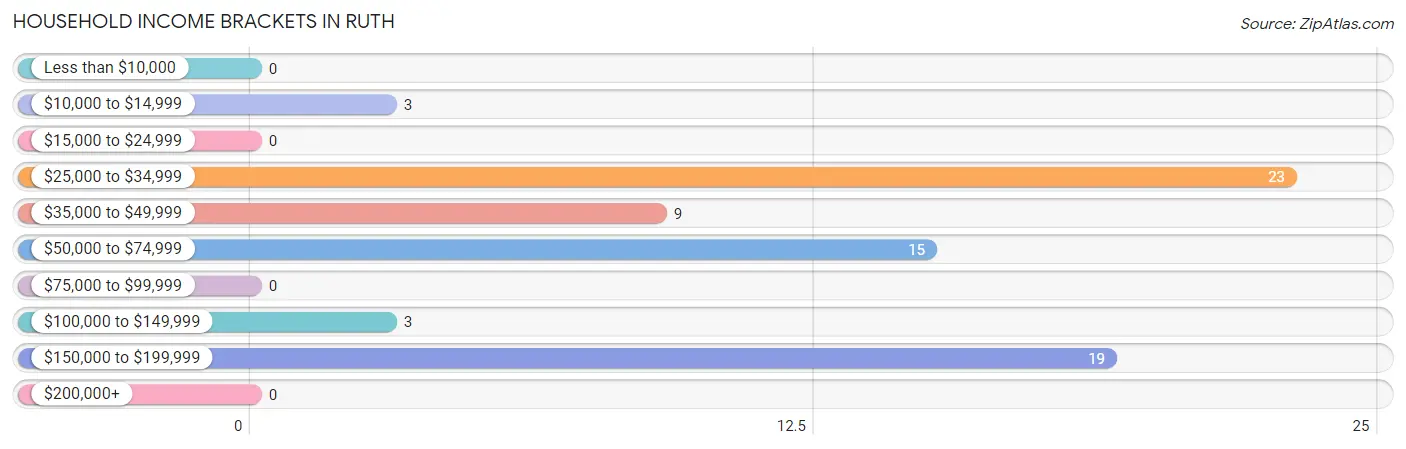
| Income Bracket | # Households | % Households |
| Less than $10,000 | 0 | 0.0% |
| $10,000 to $14,999 | 3 | 4.2% |
| $15,000 to $24,999 | 0 | 0.0% |
| $25,000 to $34,999 | 23 | 31.9% |
| $35,000 to $49,999 | 9 | 12.5% |
| $50,000 to $74,999 | 15 | 20.8% |
| $75,000 to $99,999 | 0 | 0.0% |
| $100,000 to $149,999 | 3 | 4.2% |
| $150,000 to $199,999 | 19 | 26.4% |
| $200,000+ | 0 | 0.0% |
Household Income by Householder Age in Ruth
The median household income in Ruth is $58,333, with the highest median household income of $150,500 found in the 45 to 64 years age bracket for the primary householder. A total of 16 households (22.2%) fall into this category.
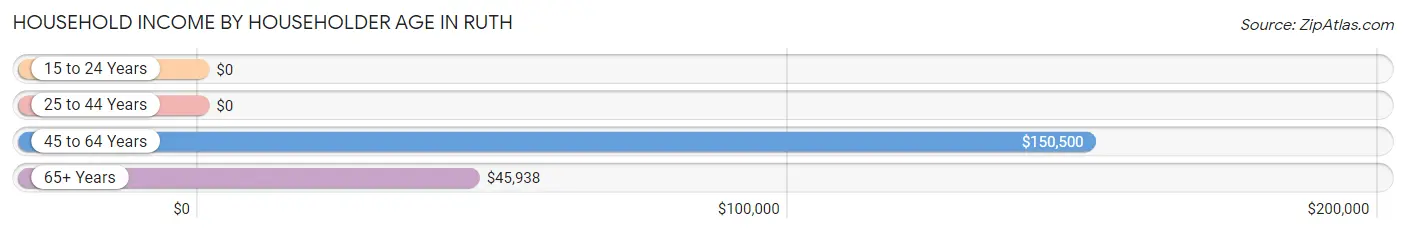
| Income Bracket | # Households | Median Income |
| 15 to 24 Years | 0 (0.0%) | $0 |
| 25 to 44 Years | 3 (4.2%) | $0 |
| 45 to 64 Years | 16 (22.2%) | $150,500 |
| 65+ Years | 53 (73.6%) | $45,938 |
| Total | 72 (100.0%) | $58,333 |
Poverty in Ruth
Income Below Poverty by Sex and Age in Ruth
With 27.3% poverty level for males and 4.8% for females among the residents of Ruth, 65 to 74 year old males and 55 to 64 year old females are the most vulnerable to poverty, with 24 males (35.3%) and 3 females (15.8%) in their respective age groups living below the poverty level.
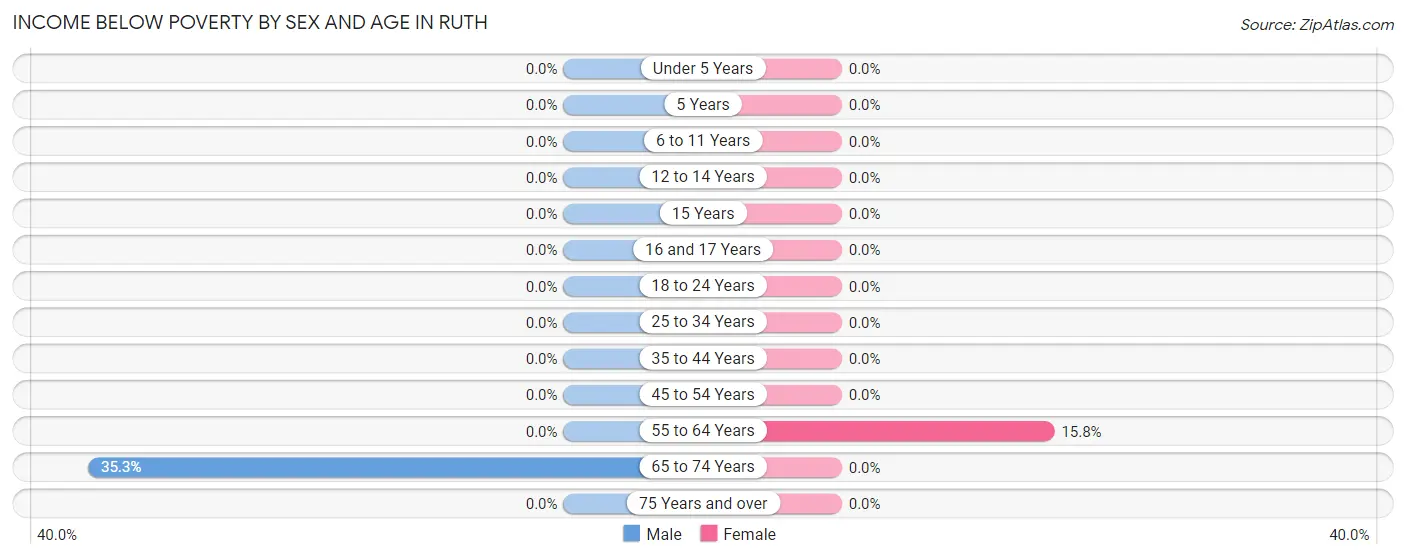
| Age Bracket | Male | Female |
| Under 5 Years | 0 (0.0%) | 0 (0.0%) |
| 5 Years | 0 (0.0%) | 0 (0.0%) |
| 6 to 11 Years | 0 (0.0%) | 0 (0.0%) |
| 12 to 14 Years | 0 (0.0%) | 0 (0.0%) |
| 15 Years | 0 (0.0%) | 0 (0.0%) |
| 16 and 17 Years | 0 (0.0%) | 0 (0.0%) |
| 18 to 24 Years | 0 (0.0%) | 0 (0.0%) |
| 25 to 34 Years | 0 (0.0%) | 0 (0.0%) |
| 35 to 44 Years | 0 (0.0%) | 0 (0.0%) |
| 45 to 54 Years | 0 (0.0%) | 0 (0.0%) |
| 55 to 64 Years | 0 (0.0%) | 3 (15.8%) |
| 65 to 74 Years | 24 (35.3%) | 0 (0.0%) |
| 75 Years and over | 0 (0.0%) | 0 (0.0%) |
| Total | 24 (27.3%) | 3 (4.8%) |
Income Above Poverty by Sex and Age in Ruth
According to the poverty statistics in Ruth, males aged 25 to 34 years and females aged 65 to 74 years are the age groups that are most secure financially, with 100.0% of males and 100.0% of females in these age groups living above the poverty line.
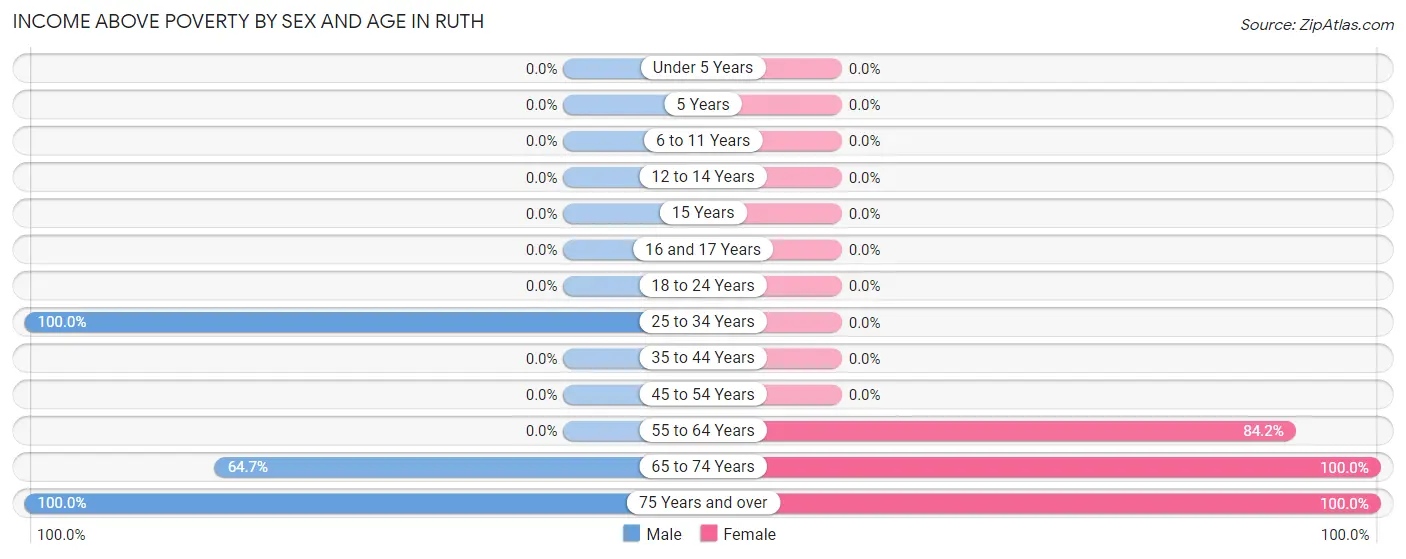
| Age Bracket | Male | Female |
| Under 5 Years | 0 (0.0%) | 0 (0.0%) |
| 5 Years | 0 (0.0%) | 0 (0.0%) |
| 6 to 11 Years | 0 (0.0%) | 0 (0.0%) |
| 12 to 14 Years | 0 (0.0%) | 0 (0.0%) |
| 15 Years | 0 (0.0%) | 0 (0.0%) |
| 16 and 17 Years | 0 (0.0%) | 0 (0.0%) |
| 18 to 24 Years | 0 (0.0%) | 0 (0.0%) |
| 25 to 34 Years | 3 (100.0%) | 0 (0.0%) |
| 35 to 44 Years | 0 (0.0%) | 0 (0.0%) |
| 45 to 54 Years | 0 (0.0%) | 0 (0.0%) |
| 55 to 64 Years | 0 (0.0%) | 16 (84.2%) |
| 65 to 74 Years | 44 (64.7%) | 34 (100.0%) |
| 75 Years and over | 17 (100.0%) | 10 (100.0%) |
| Total | 64 (72.7%) | 60 (95.2%) |
Income Below Poverty Among Married-Couple Families in Ruth
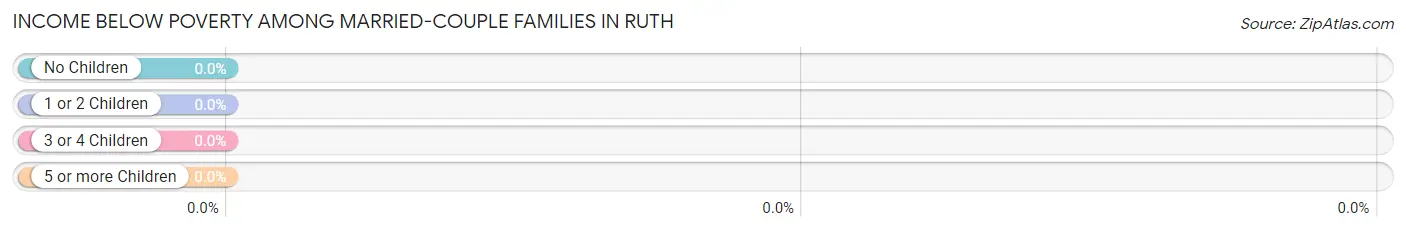
| Children | Above Poverty | Below Poverty |
| No Children | 42 (100.0%) | 0 (0.0%) |
| 1 or 2 Children | 0 (0.0%) | 0 (0.0%) |
| 3 or 4 Children | 0 (0.0%) | 0 (0.0%) |
| 5 or more Children | 0 (0.0%) | 0 (0.0%) |
| Total | 42 (100.0%) | 0 (0.0%) |
Income Below Poverty Among Single-Parent Households in Ruth
| Children | Single Father | Single Mother |
| No Children | 0 (0.0%) | 0 (0.0%) |
| 1 or 2 Children | 0 (0.0%) | 0 (0.0%) |
| 3 or 4 Children | 0 (0.0%) | 0 (0.0%) |
| 5 or more Children | 0 (0.0%) | 0 (0.0%) |
| Total | 0 (0.0%) | 0 (0.0%) |
Income Below Poverty Among Married-Couple vs Single-Parent Households in Ruth
| Children | Married-Couple Families | Single-Parent Households |
| No Children | 0 (0.0%) | 0 (0.0%) |
| 1 or 2 Children | 0 (0.0%) | 0 (0.0%) |
| 3 or 4 Children | 0 (0.0%) | 0 (0.0%) |
| 5 or more Children | 0 (0.0%) | 0 (0.0%) |
| Total | 0 (0.0%) | 0 (0.0%) |
Race in Ruth
The most populous races in Ruth are , and White / Caucasian (151 | 100.0%).
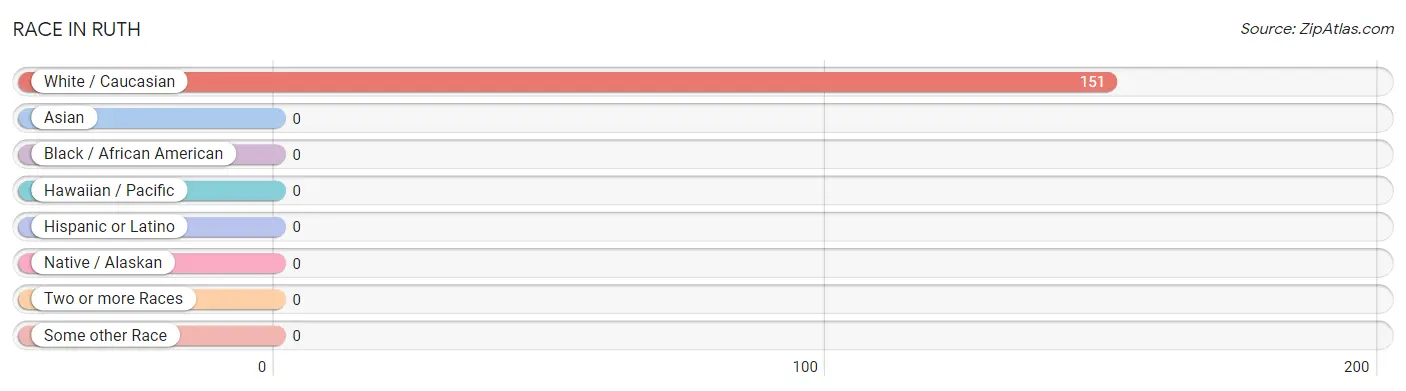
| Race | # Population | % Population |
| Asian | 0 | 0.0% |
| Black / African American | 0 | 0.0% |
| Hawaiian / Pacific | 0 | 0.0% |
| Hispanic or Latino | 0 | 0.0% |
| Native / Alaskan | 0 | 0.0% |
| White / Caucasian | 151 | 100.0% |
| Two or more Races | 0 | 0.0% |
| Some other Race | 0 | 0.0% |
| Total | 151 | 100.0% |
Ancestry in Ruth
The most populous ancestries reported in Ruth are English (44 | 29.1%), American (39 | 25.8%), Italian (18 | 11.9%), German (15 | 9.9%), and Scottish (15 | 9.9%), together accounting for 86.7% of all Ruth residents.
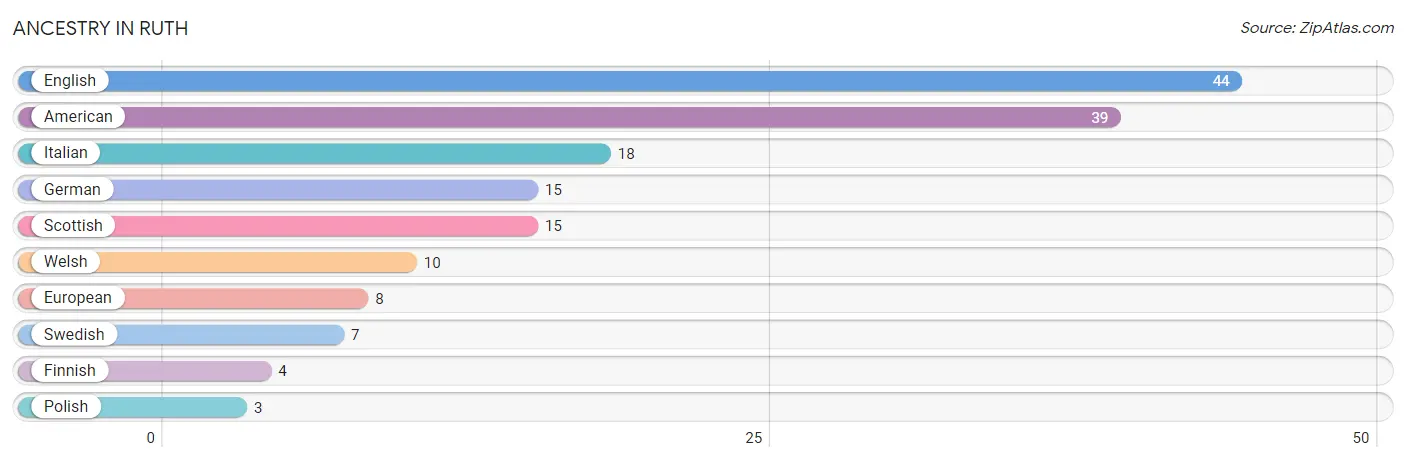
| Ancestry | # Population | % Population |
| American | 39 | 25.8% |
| English | 44 | 29.1% |
| European | 8 | 5.3% |
| Finnish | 4 | 2.6% |
| German | 15 | 9.9% |
| Italian | 18 | 11.9% |
| Polish | 3 | 2.0% |
| Scottish | 15 | 9.9% |
| Swedish | 7 | 4.6% |
| Welsh | 10 | 6.6% | View All 10 Rows |
Immigrants in Ruth
The most numerous immigrant groups reported in Ruth came from Europe (5 | 3.3%), Netherlands (5 | 3.3%), and Western Europe (5 | 3.3%), together accounting for 9.9% of all Ruth residents.
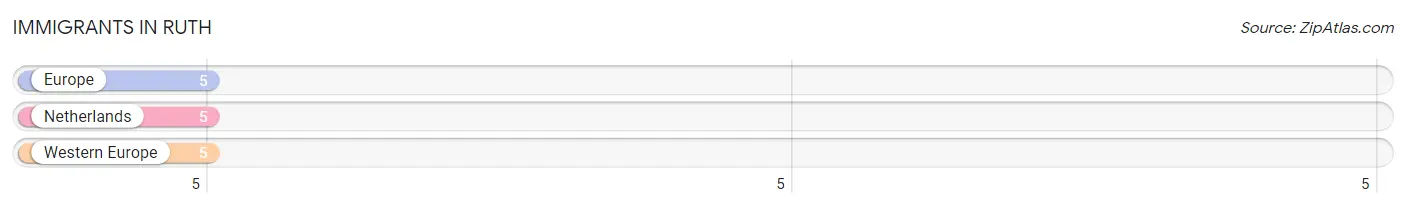
| Immigration Origin | # Population | % Population |
| Europe | 5 | 3.3% |
| Netherlands | 5 | 3.3% |
| Western Europe | 5 | 3.3% | View All 3 Rows |
Sex and Age in Ruth
Sex and Age in Ruth
The most populous age groups in Ruth are 65 to 69 Years (44 | 50.0%) for men and 70 to 74 Years (34 | 54.0%) for women.
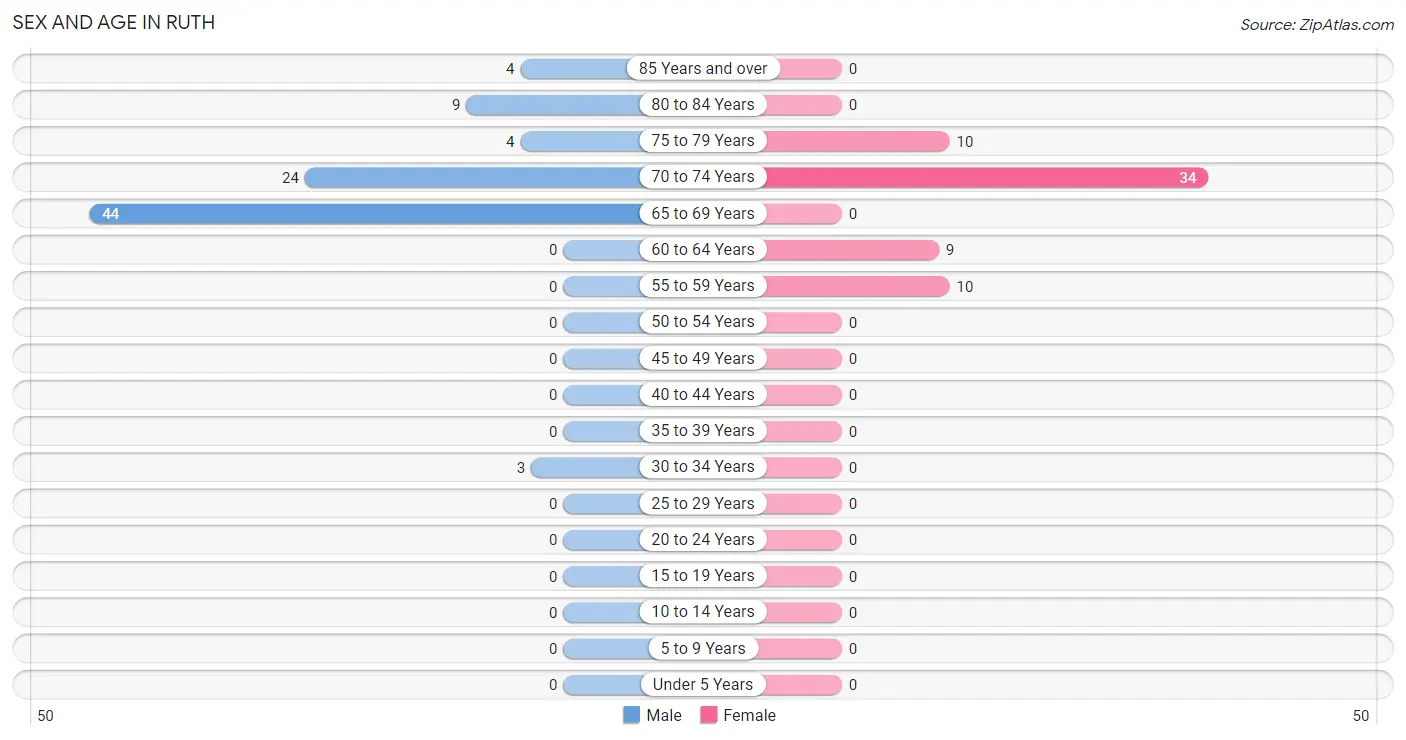
| Age Bracket | Male | Female |
| Under 5 Years | 0 (0.0%) | 0 (0.0%) |
| 5 to 9 Years | 0 (0.0%) | 0 (0.0%) |
| 10 to 14 Years | 0 (0.0%) | 0 (0.0%) |
| 15 to 19 Years | 0 (0.0%) | 0 (0.0%) |
| 20 to 24 Years | 0 (0.0%) | 0 (0.0%) |
| 25 to 29 Years | 0 (0.0%) | 0 (0.0%) |
| 30 to 34 Years | 3 (3.4%) | 0 (0.0%) |
| 35 to 39 Years | 0 (0.0%) | 0 (0.0%) |
| 40 to 44 Years | 0 (0.0%) | 0 (0.0%) |
| 45 to 49 Years | 0 (0.0%) | 0 (0.0%) |
| 50 to 54 Years | 0 (0.0%) | 0 (0.0%) |
| 55 to 59 Years | 0 (0.0%) | 10 (15.9%) |
| 60 to 64 Years | 0 (0.0%) | 9 (14.3%) |
| 65 to 69 Years | 44 (50.0%) | 0 (0.0%) |
| 70 to 74 Years | 24 (27.3%) | 34 (54.0%) |
| 75 to 79 Years | 4 (4.5%) | 10 (15.9%) |
| 80 to 84 Years | 9 (10.2%) | 0 (0.0%) |
| 85 Years and over | 4 (4.5%) | 0 (0.0%) |
| Total | 88 (100.0%) | 63 (100.0%) |
Families and Households in Ruth
Median Family Size in Ruth
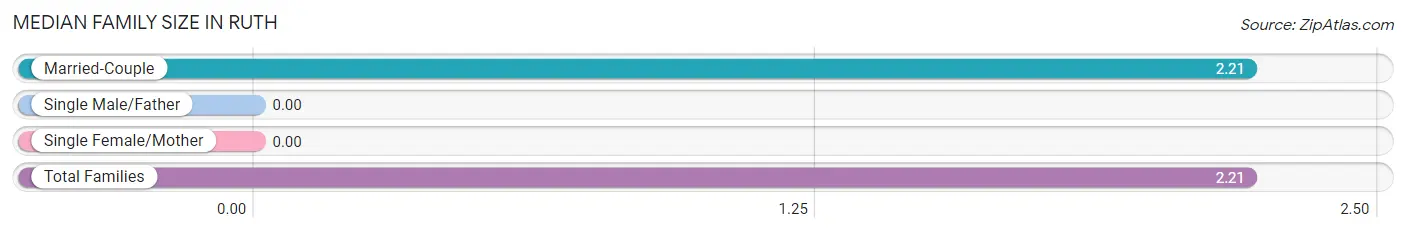
| Family Type | # Families | Family Size |
| Married-Couple | 42 (100.0%) | 2.21 |
| Single Male/Father | 0 (0.0%) | - |
| Single Female/Mother | 0 (0.0%) | - |
| Total Families | 42 (100.0%) | 2.21 |
Median Household Size in Ruth
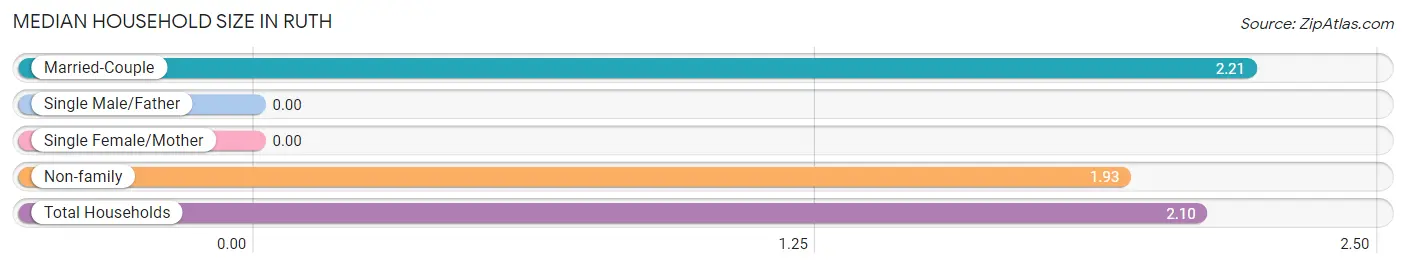
| Household Type | # Households | Household Size |
| Married-Couple | 42 (58.3%) | 2.21 |
| Single Male/Father | 0 (0.0%) | - |
| Single Female/Mother | 0 (0.0%) | - |
| Non-family | 30 (41.7%) | 1.93 |
| Total Households | 72 (100.0%) | 2.10 |
Household Size by Marriage Status in Ruth
Out of a total of 72 households in Ruth, 42 (58.3%) are family households, while 30 (41.7%) are nonfamily households. The most numerous type of family households are 2-person households, comprising 42, and the most common type of nonfamily households are 1-person households, comprising 23.
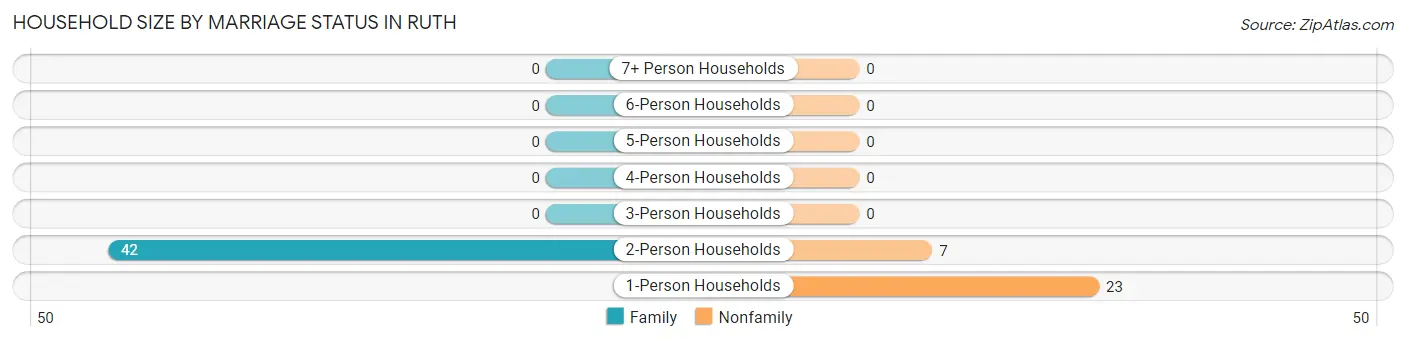
| Household Size | Family Households | Nonfamily Households |
| 1-Person Households | - | 23 (31.9%) |
| 2-Person Households | 42 (58.3%) | 7 (9.7%) |
| 3-Person Households | 0 (0.0%) | 0 (0.0%) |
| 4-Person Households | 0 (0.0%) | 0 (0.0%) |
| 5-Person Households | 0 (0.0%) | 0 (0.0%) |
| 6-Person Households | 0 (0.0%) | 0 (0.0%) |
| 7+ Person Households | 0 (0.0%) | 0 (0.0%) |
| Total | 42 (58.3%) | 30 (41.7%) |
Female Fertility in Ruth
Fertility by Age in Ruth
| Age Bracket | Women with Births | Births / 1,000 Women |
| 15 to 19 years | 0 (0.0%) | 0.0 |
| 20 to 34 years | 0 (0.0%) | 0.0 |
| 35 to 50 years | 0 (0.0%) | 0.0 |
| Total | 0 (0.0%) | 0.0 |
Fertility by Age by Marriage Status in Ruth
| Age Bracket | Married | Unmarried |
| 15 to 19 years | 0 (0.0%) | 0 (0.0%) |
| 20 to 34 years | 0 (0.0%) | 0 (0.0%) |
| 35 to 50 years | 0 (0.0%) | 0 (0.0%) |
| Total | 0 (0.0%) | 0 (0.0%) |
Fertility by Education in Ruth
| Educational Attainment | Women with Births | Births / 1,000 Women |
| Less than High School | 0 (0.0%) | 0.0 |
| High School Diploma | 0 (0.0%) | 0.0 |
| College or Associate's Degree | 0 (0.0%) | 0.0 |
| Bachelor's Degree | 0 (0.0%) | 0.0 |
| Graduate Degree | 0 (0.0%) | 0.0 |
| Total | 0 (0.0%) | 0.0 |
Fertility by Education by Marriage Status in Ruth
| Educational Attainment | Married | Unmarried |
| Less than High School | 0 (0.0%) | 0 (0.0%) |
| High School Diploma | 0 (0.0%) | 0 (0.0%) |
| College or Associate's Degree | 0 (0.0%) | 0 (0.0%) |
| Bachelor's Degree | 0 (0.0%) | 0 (0.0%) |
| Graduate Degree | 0 (0.0%) | 0 (0.0%) |
| Total | 0 (0.0%) | 0 (0.0%) |
Employment Characteristics in Ruth
Employment by Class of Employer in Ruth
Among the 28 employed individuals in Ruth, local government employees (13 | 46.4%), private company employees (12 | 42.9%), and self-employed (not incorporated) (3 | 10.7%) make up the most common classes of employment.
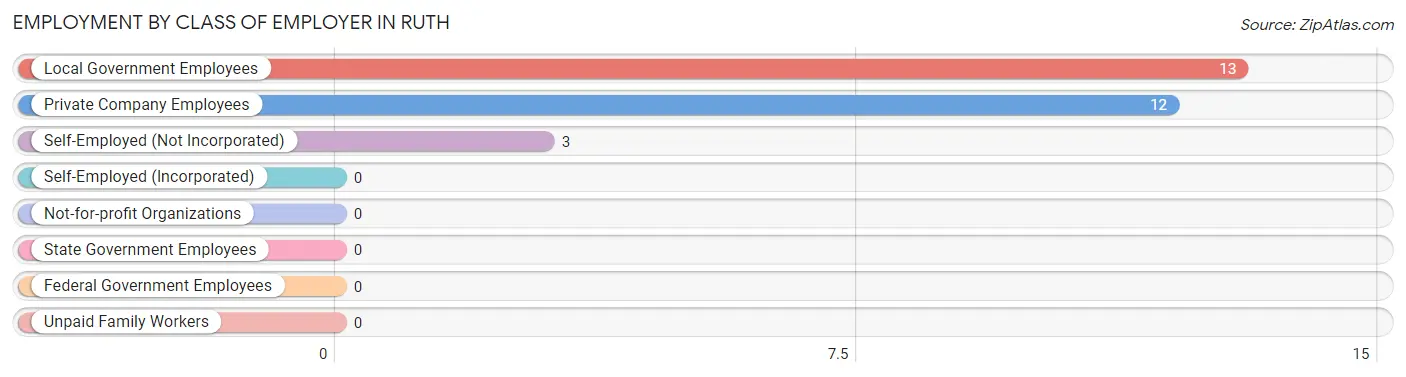
| Employer Class | # Employees | % Employees |
| Private Company Employees | 12 | 42.9% |
| Self-Employed (Incorporated) | 0 | 0.0% |
| Self-Employed (Not Incorporated) | 3 | 10.7% |
| Not-for-profit Organizations | 0 | 0.0% |
| Local Government Employees | 13 | 46.4% |
| State Government Employees | 0 | 0.0% |
| Federal Government Employees | 0 | 0.0% |
| Unpaid Family Workers | 0 | 0.0% |
| Total | 28 | 100.0% |
Employment Status by Age in Ruth
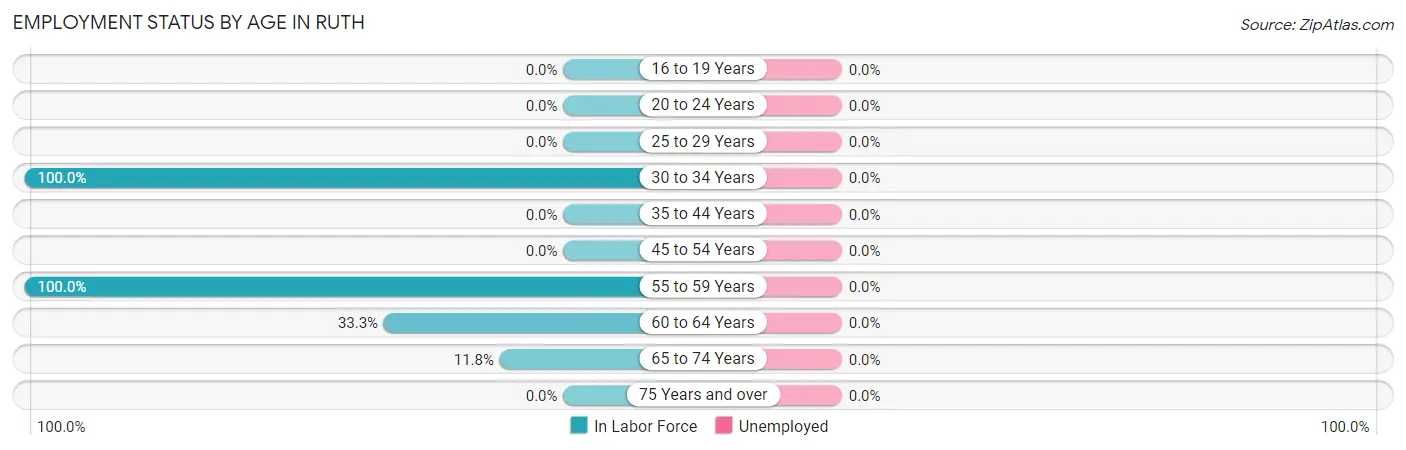
| Age Bracket | In Labor Force | Unemployed |
| 16 to 19 Years | 0 (0.0%) | 0 (0.0%) |
| 20 to 24 Years | 0 (0.0%) | 0 (0.0%) |
| 25 to 29 Years | 0 (0.0%) | 0 (0.0%) |
| 30 to 34 Years | 3 (100.0%) | 0 (0.0%) |
| 35 to 44 Years | 0 (0.0%) | 0 (0.0%) |
| 45 to 54 Years | 0 (0.0%) | 0 (0.0%) |
| 55 to 59 Years | 10 (100.0%) | 0 (0.0%) |
| 60 to 64 Years | 3 (33.3%) | 0 (0.0%) |
| 65 to 74 Years | 12 (11.8%) | 0 (0.0%) |
| 75 Years and over | 0 (0.0%) | 0 (0.0%) |
| Total | 28 (18.5%) | 0 (0.0%) |
Employment Status by Educational Attainment in Ruth
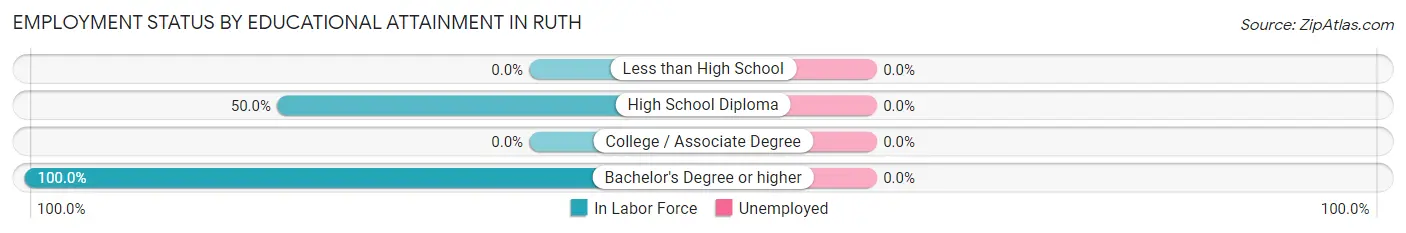
| Educational Attainment | In Labor Force | Unemployed |
| Less than High School | 0 (0.0%) | 0 (0.0%) |
| High School Diploma | 3 (50.0%) | 0 (0.0%) |
| College / Associate Degree | 0 (0.0%) | 0 (0.0%) |
| Bachelor's Degree or higher | 13 (100.0%) | 0 (0.0%) |
| Total | 16 (72.7%) | 0 (0.0%) |
Employment Occupations by Sex in Ruth
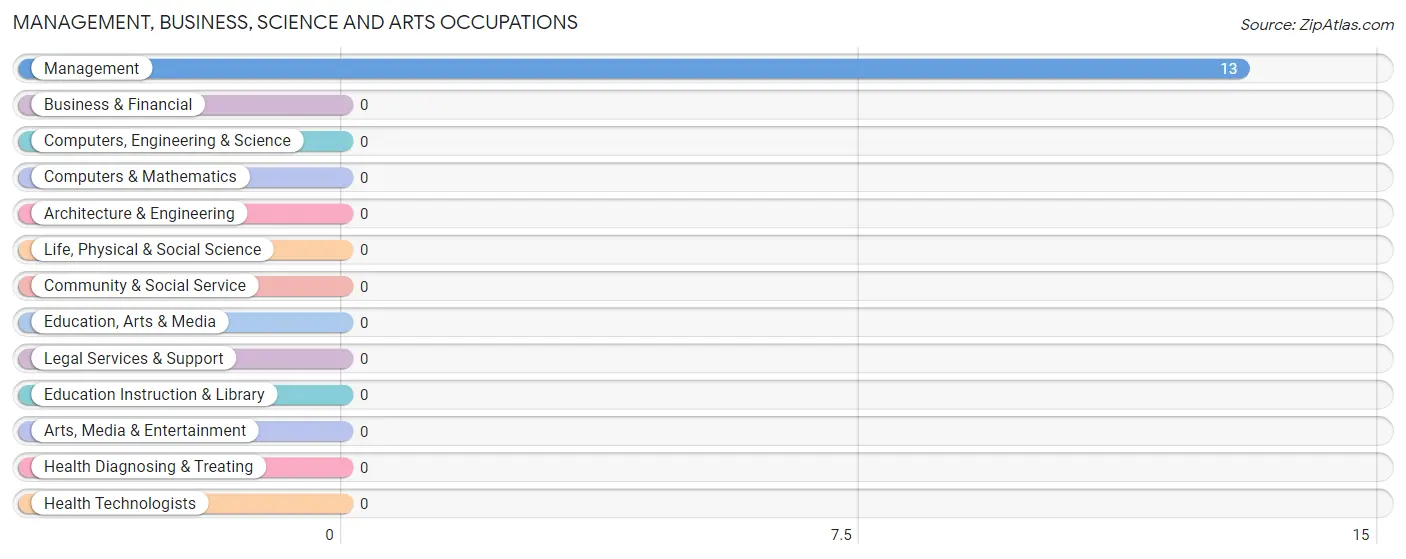
Management, Business, Science and Arts Occupations
The most common Management, Business, Science and Arts occupations in Ruth are , and Management (13 | 46.4%).
Management, Business, Science and Arts Occupations by Sex
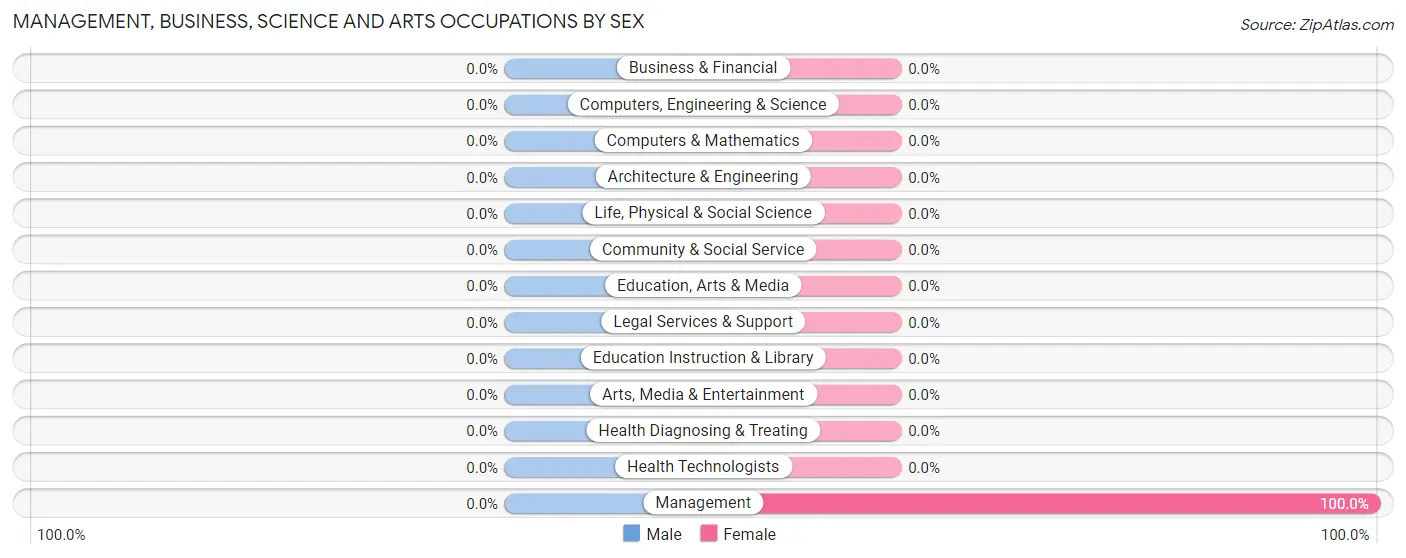
| Occupation | Male | Female |
| Management | 0 (0.0%) | 13 (100.0%) |
| Business & Financial | 0 (0.0%) | 0 (0.0%) |
| Computers, Engineering & Science | 0 (0.0%) | 0 (0.0%) |
| Computers & Mathematics | 0 (0.0%) | 0 (0.0%) |
| Architecture & Engineering | 0 (0.0%) | 0 (0.0%) |
| Life, Physical & Social Science | 0 (0.0%) | 0 (0.0%) |
| Community & Social Service | 0 (0.0%) | 0 (0.0%) |
| Education, Arts & Media | 0 (0.0%) | 0 (0.0%) |
| Legal Services & Support | 0 (0.0%) | 0 (0.0%) |
| Education Instruction & Library | 0 (0.0%) | 0 (0.0%) |
| Arts, Media & Entertainment | 0 (0.0%) | 0 (0.0%) |
| Health Diagnosing & Treating | 0 (0.0%) | 0 (0.0%) |
| Health Technologists | 0 (0.0%) | 0 (0.0%) |
| Total (Category) | 0 (0.0%) | 13 (100.0%) |
| Total (Overall) | 3 (10.7%) | 25 (89.3%) |
Services Occupations
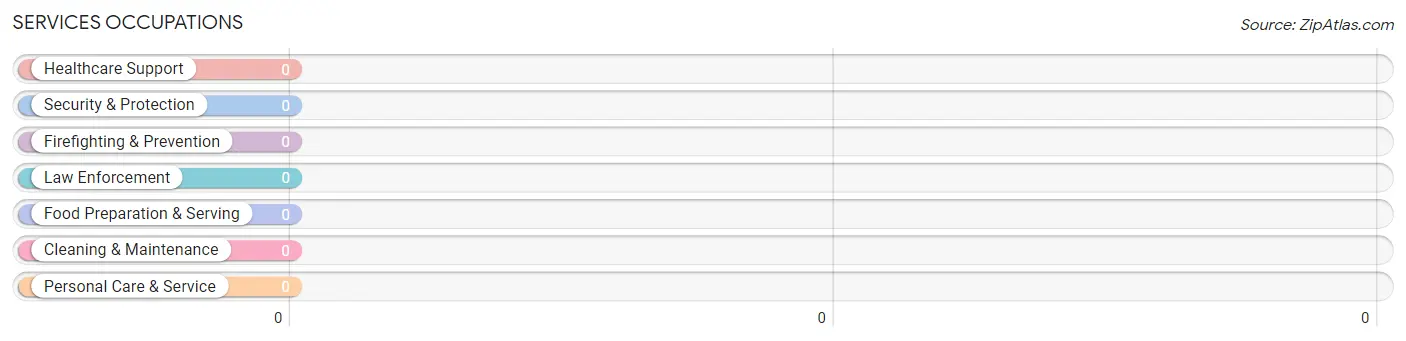
Services Occupations by Sex
| Occupation | Male | Female |
| Healthcare Support | 0 (0.0%) | 0 (0.0%) |
| Security & Protection | 0 (0.0%) | 0 (0.0%) |
| Firefighting & Prevention | 0 (0.0%) | 0 (0.0%) |
| Law Enforcement | 0 (0.0%) | 0 (0.0%) |
| Food Preparation & Serving | 0 (0.0%) | 0 (0.0%) |
| Cleaning & Maintenance | 0 (0.0%) | 0 (0.0%) |
| Personal Care & Service | 0 (0.0%) | 0 (0.0%) |
| Total (Category) | 0 (0.0%) | 0 (0.0%) |
| Total (Overall) | 3 (10.7%) | 25 (89.3%) |
Sales and Office Occupations
The most common Sales and Office occupations in Ruth are , and Sales & Related (12 | 42.9%).
Sales and Office Occupations by Sex

| Occupation | Male | Female |
| Sales & Related | 0 (0.0%) | 12 (100.0%) |
| Office & Administration | 0 (0.0%) | 0 (0.0%) |
| Total (Category) | 0 (0.0%) | 12 (100.0%) |
| Total (Overall) | 3 (10.7%) | 25 (89.3%) |
Natural Resources, Construction and Maintenance Occupations
The most common Natural Resources, Construction and Maintenance occupations in Ruth are , and Construction & Extraction (3 | 10.7%).
Natural Resources, Construction and Maintenance Occupations by Sex
| Occupation | Male | Female |
| Farming, Fishing & Forestry | 0 (0.0%) | 0 (0.0%) |
| Construction & Extraction | 3 (100.0%) | 0 (0.0%) |
| Installation, Maintenance & Repair | 0 (0.0%) | 0 (0.0%) |
| Total (Category) | 3 (100.0%) | 0 (0.0%) |
| Total (Overall) | 3 (10.7%) | 25 (89.3%) |
Production, Transportation and Moving Occupations
Production, Transportation and Moving Occupations by Sex
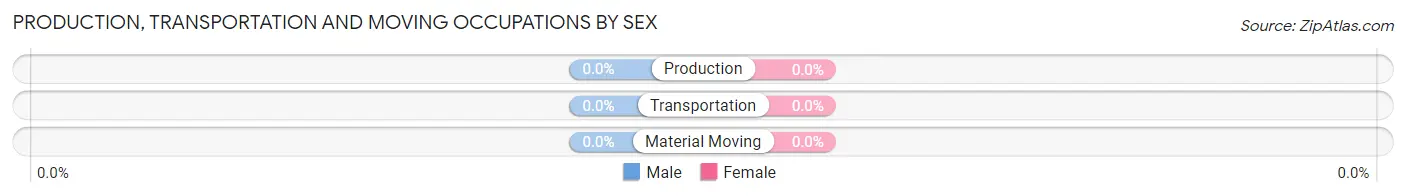
| Occupation | Male | Female |
| Production | 0 (0.0%) | 0 (0.0%) |
| Transportation | 0 (0.0%) | 0 (0.0%) |
| Material Moving | 0 (0.0%) | 0 (0.0%) |
| Total (Category) | 0 (0.0%) | 0 (0.0%) |
| Total (Overall) | 3 (10.7%) | 25 (89.3%) |
Employment Industries by Sex in Ruth
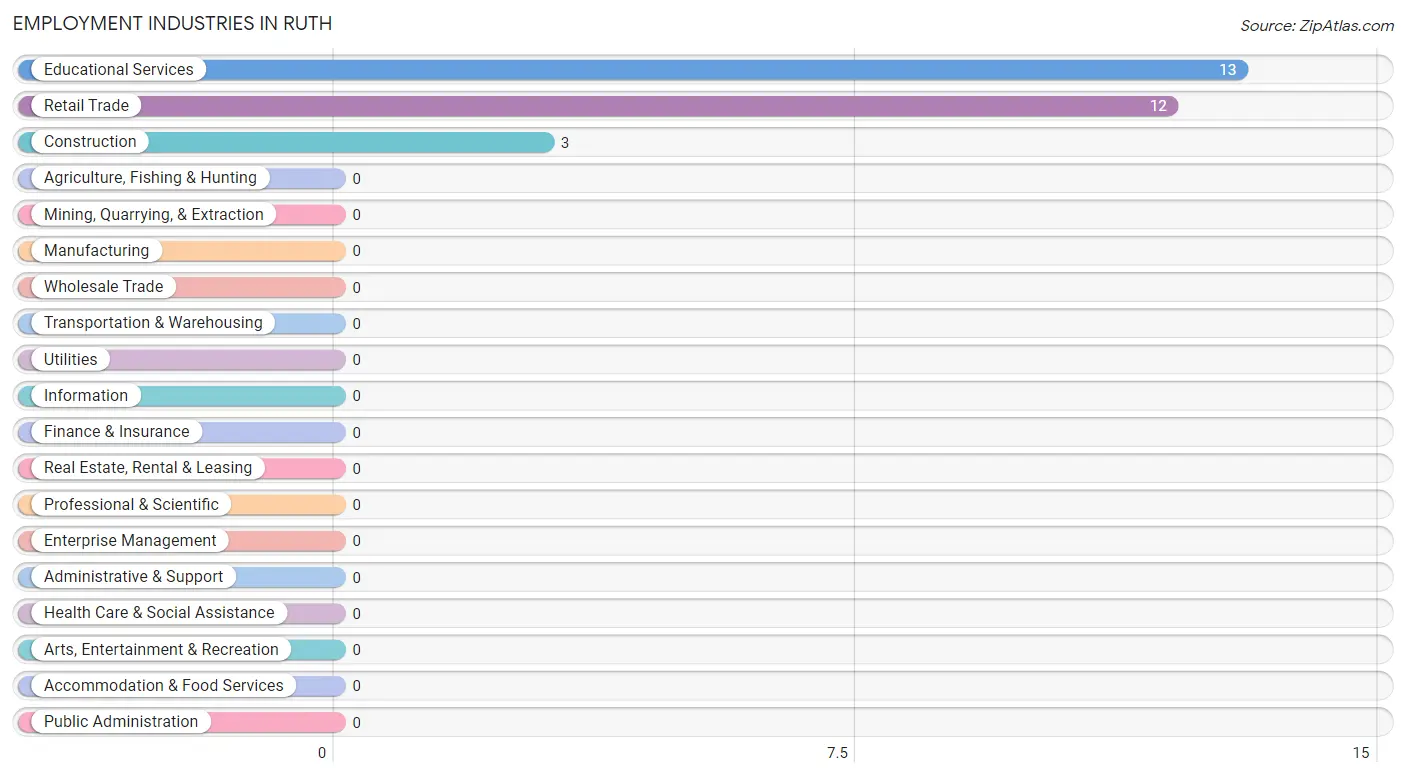
Employment Industries in Ruth
The major employment industries in Ruth include Educational Services (13 | 46.4%), Retail Trade (12 | 42.9%), and Construction (3 | 10.7%).
Employment Industries by Sex in Ruth
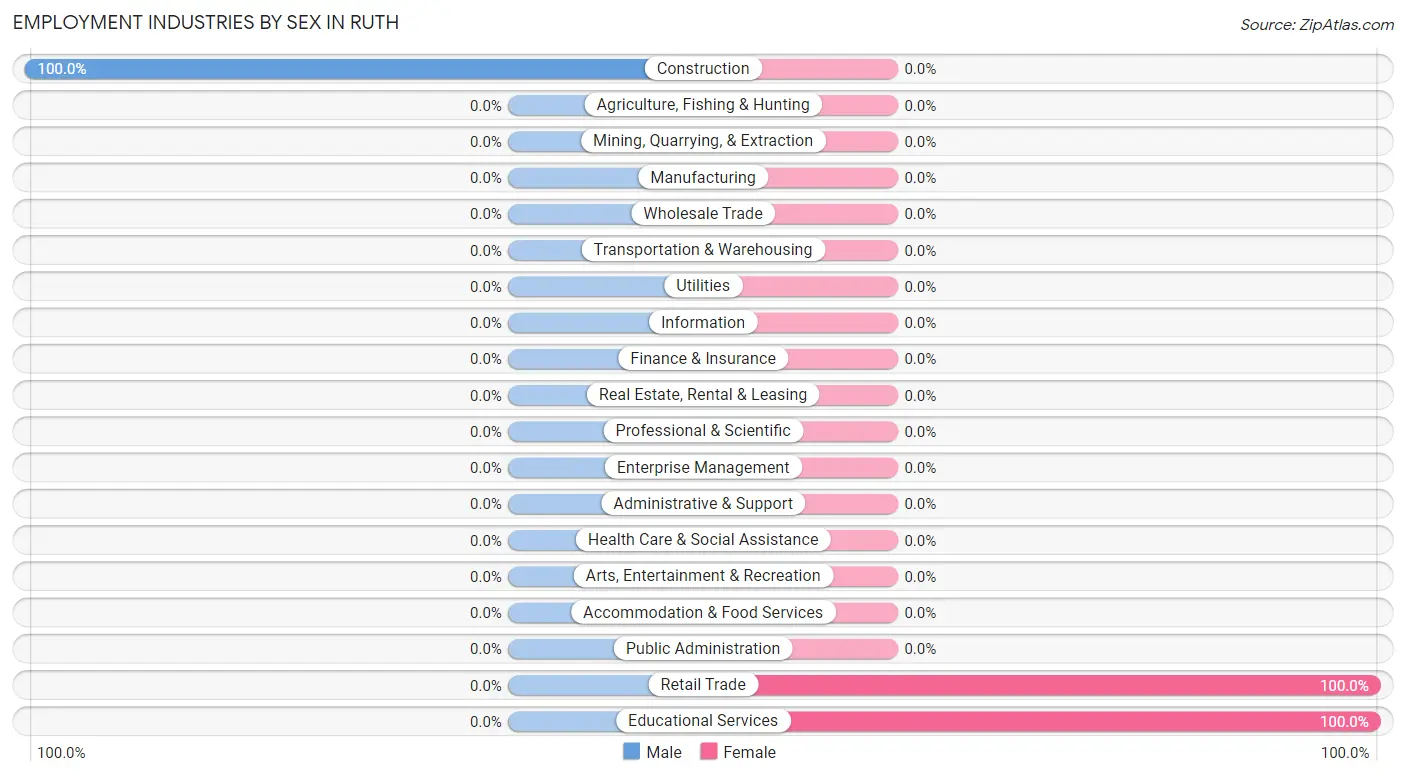
| Industry | Male | Female |
| Agriculture, Fishing & Hunting | 0 (0.0%) | 0 (0.0%) |
| Mining, Quarrying, & Extraction | 0 (0.0%) | 0 (0.0%) |
| Construction | 3 (100.0%) | 0 (0.0%) |
| Manufacturing | 0 (0.0%) | 0 (0.0%) |
| Wholesale Trade | 0 (0.0%) | 0 (0.0%) |
| Retail Trade | 0 (0.0%) | 12 (100.0%) |
| Transportation & Warehousing | 0 (0.0%) | 0 (0.0%) |
| Utilities | 0 (0.0%) | 0 (0.0%) |
| Information | 0 (0.0%) | 0 (0.0%) |
| Finance & Insurance | 0 (0.0%) | 0 (0.0%) |
| Real Estate, Rental & Leasing | 0 (0.0%) | 0 (0.0%) |
| Professional & Scientific | 0 (0.0%) | 0 (0.0%) |
| Enterprise Management | 0 (0.0%) | 0 (0.0%) |
| Administrative & Support | 0 (0.0%) | 0 (0.0%) |
| Educational Services | 0 (0.0%) | 13 (100.0%) |
| Health Care & Social Assistance | 0 (0.0%) | 0 (0.0%) |
| Arts, Entertainment & Recreation | 0 (0.0%) | 0 (0.0%) |
| Accommodation & Food Services | 0 (0.0%) | 0 (0.0%) |
| Public Administration | 0 (0.0%) | 0 (0.0%) |
| Total | 3 (10.7%) | 25 (89.3%) |
Education in Ruth
School Enrollment in Ruth
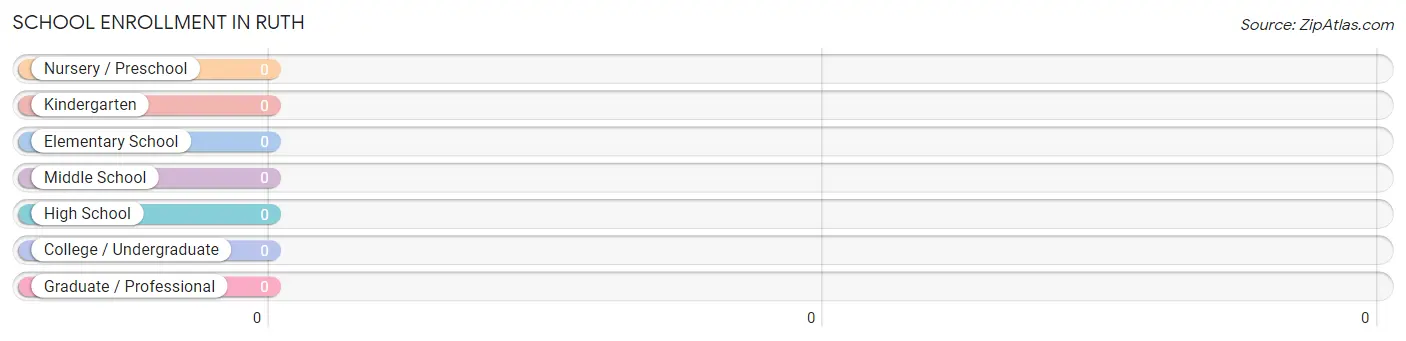
| School Level | # Students | % Students |
| Nursery / Preschool | 0 | 0.0% |
| Kindergarten | 0 | 0.0% |
| Elementary School | 0 | 0.0% |
| Middle School | 0 | 0.0% |
| High School | 0 | 0.0% |
| College / Undergraduate | 0 | 0.0% |
| Graduate / Professional | 0 | 0.0% |
| Total | 0 | 0.0% |
School Enrollment by Age by Funding Source in Ruth
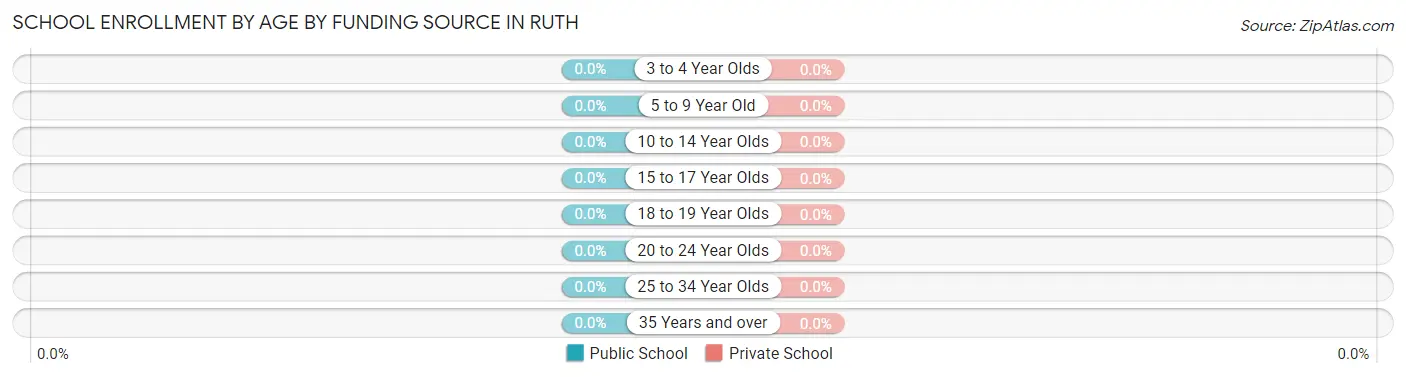
| Age Bracket | Public School | Private School |
| 3 to 4 Year Olds | 0 (0.0%) | 0 (0.0%) |
| 5 to 9 Year Old | 0 (0.0%) | 0 (0.0%) |
| 10 to 14 Year Olds | 0 (0.0%) | 0 (0.0%) |
| 15 to 17 Year Olds | 0 (0.0%) | 0 (0.0%) |
| 18 to 19 Year Olds | 0 (0.0%) | 0 (0.0%) |
| 20 to 24 Year Olds | 0 (0.0%) | 0 (0.0%) |
| 25 to 34 Year Olds | 0 (0.0%) | 0 (0.0%) |
| 35 Years and over | 0 (0.0%) | 0 (0.0%) |
| Total | 0 (0.0%) | 0 (0.0%) |
Educational Attainment by Field of Study in Ruth
Bio, nature & agricultural (18 | 58.1%), and arts & humanities (13 | 41.9%) are the most common fields of study among 31 individuals in Ruth who have obtained a bachelor's degree or higher.
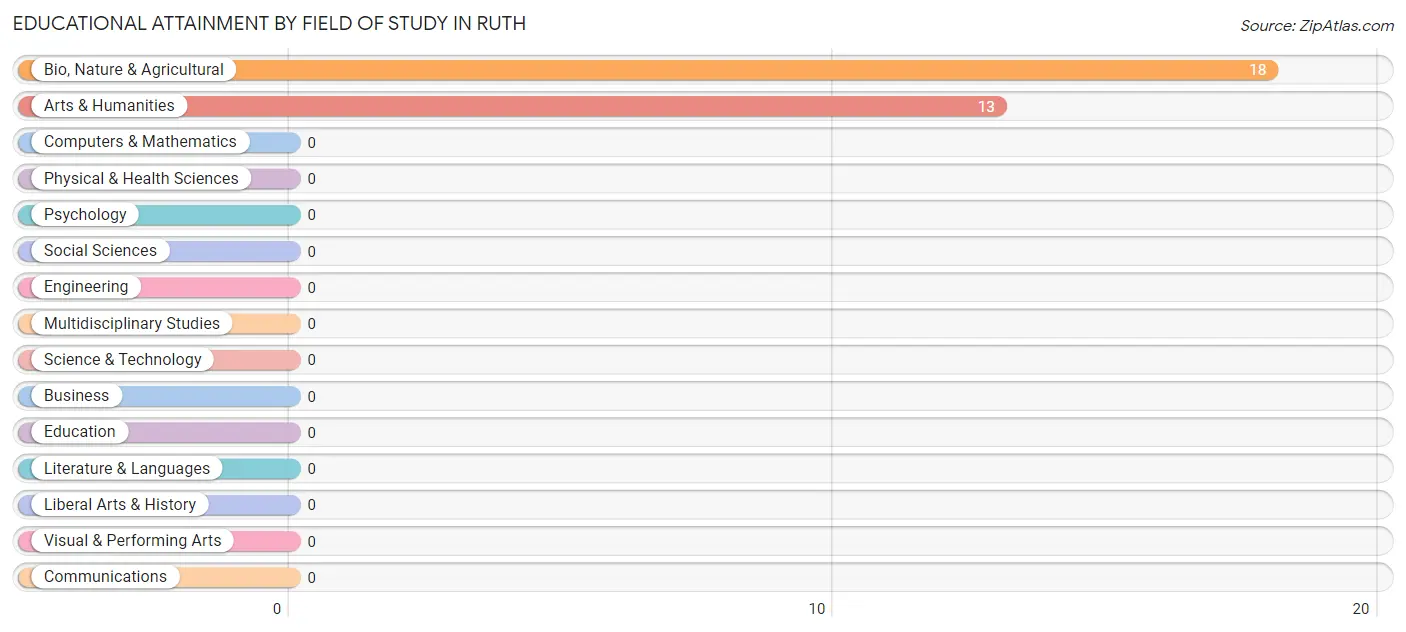
| Field of Study | # Graduates | % Graduates |
| Computers & Mathematics | 0 | 0.0% |
| Bio, Nature & Agricultural | 18 | 58.1% |
| Physical & Health Sciences | 0 | 0.0% |
| Psychology | 0 | 0.0% |
| Social Sciences | 0 | 0.0% |
| Engineering | 0 | 0.0% |
| Multidisciplinary Studies | 0 | 0.0% |
| Science & Technology | 0 | 0.0% |
| Business | 0 | 0.0% |
| Education | 0 | 0.0% |
| Literature & Languages | 0 | 0.0% |
| Liberal Arts & History | 0 | 0.0% |
| Visual & Performing Arts | 0 | 0.0% |
| Communications | 0 | 0.0% |
| Arts & Humanities | 13 | 41.9% |
| Total | 31 | 100.0% |
Transportation & Commute in Ruth
Vehicle Availability by Sex in Ruth
The most prevalent vehicle ownership categories in Ruth are males with 1 vehicle (3, accounting for 100.0%) and females with 1 vehicle (0, making up 12.0%).
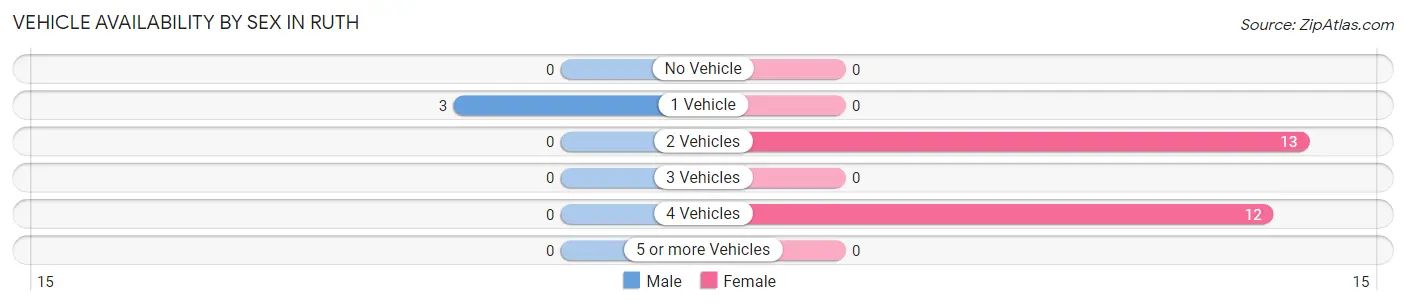
| Vehicles Available | Male | Female |
| No Vehicle | 0 (0.0%) | 0 (0.0%) |
| 1 Vehicle | 3 (100.0%) | 0 (0.0%) |
| 2 Vehicles | 0 (0.0%) | 13 (52.0%) |
| 3 Vehicles | 0 (0.0%) | 0 (0.0%) |
| 4 Vehicles | 0 (0.0%) | 12 (48.0%) |
| 5 or more Vehicles | 0 (0.0%) | 0 (0.0%) |
| Total | 3 (100.0%) | 25 (100.0%) |
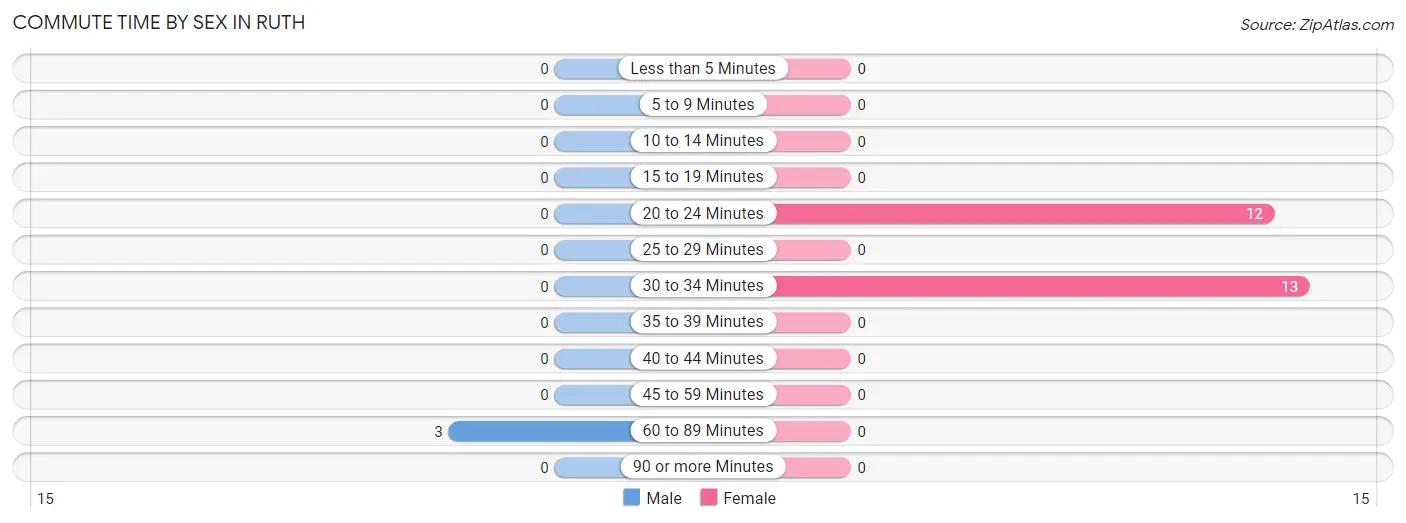
Commute Time in Ruth
The most frequently occuring commute durations in Ruth are 30 to 34 minutes (13 commuters, 46.4%), 20 to 24 minutes (12 commuters, 42.9%), and 60 to 89 minutes (3 commuters, 10.7%).
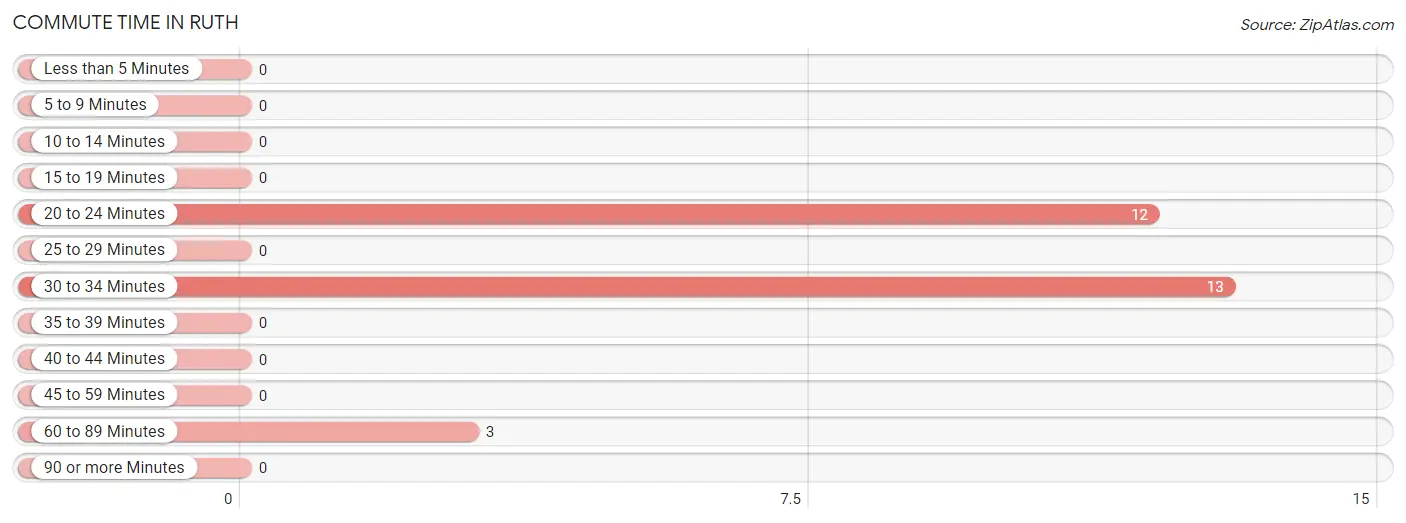
| Commute Time | # Commuters | % Commuters |
| Less than 5 Minutes | 0 | 0.0% |
| 5 to 9 Minutes | 0 | 0.0% |
| 10 to 14 Minutes | 0 | 0.0% |
| 15 to 19 Minutes | 0 | 0.0% |
| 20 to 24 Minutes | 12 | 42.9% |
| 25 to 29 Minutes | 0 | 0.0% |
| 30 to 34 Minutes | 13 | 46.4% |
| 35 to 39 Minutes | 0 | 0.0% |
| 40 to 44 Minutes | 0 | 0.0% |
| 45 to 59 Minutes | 0 | 0.0% |
| 60 to 89 Minutes | 3 | 10.7% |
| 90 or more Minutes | 0 | 0.0% |
Commute Time by Sex in Ruth
The most common commute times in Ruth are 60 to 89 minutes (3 commuters, 100.0%) for males and 30 to 34 minutes (13 commuters, 52.0%) for females.
| Commute Time | Male | Female |
| Less than 5 Minutes | 0 (0.0%) | 0 (0.0%) |
| 5 to 9 Minutes | 0 (0.0%) | 0 (0.0%) |
| 10 to 14 Minutes | 0 (0.0%) | 0 (0.0%) |
| 15 to 19 Minutes | 0 (0.0%) | 0 (0.0%) |
| 20 to 24 Minutes | 0 (0.0%) | 12 (48.0%) |
| 25 to 29 Minutes | 0 (0.0%) | 0 (0.0%) |
| 30 to 34 Minutes | 0 (0.0%) | 13 (52.0%) |
| 35 to 39 Minutes | 0 (0.0%) | 0 (0.0%) |
| 40 to 44 Minutes | 0 (0.0%) | 0 (0.0%) |
| 45 to 59 Minutes | 0 (0.0%) | 0 (0.0%) |
| 60 to 89 Minutes | 3 (100.0%) | 0 (0.0%) |
| 90 or more Minutes | 0 (0.0%) | 0 (0.0%) |
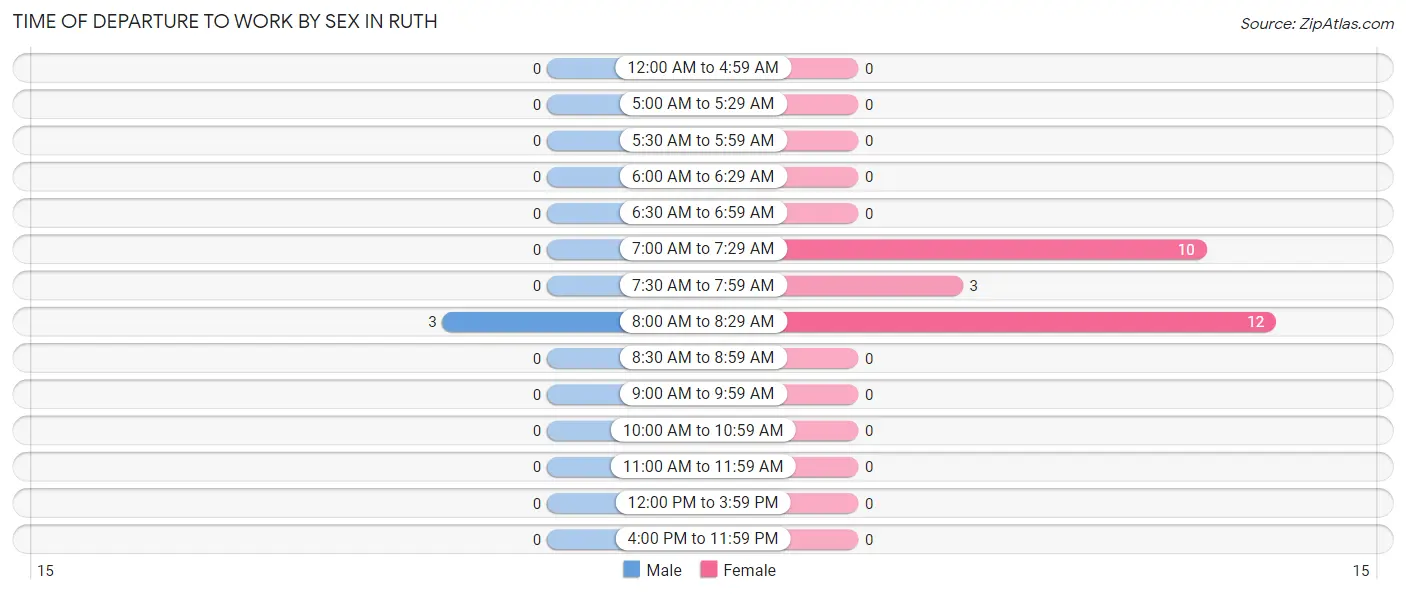
Time of Departure to Work by Sex in Ruth
The most frequent times of departure to work in Ruth are 8:00 AM to 8:29 AM (3, 100.0%) for males and 8:00 AM to 8:29 AM (12, 48.0%) for females.
| Time of Departure | Male | Female |
| 12:00 AM to 4:59 AM | 0 (0.0%) | 0 (0.0%) |
| 5:00 AM to 5:29 AM | 0 (0.0%) | 0 (0.0%) |
| 5:30 AM to 5:59 AM | 0 (0.0%) | 0 (0.0%) |
| 6:00 AM to 6:29 AM | 0 (0.0%) | 0 (0.0%) |
| 6:30 AM to 6:59 AM | 0 (0.0%) | 0 (0.0%) |
| 7:00 AM to 7:29 AM | 0 (0.0%) | 10 (40.0%) |
| 7:30 AM to 7:59 AM | 0 (0.0%) | 3 (12.0%) |
| 8:00 AM to 8:29 AM | 3 (100.0%) | 12 (48.0%) |
| 8:30 AM to 8:59 AM | 0 (0.0%) | 0 (0.0%) |
| 9:00 AM to 9:59 AM | 0 (0.0%) | 0 (0.0%) |
| 10:00 AM to 10:59 AM | 0 (0.0%) | 0 (0.0%) |
| 11:00 AM to 11:59 AM | 0 (0.0%) | 0 (0.0%) |
| 12:00 PM to 3:59 PM | 0 (0.0%) | 0 (0.0%) |
| 4:00 PM to 11:59 PM | 0 (0.0%) | 0 (0.0%) |
| Total | 3 (100.0%) | 25 (100.0%) |
Housing Occupancy in Ruth
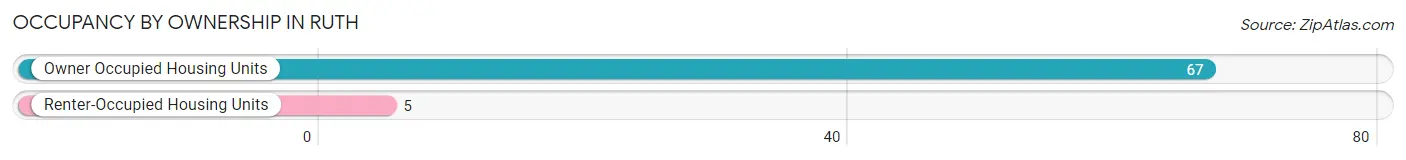
Occupancy by Ownership in Ruth
Of the total 72 dwellings in Ruth, owner-occupied units account for 67 (93.1%), while renter-occupied units make up 5 (6.9%).
| Occupancy | # Housing Units | % Housing Units |
| Owner Occupied Housing Units | 67 | 93.1% |
| Renter-Occupied Housing Units | 5 | 6.9% |
| Total Occupied Housing Units | 72 | 100.0% |
Occupancy by Household Size in Ruth
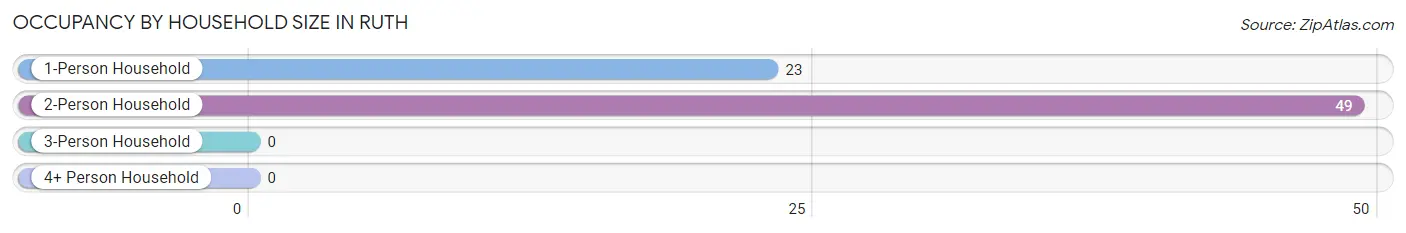
| Household Size | # Housing Units | % Housing Units |
| 1-Person Household | 23 | 31.9% |
| 2-Person Household | 49 | 68.1% |
| 3-Person Household | 0 | 0.0% |
| 4+ Person Household | 0 | 0.0% |
| Total Housing Units | 72 | 100.0% |
Occupancy by Ownership by Household Size in Ruth
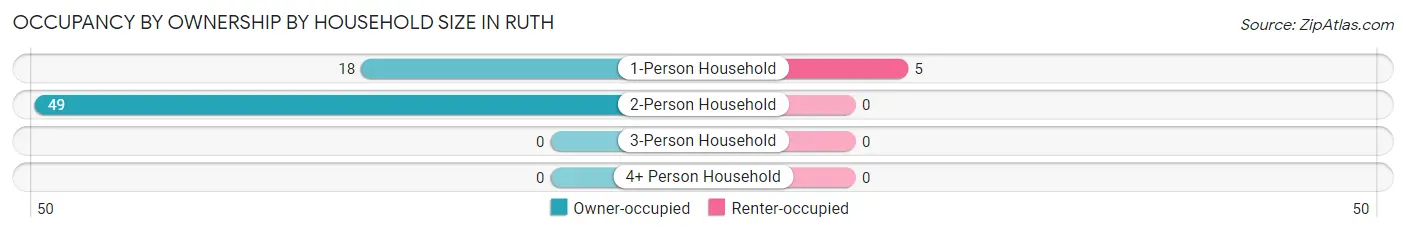
| Household Size | Owner-occupied | Renter-occupied |
| 1-Person Household | 18 (78.3%) | 5 (21.7%) |
| 2-Person Household | 49 (100.0%) | 0 (0.0%) |
| 3-Person Household | 0 (0.0%) | 0 (0.0%) |
| 4+ Person Household | 0 (0.0%) | 0 (0.0%) |
| Total Housing Units | 67 (93.1%) | 5 (6.9%) |
Occupancy by Educational Attainment in Ruth
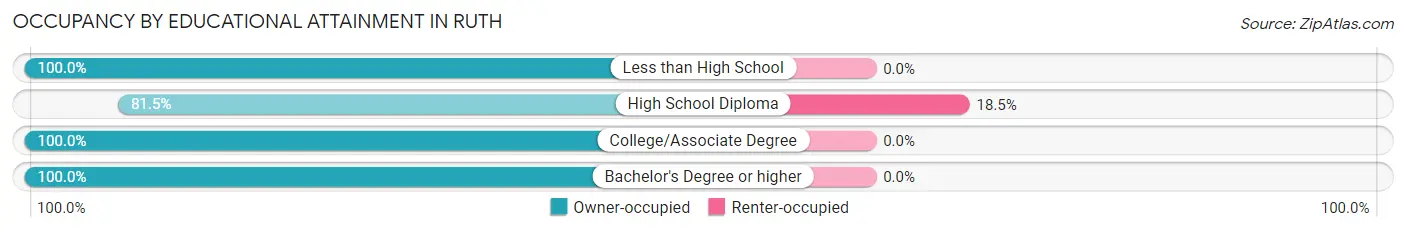
| Household Size | Owner-occupied | Renter-occupied |
| Less than High School | 3 (100.0%) | 0 (0.0%) |
| High School Diploma | 22 (81.5%) | 5 (18.5%) |
| College/Associate Degree | 29 (100.0%) | 0 (0.0%) |
| Bachelor's Degree or higher | 13 (100.0%) | 0 (0.0%) |
Occupancy by Age of Householder in Ruth
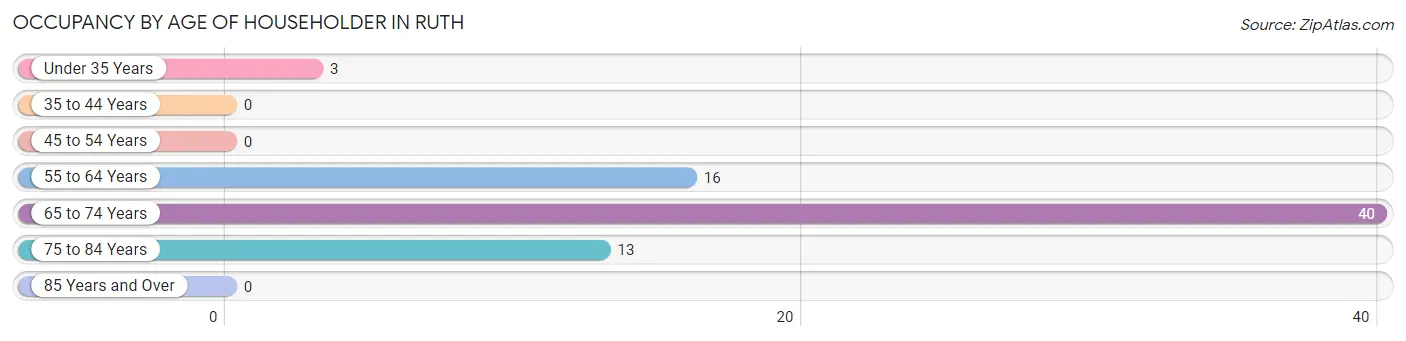
| Age Bracket | # Households | % Households |
| Under 35 Years | 3 | 4.2% |
| 35 to 44 Years | 0 | 0.0% |
| 45 to 54 Years | 0 | 0.0% |
| 55 to 64 Years | 16 | 22.2% |
| 65 to 74 Years | 40 | 55.6% |
| 75 to 84 Years | 13 | 18.1% |
| 85 Years and Over | 0 | 0.0% |
| Total | 72 | 100.0% |
Housing Finances in Ruth
Median Income by Occupancy in Ruth
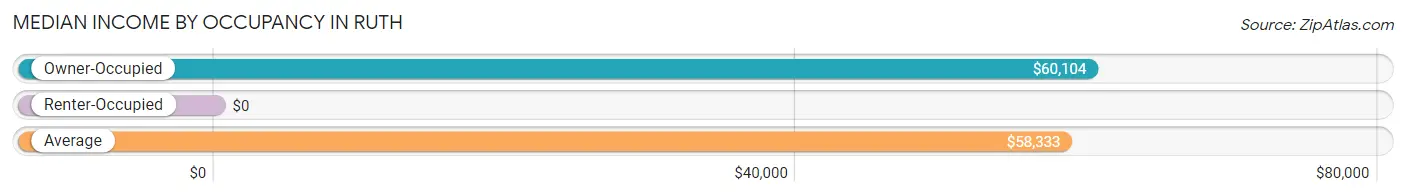
| Occupancy Type | # Households | Median Income |
| Owner-Occupied | 67 (93.1%) | $60,104 |
| Renter-Occupied | 5 (6.9%) | $0 |
| Average | 72 (100.0%) | $58,333 |
Occupancy by Householder Income Bracket in Ruth
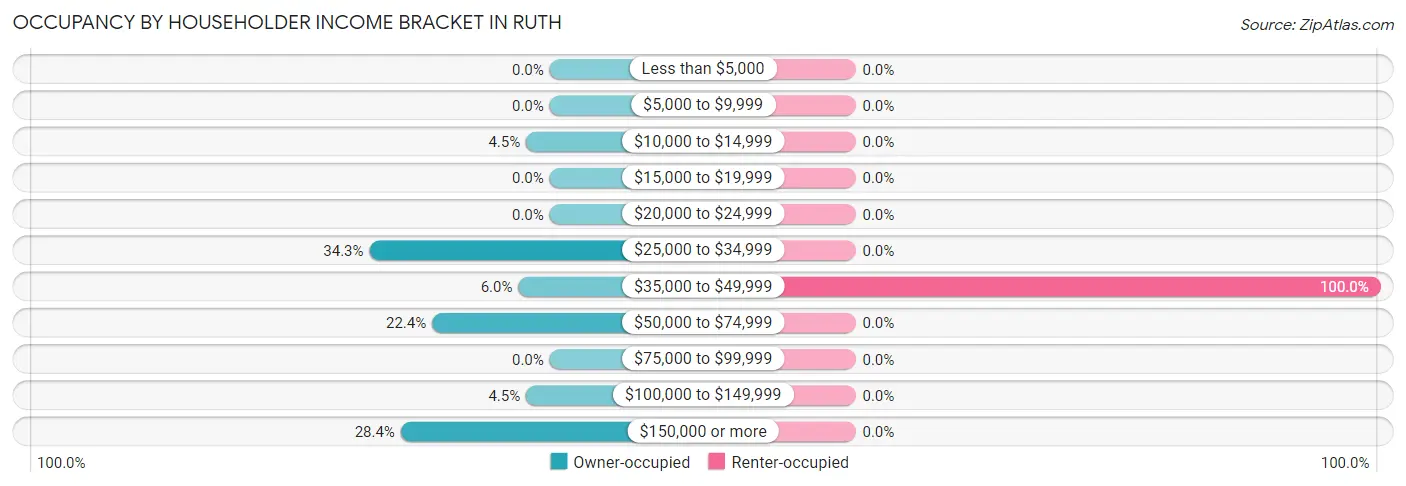
| Income Bracket | Owner-occupied | Renter-occupied |
| Less than $5,000 | 0 (0.0%) | 0 (0.0%) |
| $5,000 to $9,999 | 0 (0.0%) | 0 (0.0%) |
| $10,000 to $14,999 | 3 (4.5%) | 0 (0.0%) |
| $15,000 to $19,999 | 0 (0.0%) | 0 (0.0%) |
| $20,000 to $24,999 | 0 (0.0%) | 0 (0.0%) |
| $25,000 to $34,999 | 23 (34.3%) | 0 (0.0%) |
| $35,000 to $49,999 | 4 (6.0%) | 5 (100.0%) |
| $50,000 to $74,999 | 15 (22.4%) | 0 (0.0%) |
| $75,000 to $99,999 | 0 (0.0%) | 0 (0.0%) |
| $100,000 to $149,999 | 3 (4.5%) | 0 (0.0%) |
| $150,000 or more | 19 (28.4%) | 0 (0.0%) |
| Total | 67 (100.0%) | 5 (100.0%) |
Monthly Housing Cost Tiers in Ruth
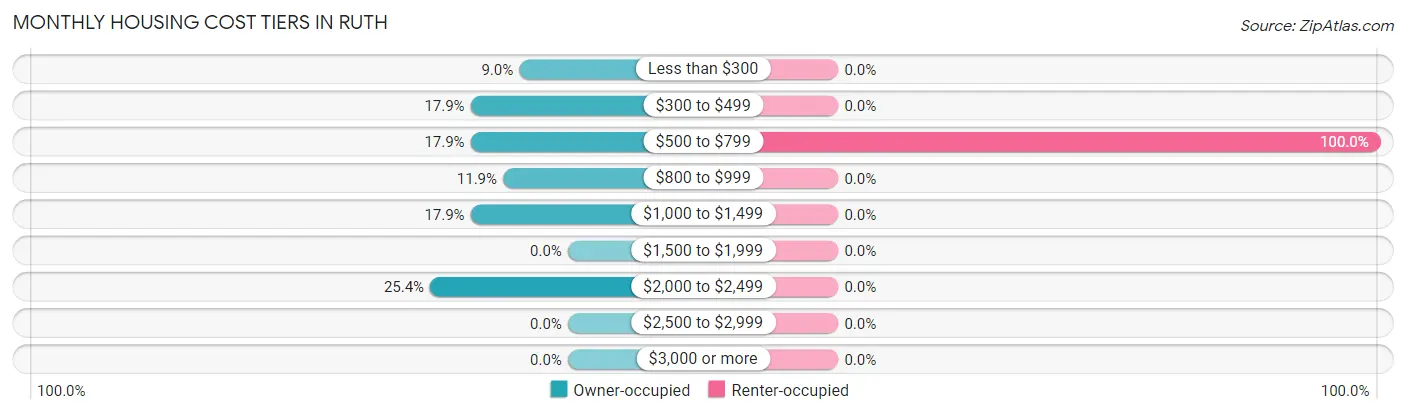
| Monthly Cost | Owner-occupied | Renter-occupied |
| Less than $300 | 6 (9.0%) | 0 (0.0%) |
| $300 to $499 | 12 (17.9%) | 0 (0.0%) |
| $500 to $799 | 12 (17.9%) | 5 (100.0%) |
| $800 to $999 | 8 (11.9%) | 0 (0.0%) |
| $1,000 to $1,499 | 12 (17.9%) | 0 (0.0%) |
| $1,500 to $1,999 | 0 (0.0%) | 0 (0.0%) |
| $2,000 to $2,499 | 17 (25.4%) | 0 (0.0%) |
| $2,500 to $2,999 | 0 (0.0%) | 0 (0.0%) |
| $3,000 or more | 0 (0.0%) | 0 (0.0%) |
| Total | 67 (100.0%) | 5 (100.0%) |
Physical Housing Characteristics in Ruth
Housing Structures in Ruth
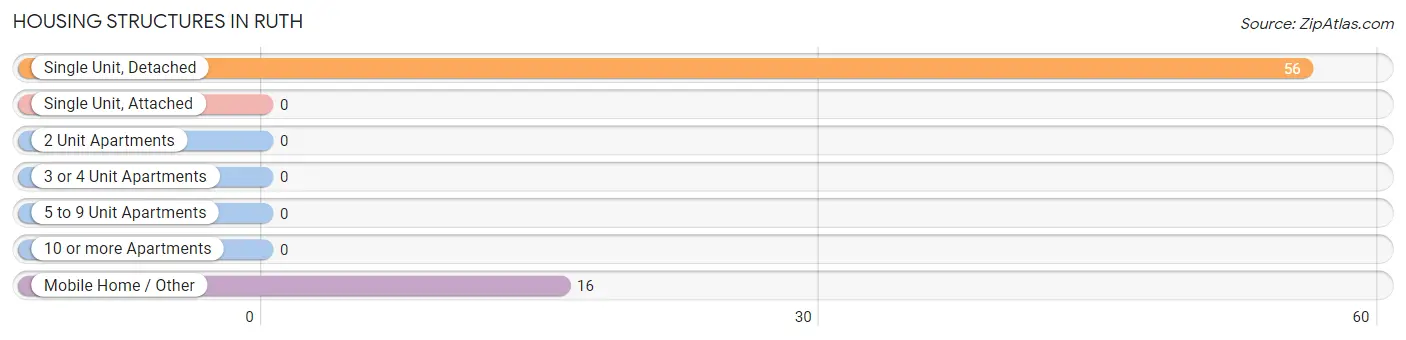
| Structure Type | # Housing Units | % Housing Units |
| Single Unit, Detached | 56 | 77.8% |
| Single Unit, Attached | 0 | 0.0% |
| 2 Unit Apartments | 0 | 0.0% |
| 3 or 4 Unit Apartments | 0 | 0.0% |
| 5 to 9 Unit Apartments | 0 | 0.0% |
| 10 or more Apartments | 0 | 0.0% |
| Mobile Home / Other | 16 | 22.2% |
| Total | 72 | 100.0% |
Housing Structures by Occupancy in Ruth
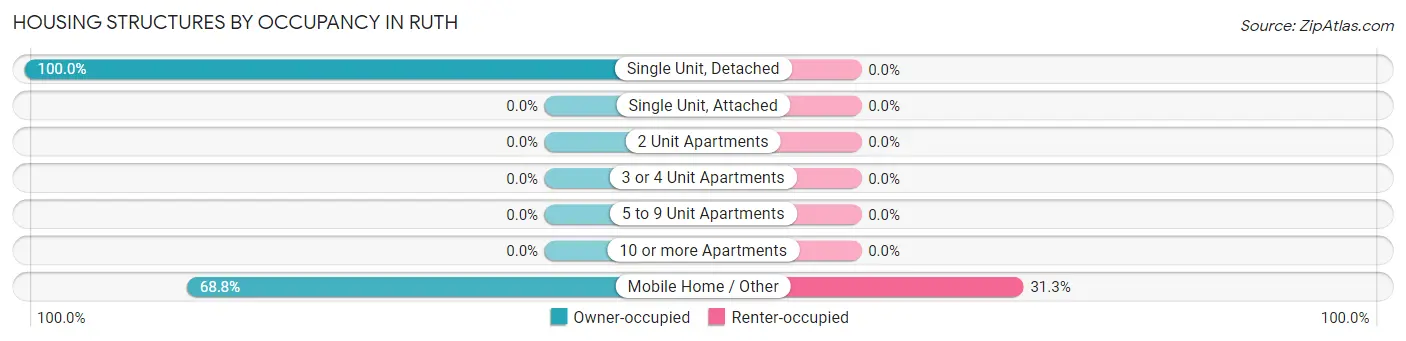
| Structure Type | Owner-occupied | Renter-occupied |
| Single Unit, Detached | 56 (100.0%) | 0 (0.0%) |
| Single Unit, Attached | 0 (0.0%) | 0 (0.0%) |
| 2 Unit Apartments | 0 (0.0%) | 0 (0.0%) |
| 3 or 4 Unit Apartments | 0 (0.0%) | 0 (0.0%) |
| 5 to 9 Unit Apartments | 0 (0.0%) | 0 (0.0%) |
| 10 or more Apartments | 0 (0.0%) | 0 (0.0%) |
| Mobile Home / Other | 11 (68.8%) | 5 (31.2%) |
| Total | 67 (93.1%) | 5 (6.9%) |
Housing Structures by Number of Rooms in Ruth
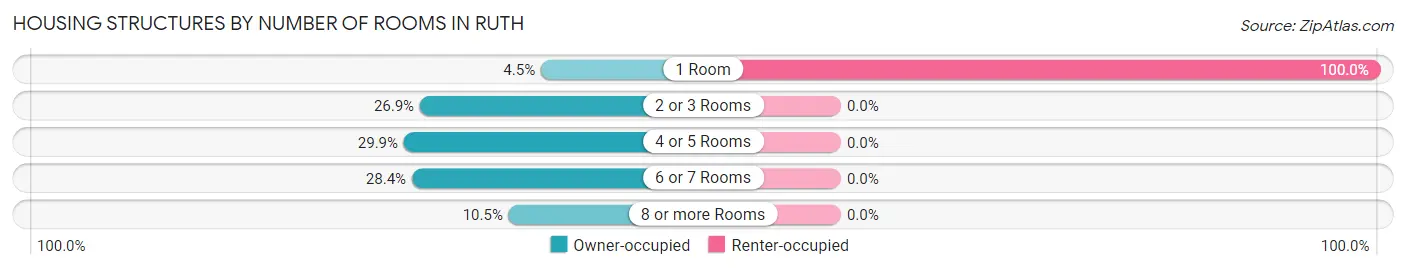
| Number of Rooms | Owner-occupied | Renter-occupied |
| 1 Room | 3 (4.5%) | 5 (100.0%) |
| 2 or 3 Rooms | 18 (26.9%) | 0 (0.0%) |
| 4 or 5 Rooms | 20 (29.8%) | 0 (0.0%) |
| 6 or 7 Rooms | 19 (28.4%) | 0 (0.0%) |
| 8 or more Rooms | 7 (10.4%) | 0 (0.0%) |
| Total | 67 (100.0%) | 5 (100.0%) |
Housing Structure by Heating Type in Ruth
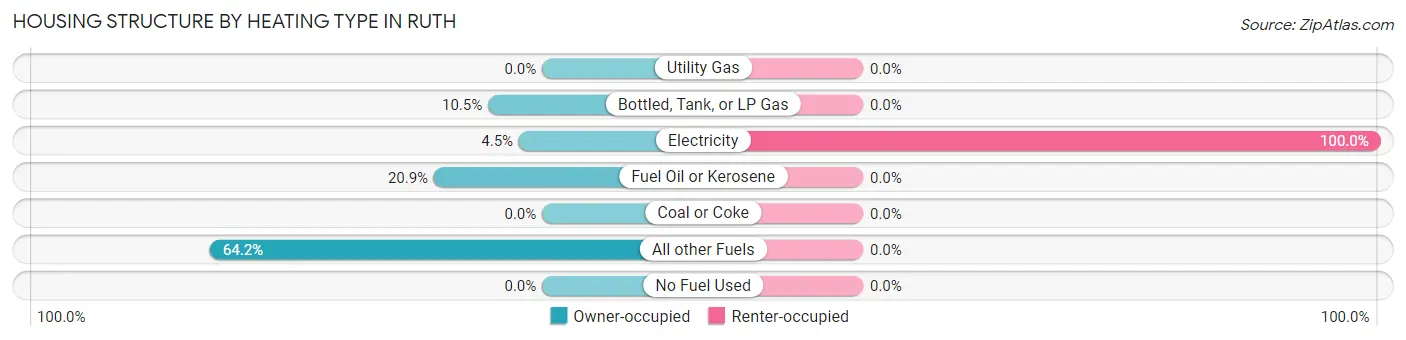
| Heating Type | Owner-occupied | Renter-occupied |
| Utility Gas | 0 (0.0%) | 0 (0.0%) |
| Bottled, Tank, or LP Gas | 7 (10.4%) | 0 (0.0%) |
| Electricity | 3 (4.5%) | 5 (100.0%) |
| Fuel Oil or Kerosene | 14 (20.9%) | 0 (0.0%) |
| Coal or Coke | 0 (0.0%) | 0 (0.0%) |
| All other Fuels | 43 (64.2%) | 0 (0.0%) |
| No Fuel Used | 0 (0.0%) | 0 (0.0%) |
| Total | 67 (100.0%) | 5 (100.0%) |
Household Vehicle Usage in Ruth
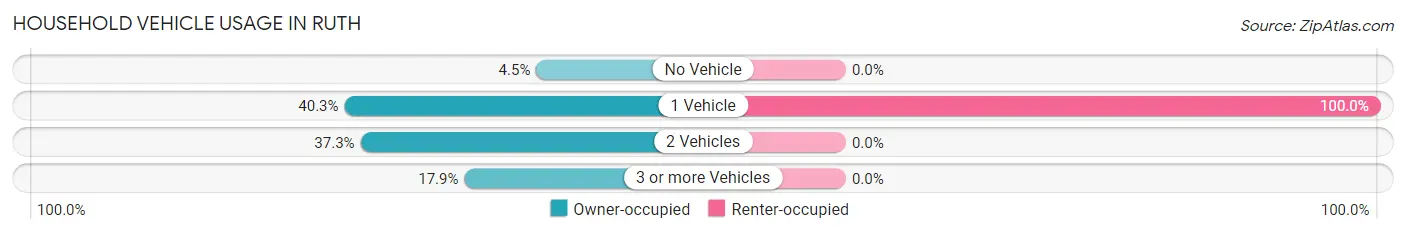
| Vehicles per Household | Owner-occupied | Renter-occupied |
| No Vehicle | 3 (4.5%) | 0 (0.0%) |
| 1 Vehicle | 27 (40.3%) | 5 (100.0%) |
| 2 Vehicles | 25 (37.3%) | 0 (0.0%) |
| 3 or more Vehicles | 12 (17.9%) | 0 (0.0%) |
| Total | 67 (100.0%) | 5 (100.0%) |
Real Estate & Mortgages in Ruth
Real Estate and Mortgage Overview in Ruth
| Characteristic | Without Mortgage | With Mortgage |
| Housing Units | 35 | 32 |
| Median Property Value | $443,300 | $0 |
| Median Household Income | - | - |
| Monthly Housing Costs | - | - |
| Real Estate Taxes | $2,333 | $0 |
Property Value by Mortgage Status in Ruth
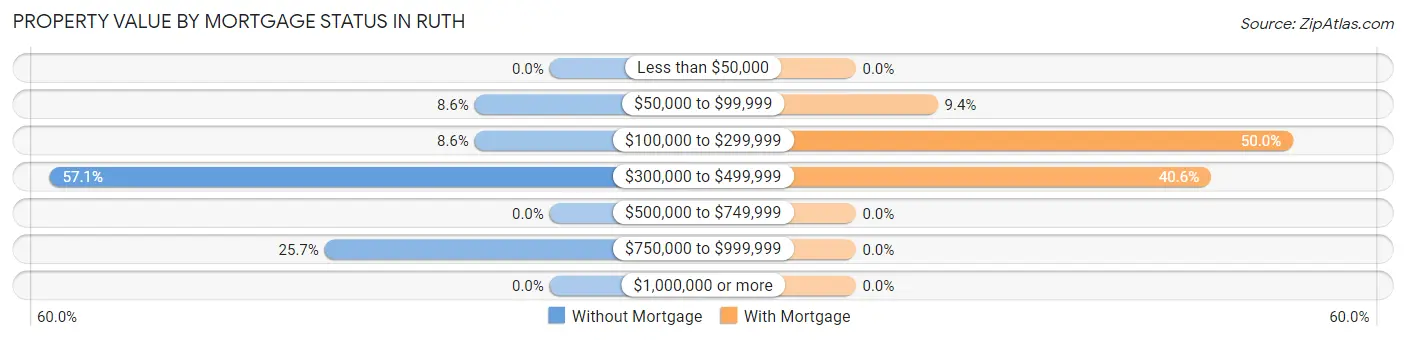
| Property Value | Without Mortgage | With Mortgage |
| Less than $50,000 | 0 (0.0%) | 0 (0.0%) |
| $50,000 to $99,999 | 3 (8.6%) | 3 (9.4%) |
| $100,000 to $299,999 | 3 (8.6%) | 16 (50.0%) |
| $300,000 to $499,999 | 20 (57.1%) | 13 (40.6%) |
| $500,000 to $749,999 | 0 (0.0%) | 0 (0.0%) |
| $750,000 to $999,999 | 9 (25.7%) | 0 (0.0%) |
| $1,000,000 or more | 0 (0.0%) | 0 (0.0%) |
| Total | 35 (100.0%) | 32 (100.0%) |
Household Income by Mortgage Status in Ruth
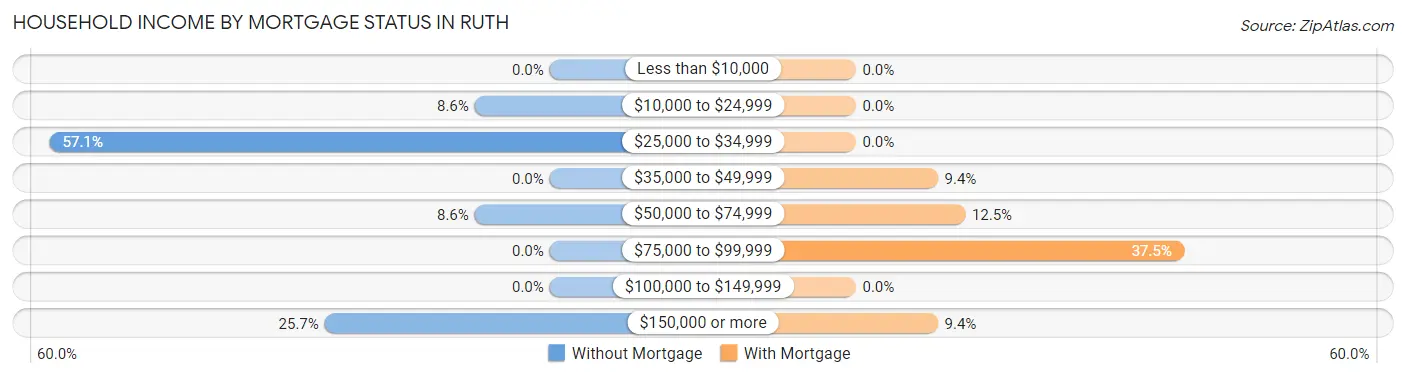
| Household Income | Without Mortgage | With Mortgage |
| Less than $10,000 | 0 (0.0%) | 0 (0.0%) |
| $10,000 to $24,999 | 3 (8.6%) | 0 (0.0%) |
| $25,000 to $34,999 | 20 (57.1%) | 0 (0.0%) |
| $35,000 to $49,999 | 0 (0.0%) | 3 (9.4%) |
| $50,000 to $74,999 | 3 (8.6%) | 4 (12.5%) |
| $75,000 to $99,999 | 0 (0.0%) | 12 (37.5%) |
| $100,000 to $149,999 | 0 (0.0%) | 0 (0.0%) |
| $150,000 or more | 9 (25.7%) | 3 (9.4%) |
| Total | 35 (100.0%) | 32 (100.0%) |
Property Value to Household Income Ratio in Ruth
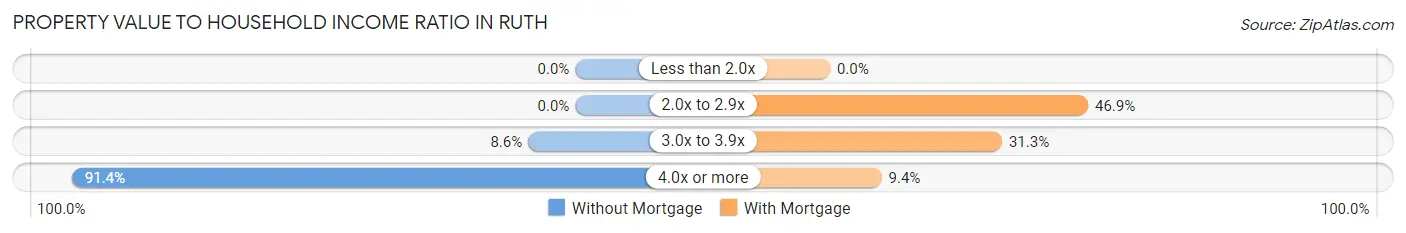
| Value-to-Income Ratio | Without Mortgage | With Mortgage |
| Less than 2.0x | 0 (0.0%) | 0 (0.0%) |
| 2.0x to 2.9x | 0 (0.0%) | 15 (46.9%) |
| 3.0x to 3.9x | 3 (8.6%) | 10 (31.2%) |
| 4.0x or more | 32 (91.4%) | 3 (9.4%) |
| Total | 35 (100.0%) | 32 (100.0%) |
Real Estate Taxes by Mortgage Status in Ruth
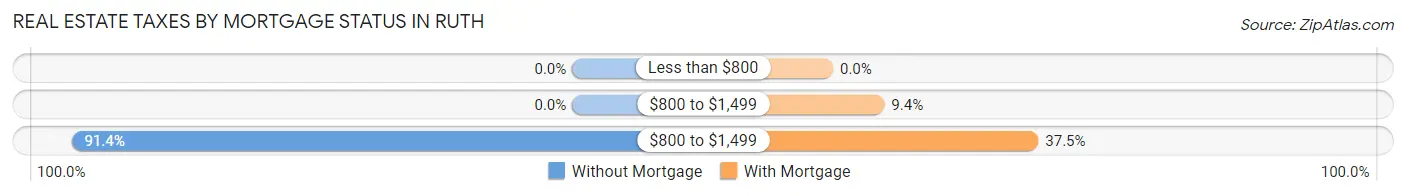
| Property Taxes | Without Mortgage | With Mortgage |
| Less than $800 | 0 (0.0%) | 0 (0.0%) |
| $800 to $1,499 | 0 (0.0%) | 3 (9.4%) |
| $800 to $1,499 | 32 (91.4%) | 12 (37.5%) |
| Total | 35 (100.0%) | 32 (100.0%) |
Health & Disability in Ruth
Health Insurance Coverage by Age in Ruth
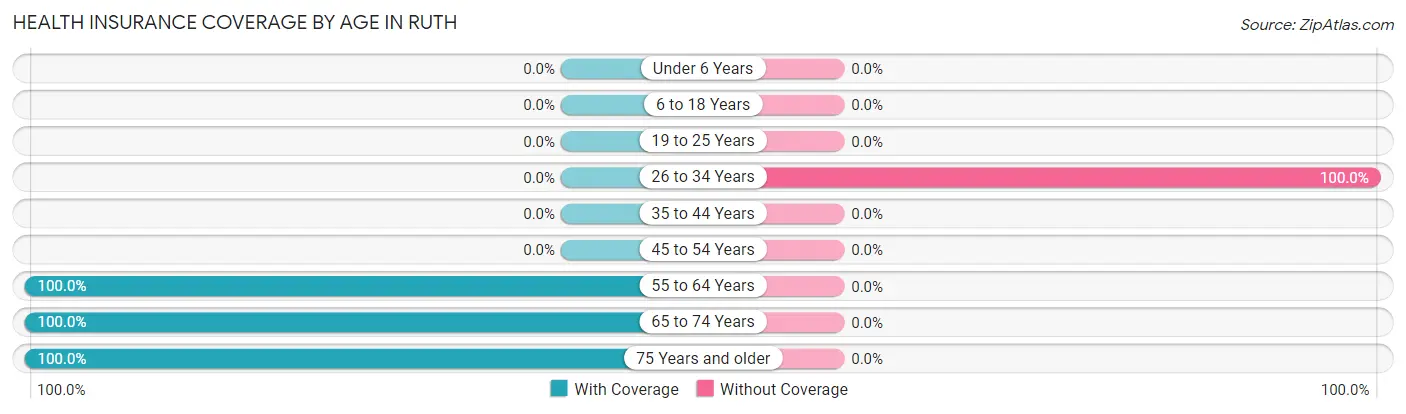
| Age Bracket | With Coverage | Without Coverage |
| Under 6 Years | 0 (0.0%) | 0 (0.0%) |
| 6 to 18 Years | 0 (0.0%) | 0 (0.0%) |
| 19 to 25 Years | 0 (0.0%) | 0 (0.0%) |
| 26 to 34 Years | 0 (0.0%) | 3 (100.0%) |
| 35 to 44 Years | 0 (0.0%) | 0 (0.0%) |
| 45 to 54 Years | 0 (0.0%) | 0 (0.0%) |
| 55 to 64 Years | 19 (100.0%) | 0 (0.0%) |
| 65 to 74 Years | 102 (100.0%) | 0 (0.0%) |
| 75 Years and older | 27 (100.0%) | 0 (0.0%) |
| Total | 148 (98.0%) | 3 (2.0%) |
Health Insurance Coverage by Citizenship Status in Ruth
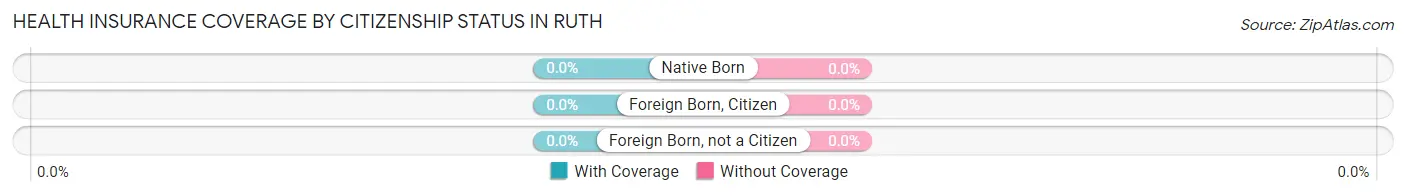
| Citizenship Status | With Coverage | Without Coverage |
| Native Born | 0 (0.0%) | 0 (0.0%) |
| Foreign Born, Citizen | 0 (0.0%) | 0 (0.0%) |
| Foreign Born, not a Citizen | 0 (0.0%) | 0 (0.0%) |
Health Insurance Coverage by Household Income in Ruth
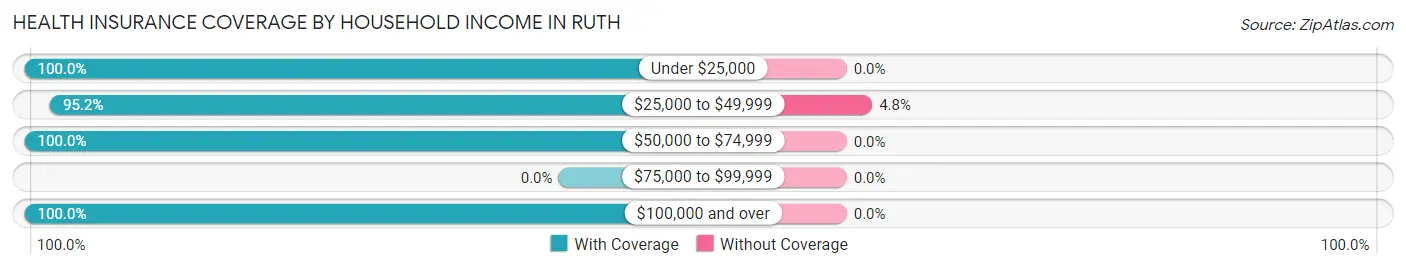
| Household Income | With Coverage | Without Coverage |
| Under $25,000 | 3 (100.0%) | 0 (0.0%) |
| $25,000 to $49,999 | 60 (95.2%) | 3 (4.8%) |
| $50,000 to $74,999 | 35 (100.0%) | 0 (0.0%) |
| $75,000 to $99,999 | 0 (0.0%) | 0 (0.0%) |
| $100,000 and over | 50 (100.0%) | 0 (0.0%) |
Public vs Private Health Insurance Coverage by Age in Ruth
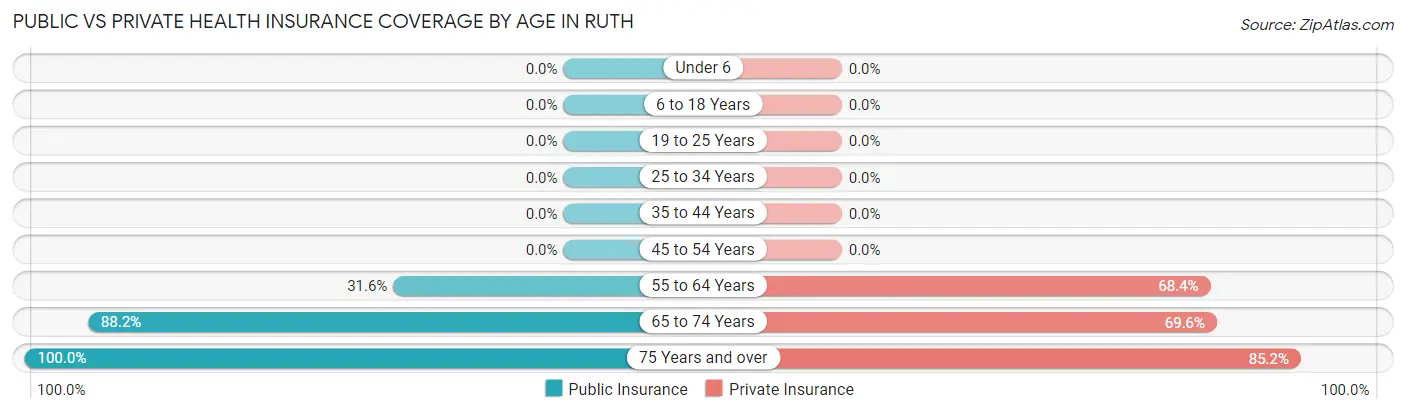
| Age Bracket | Public Insurance | Private Insurance |
| Under 6 | 0 (0.0%) | 0 (0.0%) |
| 6 to 18 Years | 0 (0.0%) | 0 (0.0%) |
| 19 to 25 Years | 0 (0.0%) | 0 (0.0%) |
| 25 to 34 Years | 0 (0.0%) | 0 (0.0%) |
| 35 to 44 Years | 0 (0.0%) | 0 (0.0%) |
| 45 to 54 Years | 0 (0.0%) | 0 (0.0%) |
| 55 to 64 Years | 6 (31.6%) | 13 (68.4%) |
| 65 to 74 Years | 90 (88.2%) | 71 (69.6%) |
| 75 Years and over | 27 (100.0%) | 23 (85.2%) |
| Total | 123 (81.5%) | 107 (70.9%) |
Disability Status by Sex by Age in Ruth
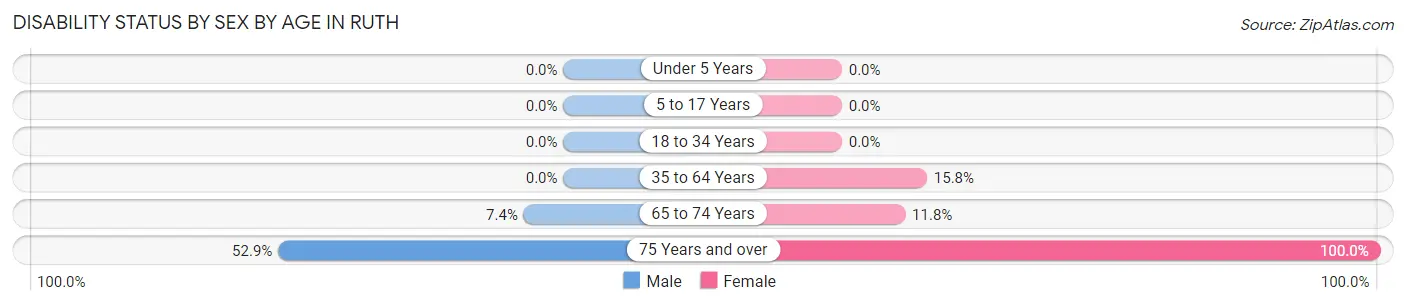
| Age Bracket | Male | Female |
| Under 5 Years | 0 (0.0%) | 0 (0.0%) |
| 5 to 17 Years | 0 (0.0%) | 0 (0.0%) |
| 18 to 34 Years | 0 (0.0%) | 0 (0.0%) |
| 35 to 64 Years | 0 (0.0%) | 3 (15.8%) |
| 65 to 74 Years | 5 (7.3%) | 4 (11.8%) |
| 75 Years and over | 9 (52.9%) | 10 (100.0%) |
Disability Class by Sex by Age in Ruth
Disability Class: Hearing Difficulty
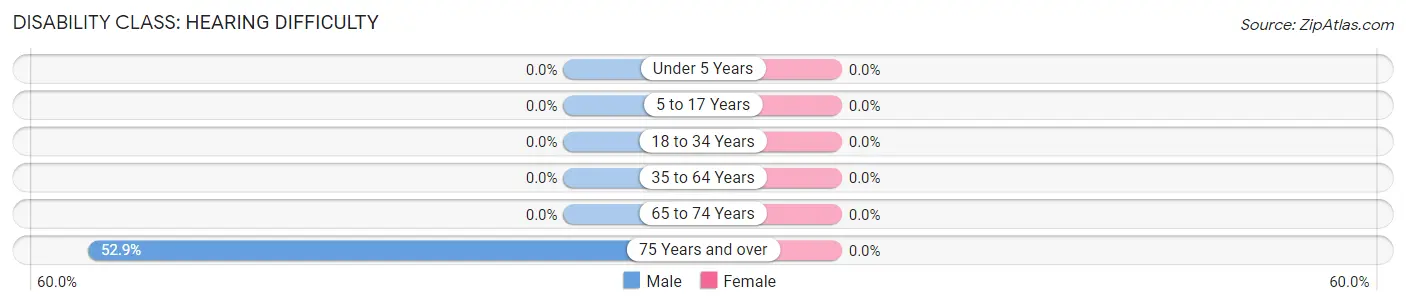
| Age Bracket | Male | Female |
| Under 5 Years | 0 (0.0%) | 0 (0.0%) |
| 5 to 17 Years | 0 (0.0%) | 0 (0.0%) |
| 18 to 34 Years | 0 (0.0%) | 0 (0.0%) |
| 35 to 64 Years | 0 (0.0%) | 0 (0.0%) |
| 65 to 74 Years | 0 (0.0%) | 0 (0.0%) |
| 75 Years and over | 9 (52.9%) | 0 (0.0%) |
Disability Class: Vision Difficulty
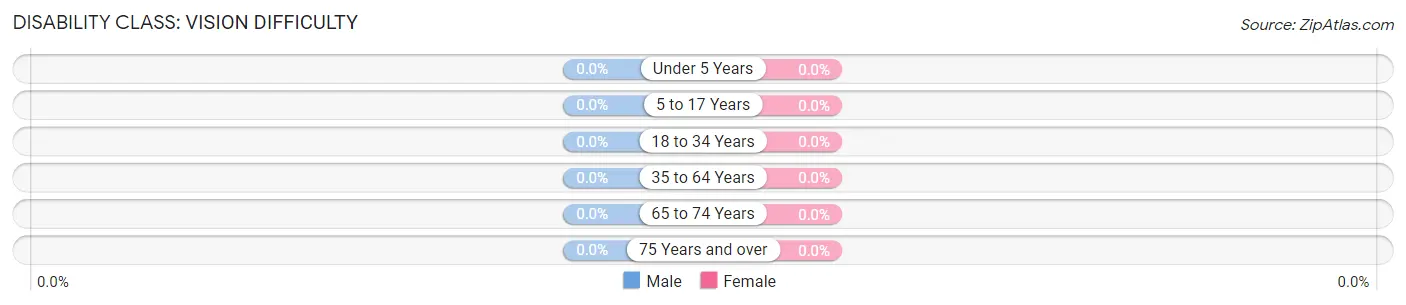
| Age Bracket | Male | Female |
| Under 5 Years | 0 (0.0%) | 0 (0.0%) |
| 5 to 17 Years | 0 (0.0%) | 0 (0.0%) |
| 18 to 34 Years | 0 (0.0%) | 0 (0.0%) |
| 35 to 64 Years | 0 (0.0%) | 0 (0.0%) |
| 65 to 74 Years | 0 (0.0%) | 0 (0.0%) |
| 75 Years and over | 0 (0.0%) | 0 (0.0%) |
Disability Class: Cognitive Difficulty
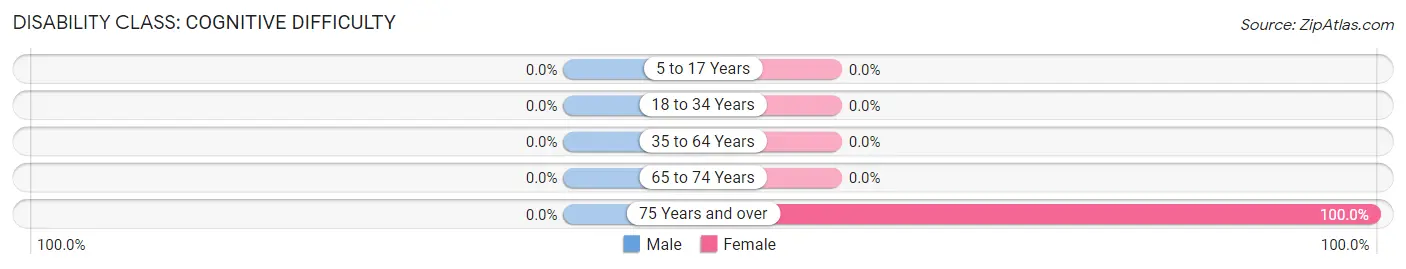
| Age Bracket | Male | Female |
| 5 to 17 Years | 0 (0.0%) | 0 (0.0%) |
| 18 to 34 Years | 0 (0.0%) | 0 (0.0%) |
| 35 to 64 Years | 0 (0.0%) | 0 (0.0%) |
| 65 to 74 Years | 0 (0.0%) | 0 (0.0%) |
| 75 Years and over | 0 (0.0%) | 10 (100.0%) |
Disability Class: Ambulatory Difficulty

| Age Bracket | Male | Female |
| 5 to 17 Years | 0 (0.0%) | 0 (0.0%) |
| 18 to 34 Years | 0 (0.0%) | 0 (0.0%) |
| 35 to 64 Years | 0 (0.0%) | 0 (0.0%) |
| 65 to 74 Years | 5 (7.3%) | 0 (0.0%) |
| 75 Years and over | 0 (0.0%) | 0 (0.0%) |
Disability Class: Self-Care Difficulty
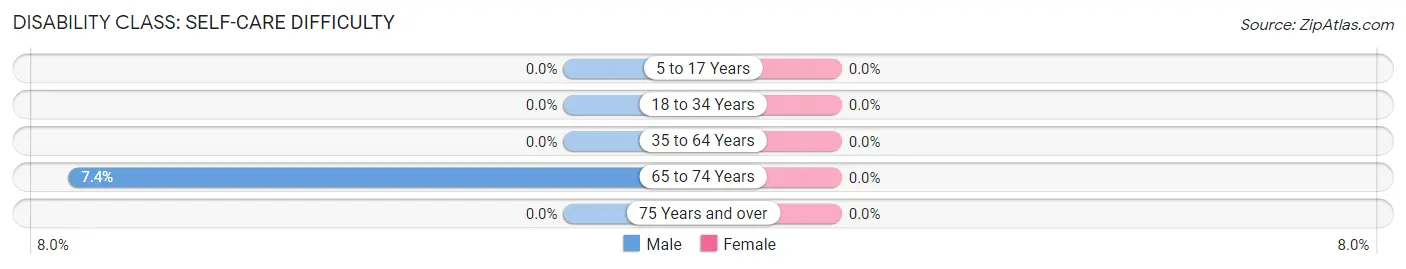
| Age Bracket | Male | Female |
| 5 to 17 Years | 0 (0.0%) | 0 (0.0%) |
| 18 to 34 Years | 0 (0.0%) | 0 (0.0%) |
| 35 to 64 Years | 0 (0.0%) | 0 (0.0%) |
| 65 to 74 Years | 5 (7.3%) | 0 (0.0%) |
| 75 Years and over | 0 (0.0%) | 0 (0.0%) |
Technology Access in Ruth
Computing Device Access in Ruth
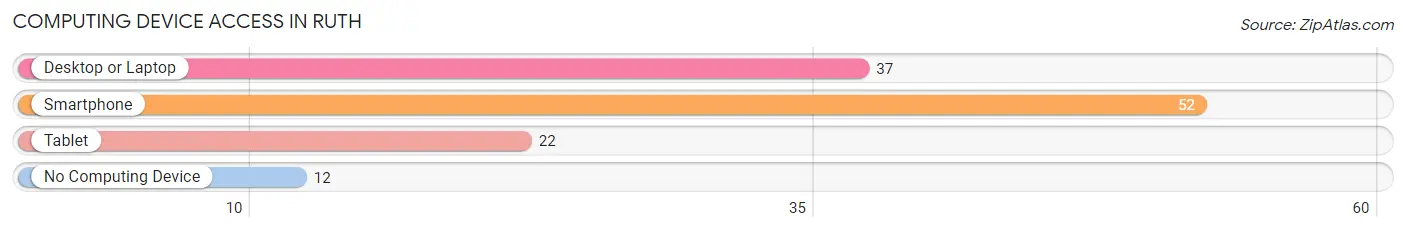
| Device Type | # Households | % Households |
| Desktop or Laptop | 37 | 51.4% |
| Smartphone | 52 | 72.2% |
| Tablet | 22 | 30.6% |
| No Computing Device | 12 | 16.7% |
| Total | 72 | 100.0% |
Internet Access in Ruth
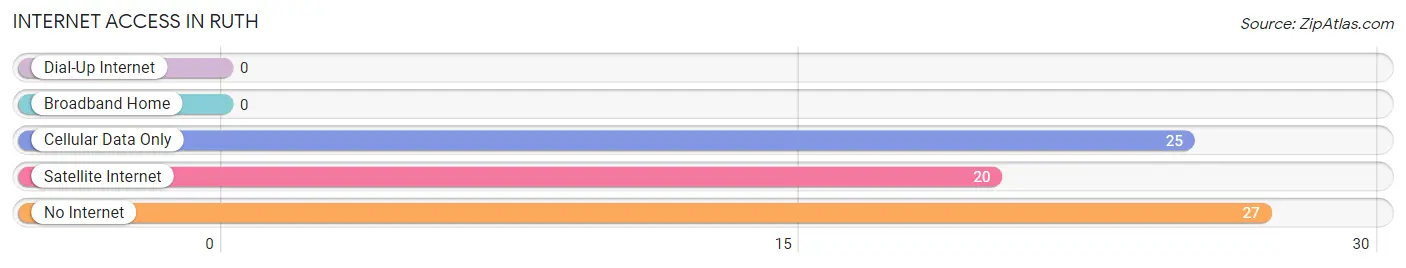
| Internet Type | # Households | % Households |
| Dial-Up Internet | 0 | 0.0% |
| Broadband Home | 0 | 0.0% |
| Cellular Data Only | 25 | 34.7% |
| Satellite Internet | 20 | 27.8% |
| No Internet | 27 | 37.5% |
| Total | 72 | 100.0% |
Ruth Summary
Ruth is a small unincorporated community located in the Sierra Nevada foothills of Placer County, California. It is situated in the Sierra Nevada mountain range, approximately 25 miles northeast of Sacramento and about 10 miles south of the Nevada border. The population of Ruth was estimated to be around 200 people in 2020.
History
Ruth was founded in 1864 by a group of miners who were searching for gold in the area. The town was named after the wife of one of the miners, Ruth Smith. The town quickly grew and by 1868, it had a population of over 500 people. The town was home to several businesses, including a hotel, saloon, general store, and a post office.
In the late 1800s, the town began to decline as the gold rush ended and the population decreased. By the early 1900s, the town was nearly abandoned. In the 1920s, the town was revived when the Sierra Nevada Logging Company began to operate in the area. The company built a sawmill and a railroad line to transport the logs to the mill. The town also became a popular destination for tourists who wanted to experience the beauty of the Sierra Nevada Mountains.
Geography
Ruth is located in the Sierra Nevada foothills of Placer County, California. It is situated in the Sierra Nevada mountain range, approximately 25 miles northeast of Sacramento and about 10 miles south of the Nevada border. The town is surrounded by the Tahoe National Forest and is located at an elevation of 4,000 feet. The climate in Ruth is characterized by hot, dry summers and cold, wet winters.
Economy
Ruth’s economy is largely based on tourism and logging. The town is a popular destination for outdoor enthusiasts who come to enjoy the beauty of the Sierra Nevada Mountains. The town is also home to several logging companies that harvest timber from the surrounding forests.
Demographics
The population of Ruth was estimated to be around 200 people in 2020. The town is predominantly white, with a small Hispanic population. The median household income in Ruth is $45,000, and the median home value is $250,000. The town has a low unemployment rate and a high rate of homeownership.
Common Questions
What is Per Capita Income in Ruth?
Per Capita income in Ruth is $39,678.
What is the Median Household income in Ruth?
Median Household Income in Ruth is $58,333.
What is Inequality or Gini Index in Ruth?
Inequality or Gini Index in Ruth is 0.39.
What is the Total Population of Ruth?
Total Population of Ruth is 151.
What is the Total Male Population of Ruth?
Total Male Population of Ruth is 88.
What is the Total Female Population of Ruth?
Total Female Population of Ruth is 63.
What is the Ratio of Males per 100 Females in Ruth?
There are 139.68 Males per 100 Females in Ruth.
What is the Ratio of Females per 100 Males in Ruth?
There are 71.59 Females per 100 Males in Ruth.
What is the Median Population Age in Ruth?
Median Population Age in Ruth is 70.2 Years.
What is the Average Family Size in Ruth
Average Family Size in Ruth is 2.2 People.
What is the Average Household Size in Ruth
Average Household Size in Ruth is 2.1 People.
How Large is the Labor Force in Ruth?
There are 28 People in the Labor Forcein in Ruth.
What is the Percentage of People in the Labor Force in Ruth?
18.5% of People are in the Labor Force in Ruth.