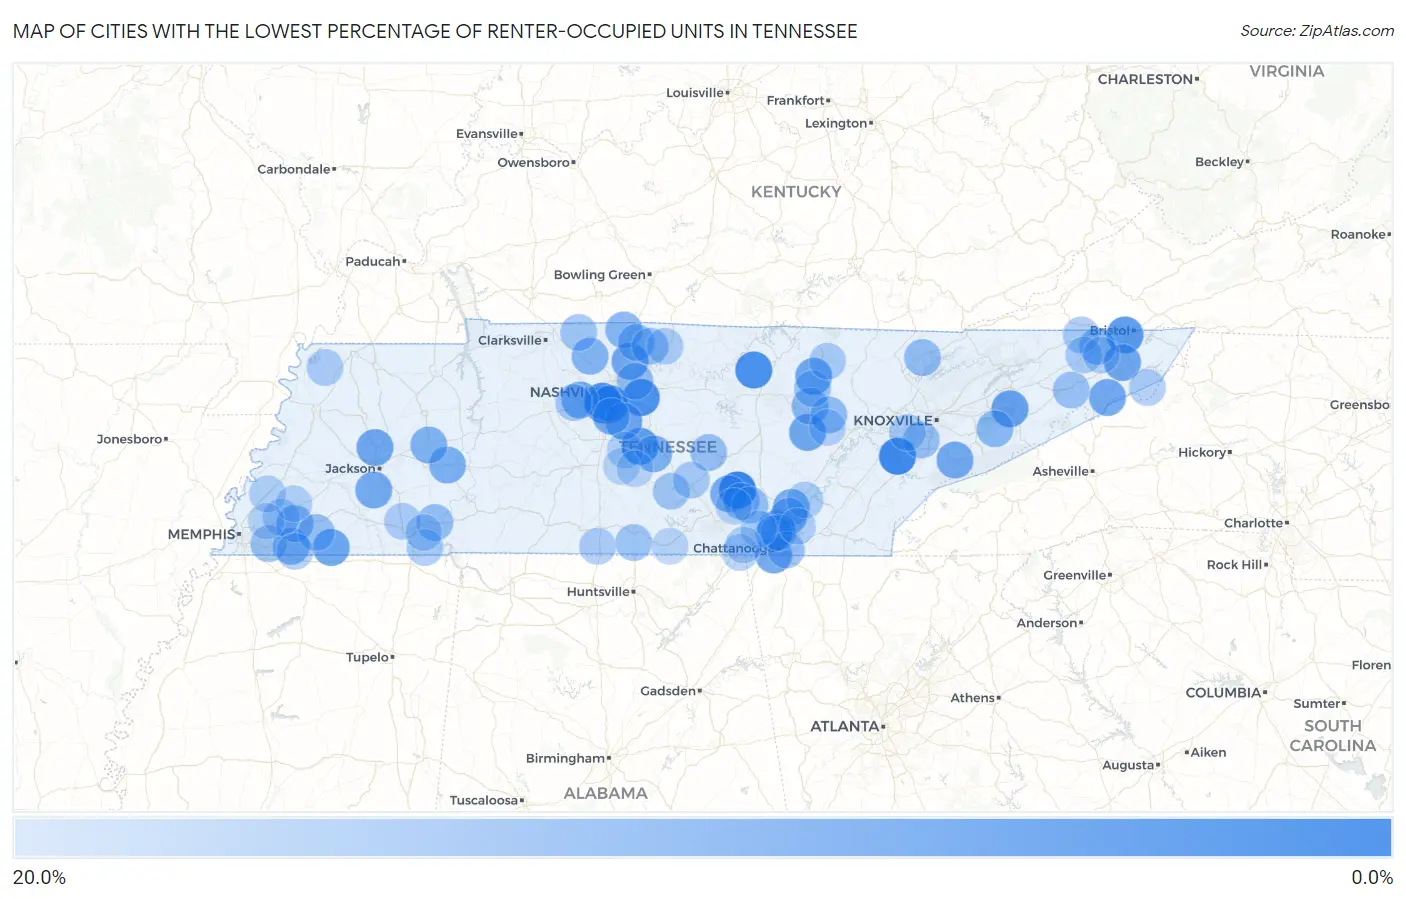
Cities with the Lowest Percentage of Renter-Occupied Units in Tennessee
RELATED REPORTS & OPTIONS
Lowest Renter-Occupied
Tennessee
Compare Cities
Map of Cities with the Lowest Percentage of Renter-Occupied Units in Tennessee
20.0%
0.0%
Cities with the Lowest Percentage of Renter-Occupied Units in Tennessee
| City | % Renter-Occupied | vs State | vs National | |
| 1. | Beersheba Springs | 0.52% | 32.9%(-32.4)#1 | 35.2%(-34.7)#13 |
| 2. | Tellico Village | 1.6% | 32.9%(-31.4)#2 | 35.2%(-33.6)#135 |
| 3. | Forest Hills | 2.2% | 32.9%(-30.7)#3 | 35.2%(-33.0)#270 |
| 4. | Dodson Branch | 2.6% | 32.9%(-30.3)#4 | 35.2%(-32.5)#408 |
| 5. | Hilham | 2.9% | 32.9%(-30.1)#5 | 35.2%(-32.3)#471 |
| 6. | Briceville | 2.9% | 32.9%(-30.0)#6 | 35.2%(-32.2)#483 |
| 7. | Rural Hill | 3.0% | 32.9%(-29.9)#7 | 35.2%(-32.1)#523 |
| 8. | Belle Meade | 3.3% | 32.9%(-29.7)#8 | 35.2%(-31.9)#605 |
| 9. | Oak Grove Cdp Sumner County | 3.3% | 32.9%(-29.7)#9 | 35.2%(-31.9)#606 |
| 10. | Walnut Hill | 4.5% | 32.9%(-28.4)#10 | 35.2%(-30.7)#1,016 |
| 11. | Oak Hill | 4.8% | 32.9%(-28.1)#11 | 35.2%(-30.3)#1,158 |
| 12. | Rockvale | 5.4% | 32.9%(-27.6)#12 | 35.2%(-29.8)#1,381 |
| 13. | Kahite | 5.5% | 32.9%(-27.5)#13 | 35.2%(-29.7)#1,427 |
| 14. | Fairmount | 6.0% | 32.9%(-27.0)#14 | 35.2%(-29.2)#1,630 |
| 15. | Baneberry | 6.1% | 32.9%(-26.8)#15 | 35.2%(-29.1)#1,683 |
| 16. | Nolensville | 6.8% | 32.9%(-26.1)#16 | 35.2%(-28.4)#1,973 |
| 17. | Grimsley | 6.9% | 32.9%(-26.1)#17 | 35.2%(-28.3)#1,997 |
| 18. | Morris Chapel | 6.9% | 32.9%(-26.0)#18 | 35.2%(-28.3)#2,001 |
| 19. | La Grange | 7.0% | 32.9%(-26.0)#19 | 35.2%(-28.2)#2,049 |
| 20. | Shackle Island | 7.0% | 32.9%(-25.9)#20 | 35.2%(-28.2)#2,058 |
| 21. | Lake Tansi | 7.0% | 32.9%(-25.9)#21 | 35.2%(-28.2)#2,073 |
| 22. | Three Way | 7.1% | 32.9%(-25.8)#22 | 35.2%(-28.1)#2,109 |
| 23. | Watauga | 7.1% | 32.9%(-25.8)#23 | 35.2%(-28.1)#2,118 |
| 24. | Lookout Mountain | 7.2% | 32.9%(-25.7)#24 | 35.2%(-27.9)#2,176 |
| 25. | Banner Hill | 7.3% | 32.9%(-25.6)#25 | 35.2%(-27.9)#2,207 |
| 26. | Bon Air | 7.3% | 32.9%(-25.6)#26 | 35.2%(-27.9)#2,212 |
| 27. | Townsend | 7.6% | 32.9%(-25.3)#27 | 35.2%(-27.6)#2,344 |
| 28. | Medon | 7.6% | 32.9%(-25.3)#28 | 35.2%(-27.6)#2,354 |
| 29. | Pegram | 8.1% | 32.9%(-24.8)#29 | 35.2%(-27.0)#2,604 |
| 30. | Altamont | 8.2% | 32.9%(-24.7)#30 | 35.2%(-27.0)#2,651 |
| 31. | Flat Top Mountain | 8.3% | 32.9%(-24.6)#31 | 35.2%(-26.9)#2,673 |
| 32. | Brentwood | 8.4% | 32.9%(-24.6)#32 | 35.2%(-26.8)#2,717 |
| 33. | Darden | 8.6% | 32.9%(-24.4)#33 | 35.2%(-26.6)#2,802 |
| 34. | Blanche | 8.9% | 32.9%(-24.1)#34 | 35.2%(-26.3)#2,971 |
| 35. | Christiana | 9.0% | 32.9%(-23.9)#35 | 35.2%(-26.2)#3,062 |
| 36. | Parker S Crossroads | 9.1% | 32.9%(-23.9)#36 | 35.2%(-26.1)#3,106 |
| 37. | Coopertown | 9.6% | 32.9%(-23.4)#37 | 35.2%(-25.6)#3,361 |
| 38. | Mowbray Mountain | 9.8% | 32.9%(-23.2)#38 | 35.2%(-25.4)#3,460 |
| 39. | Piperton | 10.0% | 32.9%(-22.9)#39 | 35.2%(-25.2)#3,563 |
| 40. | Wildersville | 10.0% | 32.9%(-22.9)#40 | 35.2%(-25.2)#3,579 |
| 41. | Orlinda | 10.0% | 32.9%(-22.9)#41 | 35.2%(-25.1)#3,617 |
| 42. | Bowman | 10.2% | 32.9%(-22.7)#42 | 35.2%(-24.9)#3,718 |
| 43. | Oakland | 10.3% | 32.9%(-22.7)#43 | 35.2%(-24.9)#3,735 |
| 44. | Fairgarden | 10.5% | 32.9%(-22.5)#44 | 35.2%(-24.7)#3,837 |
| 45. | Fairfield Glade | 10.6% | 32.9%(-22.4)#45 | 35.2%(-24.6)#3,890 |
| 46. | Colonial Heights | 10.7% | 32.9%(-22.3)#46 | 35.2%(-24.5)#3,925 |
| 47. | New Deal | 10.7% | 32.9%(-22.3)#47 | 35.2%(-24.5)#3,942 |
| 48. | Signal Mountain | 11.1% | 32.9%(-21.9)#48 | 35.2%(-24.1)#4,158 |
| 49. | Gruetli Laager | 11.4% | 32.9%(-21.5)#49 | 35.2%(-23.7)#4,359 |
| 50. | Fincastle | 11.6% | 32.9%(-21.4)#50 | 35.2%(-23.6)#4,431 |
| 51. | Green Hill | 11.6% | 32.9%(-21.3)#51 | 35.2%(-23.6)#4,447 |
| 52. | Graball | 11.6% | 32.9%(-21.3)#52 | 35.2%(-23.6)#4,460 |
| 53. | Palmer | 11.7% | 32.9%(-21.3)#53 | 35.2%(-23.5)#4,502 |
| 54. | Crump | 11.7% | 32.9%(-21.2)#54 | 35.2%(-23.4)#4,527 |
| 55. | Centertown | 11.9% | 32.9%(-21.0)#55 | 35.2%(-23.3)#4,612 |
| 56. | Williston | 12.0% | 32.9%(-21.0)#56 | 35.2%(-23.2)#4,644 |
| 57. | Louisville | 12.0% | 32.9%(-20.9)#57 | 35.2%(-23.2)#4,679 |
| 58. | Ridgeside | 12.1% | 32.9%(-20.8)#58 | 35.2%(-23.1)#4,735 |
| 59. | Tusculum | 12.2% | 32.9%(-20.8)#59 | 35.2%(-23.0)#4,767 |
| 60. | Germantown | 12.4% | 32.9%(-20.5)#60 | 35.2%(-22.8)#4,918 |
| 61. | Gladeville | 12.4% | 32.9%(-20.5)#61 | 35.2%(-22.7)#4,932 |
| 62. | Clarkrange | 12.6% | 32.9%(-20.4)#62 | 35.2%(-22.6)#5,036 |
| 63. | Park City | 12.7% | 32.9%(-20.3)#63 | 35.2%(-22.5)#5,085 |
| 64. | Adams | 12.7% | 32.9%(-20.2)#64 | 35.2%(-22.5)#5,099 |
| 65. | Normandy | 12.9% | 32.9%(-20.0)#65 | 35.2%(-22.3)#5,230 |
| 66. | Kingston Springs | 13.2% | 32.9%(-19.7)#66 | 35.2%(-22.0)#5,426 |
| 67. | Michie | 13.6% | 32.9%(-19.3)#67 | 35.2%(-21.5)#5,669 |
| 68. | New Union | 13.6% | 32.9%(-19.3)#68 | 35.2%(-21.5)#5,684 |
| 69. | Mount Carmel | 13.7% | 32.9%(-19.3)#69 | 35.2%(-21.5)#5,708 |
| 70. | Farragut | 13.8% | 32.9%(-19.2)#70 | 35.2%(-21.4)#5,770 |
| 71. | Arlington | 13.9% | 32.9%(-19.0)#71 | 35.2%(-21.3)#5,861 |
| 72. | Fall Branch | 14.0% | 32.9%(-18.9)#72 | 35.2%(-21.2)#5,912 |
| 73. | Allardt | 14.0% | 32.9%(-18.9)#73 | 35.2%(-21.2)#5,937 |
| 74. | Valley Forge | 14.1% | 32.9%(-18.9)#74 | 35.2%(-21.1)#5,964 |
| 75. | Roan Mountain | 14.1% | 32.9%(-18.8)#75 | 35.2%(-21.1)#5,998 |
| 76. | Elkton | 14.2% | 32.9%(-18.7)#76 | 35.2%(-21.0)#6,039 |
| 77. | Bethpage | 14.3% | 32.9%(-18.7)#77 | 35.2%(-20.9)#6,087 |
| 78. | Bethel Springs | 14.3% | 32.9%(-18.6)#78 | 35.2%(-20.9)#6,138 |
| 79. | Rossville | 14.3% | 32.9%(-18.6)#79 | 35.2%(-20.8)#6,144 |
| 80. | Hornbeak | 14.4% | 32.9%(-18.6)#80 | 35.2%(-20.8)#6,154 |
| 81. | Walden | 14.4% | 32.9%(-18.5)#81 | 35.2%(-20.8)#6,185 |
| 82. | Stantonville | 14.5% | 32.9%(-18.4)#82 | 35.2%(-20.7)#6,235 |
| 83. | Powells Crossroads | 14.5% | 32.9%(-18.4)#83 | 35.2%(-20.7)#6,257 |
| 84. | Sale Creek | 14.6% | 32.9%(-18.3)#84 | 35.2%(-20.6)#6,289 |
| 85. | Lakesite | 14.6% | 32.9%(-18.3)#85 | 35.2%(-20.6)#6,299 |
| 86. | New Hope | 14.6% | 32.9%(-18.3)#86 | 35.2%(-20.5)#6,301 |
| 87. | Jasper | 14.7% | 32.9%(-18.2)#87 | 35.2%(-20.5)#6,375 |
| 88. | Eagleville | 14.8% | 32.9%(-18.2)#88 | 35.2%(-20.4)#6,405 |
| 89. | Atoka | 14.8% | 32.9%(-18.2)#89 | 35.2%(-20.4)#6,421 |
| 90. | Braden | 15.0% | 32.9%(-18.0)#90 | 35.2%(-20.2)#6,522 |
| 91. | Crab Orchard | 15.1% | 32.9%(-17.9)#91 | 35.2%(-20.1)#6,599 |
| 92. | Gray | 15.3% | 32.9%(-17.7)#92 | 35.2%(-19.9)#6,699 |
| 93. | Bartlett | 15.3% | 32.9%(-17.6)#93 | 35.2%(-19.8)#6,741 |
| 94. | Huntland | 15.4% | 32.9%(-17.5)#94 | 35.2%(-19.7)#6,817 |
| 95. | Lynchburg | 15.6% | 32.9%(-17.3)#95 | 35.2%(-19.6)#6,893 |
| 96. | Coalmont | 15.6% | 32.9%(-17.3)#96 | 35.2%(-19.6)#6,900 |
| 97. | Mcdonald | 15.6% | 32.9%(-17.3)#97 | 35.2%(-19.6)#6,906 |
| 98. | Rarity Bay | 15.6% | 32.9%(-17.3)#98 | 35.2%(-19.5)#6,927 |
| 99. | Chapel Hill | 15.8% | 32.9%(-17.2)#99 | 35.2%(-19.4)#6,996 |
| 100. | Unionville | 15.8% | 32.9%(-17.2)#100 | 35.2%(-19.4)#7,007 |
Common Questions
What are the Top 10 Cities with the Lowest Percentage of Renter-Occupied Units in Tennessee?
Top 10 Cities with the Lowest Percentage of Renter-Occupied Units in Tennessee are:
#1
0.52%
#2
1.6%
#3
2.2%
#4
2.6%
#5
3.0%
#6
3.3%
#7
4.5%
#8
4.8%
#9
5.4%
#10
6.0%
What city has the Lowest Percentage of Renter-Occupied Units in Tennessee?
Beersheba Springs has the Lowest Percentage of Renter-Occupied Units in Tennessee with 0.52%.
What is the Percentage of Renter-Occupied Units in the State of Tennessee?
Percentage of Renter-Occupied Units in Tennessee is 32.9%.
What is the Percentage of Renter-Occupied Units in the United States?
Percentage of Renter-Occupied Units in the United States is 35.2%.