Cities with the Lowest Percentage of Renter-Occupied Units in Idaho
RELATED REPORTS & OPTIONS
Lowest Renter-Occupied
Idaho
Compare Cities
Map of Cities with the Lowest Percentage of Renter-Occupied Units in Idaho
25.0%
0.0%
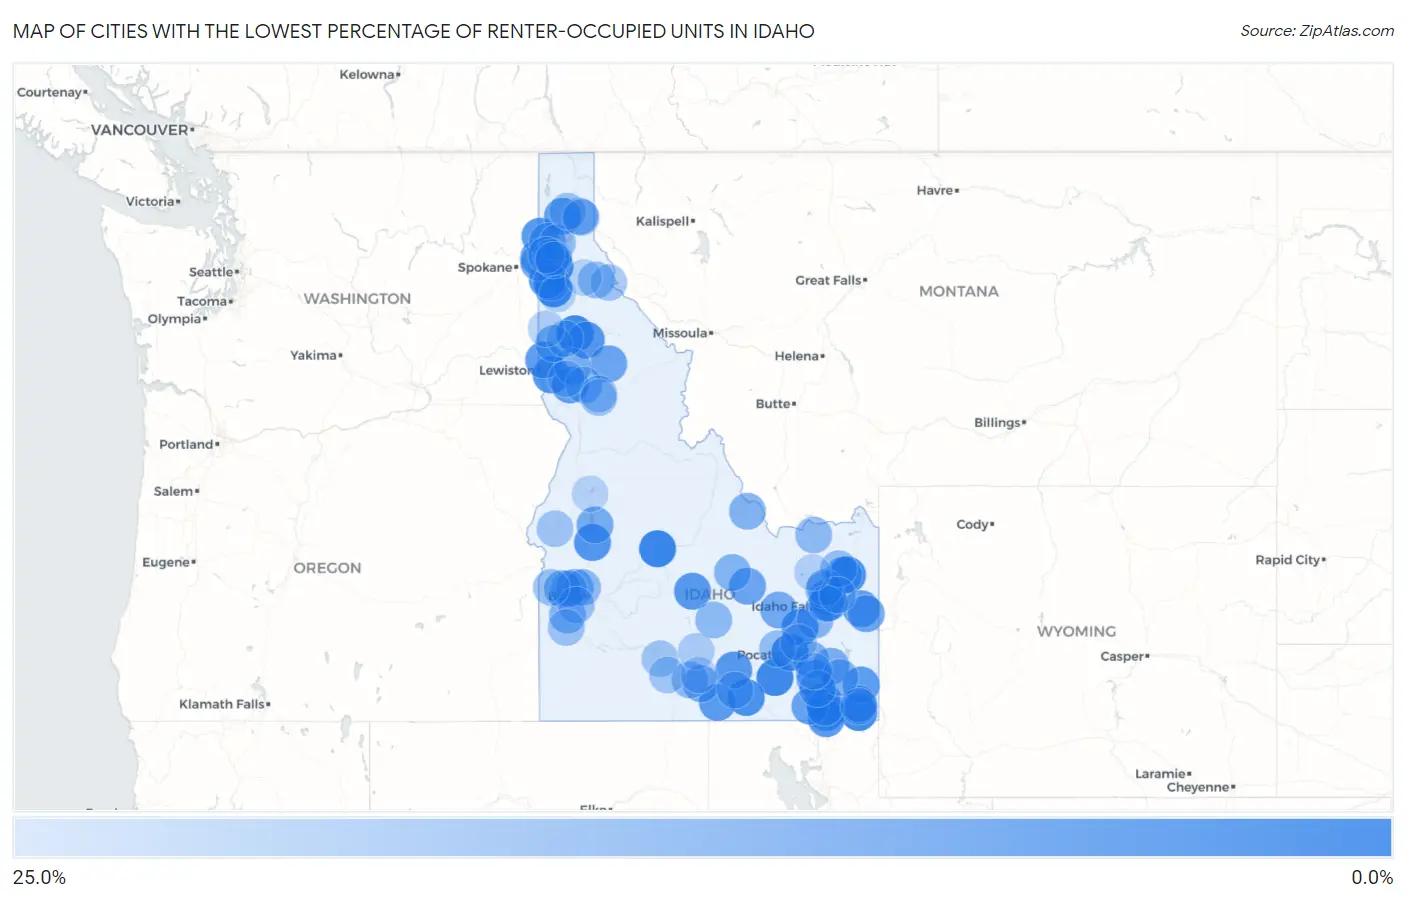
Cities with the Lowest Percentage of Renter-Occupied Units in Idaho
| City | % Renter-Occupied | vs State | vs National | |
| 1. | Stanley | 2.0% | 28.0% (-26.0)#1 | 35.2% (-33.2)#224 |
| 2. | Bovill | 2.7% | 28.0% (-25.3)#2 | 35.2% (-32.4)#424 |
| 3. | Conkling Park | 3.0% | 28.0% (-25.0)#3 | 35.2% (-32.2)#502 |
| 4. | Fernan Lake Village | 3.1% | 28.0% (-24.9)#4 | 35.2% (-32.1)#547 |
| 5. | Rockland | 3.2% | 28.0% (-24.8)#5 | 35.2% (-32.0)#583 |
| 6. | Avimor | 3.2% | 28.0% (-24.7)#6 | 35.2% (-31.9)#599 |
| 7. | Arbon Valley | 3.4% | 28.0% (-24.6)#7 | 35.2% (-31.8)#634 |
| 8. | St Charles | 3.6% | 28.0% (-24.4)#8 | 35.2% (-31.6)#702 |
| 9. | Newdale | 4.0% | 28.0% (-24.0)#9 | 35.2% (-31.2)#841 |
| 10. | Iona | 4.4% | 28.0% (-23.6)#10 | 35.2% (-30.8)#959 |
| 11. | Moreland | 5.0% | 28.0% (-23.0)#11 | 35.2% (-30.2)#1,210 |
| 12. | Malta | 5.2% | 28.0% (-22.8)#12 | 35.2% (-30.0)#1,296 |
| 13. | Rockford Bay | 5.5% | 28.0% (-22.5)#13 | 35.2% (-29.7)#1,439 |
| 14. | Smiths Ferry | 6.2% | 28.0% (-21.7)#14 | 35.2% (-28.9)#1,744 |
| 15. | Sweetwater | 6.3% | 28.0% (-21.6)#15 | 35.2% (-28.8)#1,782 |
| 16. | Blanchard | 6.4% | 28.0% (-21.6)#16 | 35.2% (-28.8)#1,809 |
| 17. | Oxford | 6.7% | 28.0% (-21.3)#17 | 35.2% (-28.5)#1,923 |
| 18. | Elk River | 6.9% | 28.0% (-21.0)#18 | 35.2% (-28.2)#2,030 |
| 19. | Sun Valley | 7.3% | 28.0% (-20.7)#19 | 35.2% (-27.9)#2,187 |
| 20. | Dayton | 7.4% | 28.0% (-20.6)#20 | 35.2% (-27.8)#2,252 |
| 21. | Acequia | 7.4% | 28.0% (-20.6)#21 | 35.2% (-27.8)#2,257 |
| 22. | Weston | 7.4% | 28.0% (-20.6)#22 | 35.2% (-27.8)#2,273 |
| 23. | Oakley | 7.7% | 28.0% (-20.3)#23 | 35.2% (-27.5)#2,370 |
| 24. | Arimo | 7.7% | 28.0% (-20.3)#24 | 35.2% (-27.5)#2,381 |
| 25. | Genesee | 7.9% | 28.0% (-20.1)#25 | 35.2% (-27.3)#2,480 |
| 26. | Georgetown | 8.0% | 28.0% (-20.0)#26 | 35.2% (-27.2)#2,552 |
| 27. | Hauser | 8.6% | 28.0% (-19.4)#27 | 35.2% (-26.6)#2,817 |
| 28. | Craigmont | 8.9% | 28.0% (-19.1)#28 | 35.2% (-26.2)#3,002 |
| 29. | Silverton | 8.9% | 28.0% (-19.1)#29 | 35.2% (-26.2)#3,004 |
| 30. | Dover | 9.3% | 28.0% (-18.7)#30 | 35.2% (-25.8)#3,235 |
| 31. | Swan Valley | 10.0% | 28.0% (-18.0)#31 | 35.2% (-25.2)#3,573 |
| 32. | Malad City | 10.0% | 28.0% (-18.0)#32 | 35.2% (-25.2)#3,612 |
| 33. | Pierce | 10.6% | 28.0% (-17.4)#33 | 35.2% (-24.5)#3,913 |
| 34. | Moore | 10.7% | 28.0% (-17.3)#34 | 35.2% (-24.5)#3,935 |
| 35. | Ucon | 10.7% | 28.0% (-17.3)#35 | 35.2% (-24.4)#3,978 |
| 36. | Irwin | 11.2% | 28.0% (-16.8)#36 | 35.2% (-24.0)#4,241 |
| 37. | Paris | 11.8% | 28.0% (-16.2)#37 | 35.2% (-23.4)#4,570 |
| 38. | Clifton | 12.1% | 28.0% (-15.9)#38 | 35.2% (-23.1)#4,713 |
| 39. | Teton | 12.3% | 28.0% (-15.7)#39 | 35.2% (-22.9)#4,865 |
| 40. | Atomic City | 12.5% | 28.0% (-15.5)#40 | 35.2% (-22.7)#5,000 |
| 41. | State Line | 12.5% | 28.0% (-15.5)#41 | 35.2% (-22.7)#5,003 |
| 42. | Spirit Lake | 12.6% | 28.0% (-15.4)#42 | 35.2% (-22.6)#5,048 |
| 43. | Cascade | 12.8% | 28.0% (-15.1)#43 | 35.2% (-22.3)#5,190 |
| 44. | Murtaugh | 13.0% | 28.0% (-15.0)#44 | 35.2% (-22.2)#5,263 |
| 45. | Eagle | 13.2% | 28.0% (-14.8)#45 | 35.2% (-22.0)#5,408 |
| 46. | Bancroft | 13.2% | 28.0% (-14.8)#46 | 35.2% (-22.0)#5,427 |
| 47. | Peck | 13.4% | 28.0% (-14.6)#47 | 35.2% (-21.8)#5,555 |
| 48. | Middleton | 13.7% | 28.0% (-14.3)#48 | 35.2% (-21.5)#5,709 |
| 49. | Troy | 13.7% | 28.0% (-14.3)#49 | 35.2% (-21.5)#5,742 |
| 50. | Hope | 14.3% | 28.0% (-13.7)#50 | 35.2% (-20.9)#6,111 |
| 51. | Leadore | 14.6% | 28.0% (-13.4)#51 | 35.2% (-20.5)#6,308 |
| 52. | Inkom | 14.7% | 28.0% (-13.3)#52 | 35.2% (-20.5)#6,358 |
| 53. | Mackay | 14.8% | 28.0% (-13.1)#53 | 35.2% (-20.3)#6,458 |
| 54. | Hayden Lake | 15.0% | 28.0% (-13.0)#54 | 35.2% (-20.2)#6,535 |
| 55. | Grace | 15.0% | 28.0% (-13.0)#55 | 35.2% (-20.2)#6,537 |
| 56. | Melba | 15.3% | 28.0% (-12.7)#56 | 35.2% (-19.9)#6,703 |
| 57. | Downey | 15.8% | 28.0% (-12.2)#57 | 35.2% (-19.4)#7,012 |
| 58. | Basalt | 15.9% | 28.0% (-12.1)#58 | 35.2% (-19.3)#7,062 |
| 59. | Nezperce | 16.1% | 28.0% (-11.8)#59 | 35.2% (-19.0)#7,241 |
| 60. | Lewisville | 16.3% | 28.0% (-11.7)#60 | 35.2% (-18.9)#7,329 |
| 61. | Carey | 16.3% | 28.0% (-11.7)#61 | 35.2% (-18.9)#7,335 |
| 62. | Spencer | 16.7% | 28.0% (-11.3)#62 | 35.2% (-18.5)#7,592 |
| 63. | Hidden Springs | 16.8% | 28.0% (-11.2)#63 | 35.2% (-18.4)#7,656 |
| 64. | Menan | 17.0% | 28.0% (-11.0)#64 | 35.2% (-18.1)#7,811 |
| 65. | Kimberly | 17.2% | 28.0% (-10.8)#65 | 35.2% (-17.9)#7,927 |
| 66. | Osburn | 17.2% | 28.0% (-10.8)#66 | 35.2% (-17.9)#7,930 |
| 67. | Albion | 17.2% | 28.0% (-10.8)#67 | 35.2% (-17.9)#7,937 |
| 68. | Harrison | 17.5% | 28.0% (-10.5)#68 | 35.2% (-17.7)#8,133 |
| 69. | Aberdeen | 17.7% | 28.0% (-10.3)#69 | 35.2% (-17.5)#8,280 |
| 70. | Athol | 17.8% | 28.0% (-10.2)#70 | 35.2% (-17.4)#8,360 |
| 71. | Parker | 17.9% | 28.0% (-10.1)#71 | 35.2% (-17.3)#8,411 |
| 72. | Star | 18.4% | 28.0% (-9.60)#72 | 35.2% (-16.8)#8,718 |
| 73. | Lincoln | 18.5% | 28.0% (-9.54)#73 | 35.2% (-16.7)#8,756 |
| 74. | Kooskia | 18.5% | 28.0% (-9.52)#74 | 35.2% (-16.7)#8,778 |
| 75. | Kuna | 18.5% | 28.0% (-9.45)#75 | 35.2% (-16.6)#8,828 |
| 76. | Notus | 18.8% | 28.0% (-9.14)#76 | 35.2% (-16.3)#9,049 |
| 77. | Murphy | 18.9% | 28.0% (-9.13)#77 | 35.2% (-16.3)#9,061 |
| 78. | Kootenai | 19.0% | 28.0% (-9.04)#78 | 35.2% (-16.2)#9,114 |
| 79. | Stites | 19.2% | 28.0% (-8.76)#79 | 35.2% (-16.0)#9,284 |
| 80. | Hagerman | 19.6% | 28.0% (-8.41)#80 | 35.2% (-15.6)#9,509 |
| 81. | Hayden | 19.6% | 28.0% (-8.35)#81 | 35.2% (-15.5)#9,541 |
| 82. | Midvale | 19.8% | 28.0% (-8.23)#82 | 35.2% (-15.4)#9,635 |
| 83. | Mullan | 19.9% | 28.0% (-8.13)#83 | 35.2% (-15.3)#9,708 |
| 84. | Buhl | 19.9% | 28.0% (-8.06)#84 | 35.2% (-15.3)#9,747 |
| 85. | Ririe | 20.1% | 28.0% (-7.85)#85 | 35.2% (-15.0)#9,929 |
| 86. | Deary | 20.2% | 28.0% (-7.82)#86 | 35.2% (-15.0)#9,954 |
| 87. | Rathdrum | 20.5% | 28.0% (-7.52)#87 | 35.2% (-14.7)#10,119 |
| 88. | Bloomington | 21.1% | 28.0% (-6.94)#88 | 35.2% (-14.1)#10,482 |
| 89. | Mccammon | 21.2% | 28.0% (-6.82)#89 | 35.2% (-14.0)#10,544 |
| 90. | East Hope | 21.4% | 28.0% (-6.56)#90 | 35.2% (-13.8)#10,716 |
| 91. | Fort Hall | 21.5% | 28.0% (-6.47)#91 | 35.2% (-13.7)#10,799 |
| 92. | Dietrich | 21.6% | 28.0% (-6.34)#92 | 35.2% (-13.5)#10,896 |
| 93. | Reubens | 21.7% | 28.0% (-6.25)#93 | 35.2% (-13.4)#10,962 |
| 94. | Potlatch | 22.1% | 28.0% (-5.89)#94 | 35.2% (-13.1)#11,198 |
| 95. | Parkline | 22.6% | 28.0% (-5.41)#95 | 35.2% (-12.6)#11,535 |
| 96. | Eden | 22.9% | 28.0% (-5.06)#96 | 35.2% (-12.2)#11,762 |
| 97. | Dalton Gardens | 23.1% | 28.0% (-4.93)#97 | 35.2% (-12.1)#11,835 |
| 98. | Hamer | 23.1% | 28.0% (-4.92)#98 | 35.2% (-12.1)#11,864 |
| 99. | Pinehurst | 23.6% | 28.0% (-4.35)#99 | 35.2% (-11.5)#12,250 |
| 100. | Mccall | 23.7% | 28.0% (-4.34)#100 | 35.2% (-11.5)#12,261 |
Common Questions
What are the Top 10 Cities with the Lowest Percentage of Renter-Occupied Units in Idaho?
Top 10 Cities with the Lowest Percentage of Renter-Occupied Units in Idaho are:
#1
2.0%
#2
2.7%
#3
3.0%
#4
3.1%
#5
3.2%
#6
3.4%
#7
3.6%
#8
4.0%
#9
4.4%
#10
5.0%
What city has the Lowest Percentage of Renter-Occupied Units in Idaho?
Stanley has the Lowest Percentage of Renter-Occupied Units in Idaho with 2.0%.
What is the Percentage of Renter-Occupied Units in the State of Idaho?
Percentage of Renter-Occupied Units in Idaho is 28.0%.
What is the Percentage of Renter-Occupied Units in the United States?
Percentage of Renter-Occupied Units in the United States is 35.2%.