Cities with the Lowest Percentage of Renter-Occupied Units in Utah
RELATED REPORTS & OPTIONS
Lowest Renter-Occupied
Utah
Compare Cities
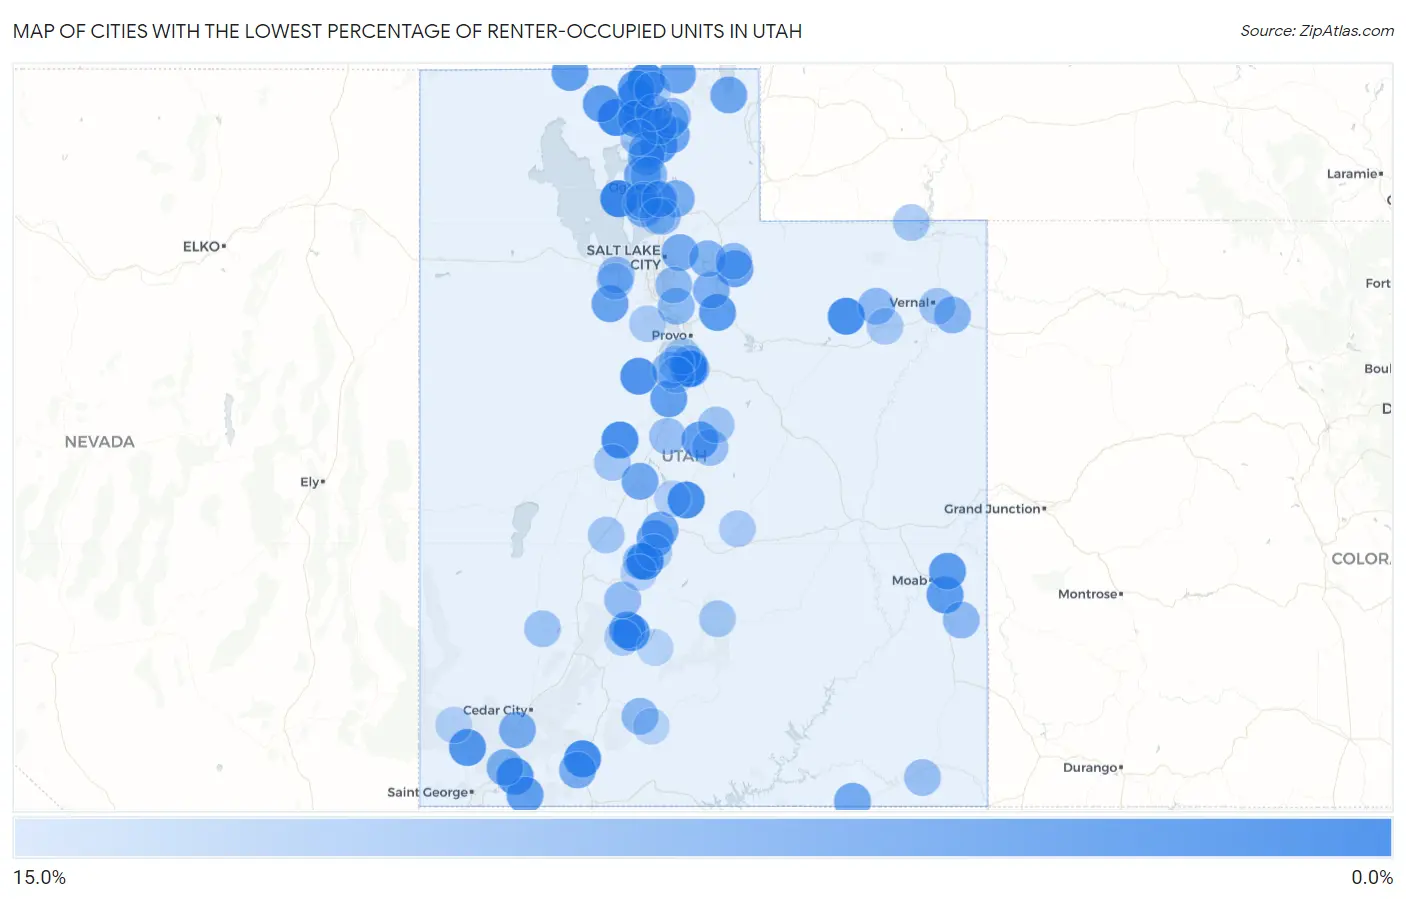
Map of Cities with the Lowest Percentage of Renter-Occupied Units in Utah
15.0%
0.0%
Cities with the Lowest Percentage of Renter-Occupied Units in Utah
| City | % Renter-Occupied | vs State | vs National | |
| 1. | Elk Ridge | 0.49% | 29.3%(-28.8)#1 | 35.2%(-34.7)#12 |
| 2. | Annabella | 0.74% | 29.3%(-28.5)#2 | 35.2%(-34.4)#34 |
| 3. | Hooper | 0.87% | 29.3%(-28.4)#3 | 35.2%(-34.3)#47 |
| 4. | Thatcher | 1.5% | 29.3%(-27.8)#4 | 35.2%(-33.7)#119 |
| 5. | Clarkston | 1.5% | 29.3%(-27.8)#5 | 35.2%(-33.7)#123 |
| 6. | Glendale | 1.7% | 29.3%(-27.6)#6 | 35.2%(-33.5)#161 |
| 7. | Altamont | 2.1% | 29.3%(-27.2)#7 | 35.2%(-33.1)#242 |
| 8. | Leamington | 2.2% | 29.3%(-27.1)#8 | 35.2%(-33.0)#264 |
| 9. | Mayfield | 2.4% | 29.3%(-26.9)#9 | 35.2%(-32.8)#308 |
| 10. | Eureka | 2.9% | 29.3%(-26.4)#10 | 35.2%(-32.3)#469 |
| 11. | Deweyville | 3.2% | 29.3%(-26.1)#11 | 35.2%(-32.0)#562 |
| 12. | Central | 3.2% | 29.3%(-26.1)#12 | 35.2%(-32.0)#567 |
| 13. | Kingston | 3.2% | 29.3%(-26.1)#13 | 35.2%(-32.0)#580 |
| 14. | Virgin | 3.2% | 29.3%(-26.0)#14 | 35.2%(-31.9)#594 |
| 15. | Mantua | 3.5% | 29.3%(-25.8)#15 | 35.2%(-31.7)#664 |
| 16. | Riverside | 3.6% | 29.3%(-25.7)#16 | 35.2%(-31.6)#709 |
| 17. | Spanish Valley | 4.0% | 29.3%(-25.3)#17 | 35.2%(-31.2)#840 |
| 18. | Wallsburg | 4.1% | 29.3%(-25.2)#18 | 35.2%(-31.1)#858 |
| 19. | Castle Valley | 4.3% | 29.3%(-25.0)#19 | 35.2%(-30.9)#936 |
| 20. | Howell | 4.4% | 29.3%(-24.8)#20 | 35.2%(-30.7)#983 |
| 21. | Moroni | 4.6% | 29.3%(-24.7)#21 | 35.2%(-30.6)#1,043 |
| 22. | Mona | 4.6% | 29.3%(-24.7)#22 | 35.2%(-30.6)#1,057 |
| 23. | Snowville | 4.6% | 29.3%(-24.7)#23 | 35.2%(-30.6)#1,064 |
| 24. | Plymouth | 4.7% | 29.3%(-24.6)#24 | 35.2%(-30.5)#1,091 |
| 25. | South Weber | 4.8% | 29.3%(-24.5)#25 | 35.2%(-30.4)#1,147 |
| 26. | Apple Valley | 4.8% | 29.3%(-24.4)#26 | 35.2%(-30.3)#1,152 |
| 27. | Junction | 5.0% | 29.3%(-24.3)#27 | 35.2%(-30.2)#1,205 |
| 28. | Elwood | 5.0% | 29.3%(-24.3)#28 | 35.2%(-30.2)#1,214 |
| 29. | Stockton | 5.2% | 29.3%(-24.1)#29 | 35.2%(-30.0)#1,310 |
| 30. | Marion | 5.3% | 29.3%(-24.0)#30 | 35.2%(-29.9)#1,357 |
| 31. | Sigurd | 5.4% | 29.3%(-23.8)#31 | 35.2%(-29.7)#1,404 |
| 32. | Cove | 5.6% | 29.3%(-23.7)#32 | 35.2%(-29.6)#1,457 |
| 33. | Paradise | 5.7% | 29.3%(-23.6)#33 | 35.2%(-29.5)#1,516 |
| 34. | Laketown | 5.9% | 29.3%(-23.4)#34 | 35.2%(-29.3)#1,588 |
| 35. | Aurora | 6.1% | 29.3%(-23.2)#35 | 35.2%(-29.1)#1,680 |
| 36. | Scipio | 6.2% | 29.3%(-23.1)#36 | 35.2%(-29.0)#1,716 |
| 37. | Perry | 6.3% | 29.3%(-23.0)#37 | 35.2%(-28.9)#1,754 |
| 38. | Plain City | 6.4% | 29.3%(-22.9)#38 | 35.2%(-28.8)#1,801 |
| 39. | Oljato Monument Valley | 6.5% | 29.3%(-22.8)#39 | 35.2%(-28.7)#1,823 |
| 40. | Emigration Canyon | 6.7% | 29.3%(-22.6)#40 | 35.2%(-28.5)#1,902 |
| 41. | Orderville | 6.9% | 29.3%(-22.4)#41 | 35.2%(-28.3)#1,996 |
| 42. | Mountain Green | 7.0% | 29.3%(-22.3)#42 | 35.2%(-28.2)#2,065 |
| 43. | Kanarraville | 7.0% | 29.3%(-22.2)#43 | 35.2%(-28.2)#2,070 |
| 44. | Toquerville | 7.1% | 29.3%(-22.2)#44 | 35.2%(-28.1)#2,116 |
| 45. | Syracuse | 7.4% | 29.3%(-21.9)#45 | 35.2%(-27.8)#2,266 |
| 46. | Salem | 7.5% | 29.3%(-21.8)#46 | 35.2%(-27.7)#2,282 |
| 47. | Interlaken | 7.7% | 29.3%(-21.6)#47 | 35.2%(-27.5)#2,404 |
| 48. | Willard | 8.1% | 29.3%(-21.1)#48 | 35.2%(-27.0)#2,610 |
| 49. | Silver Summit | 8.3% | 29.3%(-21.0)#49 | 35.2%(-26.9)#2,669 |
| 50. | Genola | 8.4% | 29.3%(-20.9)#50 | 35.2%(-26.8)#2,721 |
| 51. | Jensen | 8.4% | 29.3%(-20.9)#51 | 35.2%(-26.8)#2,723 |
| 52. | Farr West | 8.5% | 29.3%(-20.7)#52 | 35.2%(-26.6)#2,790 |
| 53. | Central Valley | 8.8% | 29.3%(-20.5)#53 | 35.2%(-26.4)#2,928 |
| 54. | Highland | 8.9% | 29.3%(-20.4)#54 | 35.2%(-26.3)#2,985 |
| 55. | Oakley | 9.0% | 29.3%(-20.3)#55 | 35.2%(-26.2)#3,015 |
| 56. | Neola | 9.0% | 29.3%(-20.3)#56 | 35.2%(-26.2)#3,032 |
| 57. | Tropic | 9.0% | 29.3%(-20.3)#57 | 35.2%(-26.2)#3,053 |
| 58. | Woodland Hills | 9.0% | 29.3%(-20.3)#58 | 35.2%(-26.2)#3,061 |
| 59. | La Sal | 9.0% | 29.3%(-20.2)#59 | 35.2%(-26.2)#3,069 |
| 60. | Millville | 9.0% | 29.3%(-20.2)#60 | 35.2%(-26.2)#3,071 |
| 61. | Fruit Heights | 9.1% | 29.3%(-20.1)#61 | 35.2%(-26.0)#3,148 |
| 62. | Granite | 9.2% | 29.3%(-20.1)#62 | 35.2%(-26.0)#3,173 |
| 63. | Stansbury Park | 9.2% | 29.3%(-20.1)#63 | 35.2%(-26.0)#3,177 |
| 64. | East Basin | 9.3% | 29.3%(-20.0)#64 | 35.2%(-25.9)#3,212 |
| 65. | Nibley | 9.3% | 29.3%(-19.9)#65 | 35.2%(-25.8)#3,234 |
| 66. | Wellsville | 9.4% | 29.3%(-19.9)#66 | 35.2%(-25.8)#3,263 |
| 67. | West Point | 9.5% | 29.3%(-19.8)#67 | 35.2%(-25.7)#3,291 |
| 68. | Marysvale | 9.7% | 29.3%(-19.6)#68 | 35.2%(-25.5)#3,398 |
| 69. | White | 9.8% | 29.3%(-19.5)#69 | 35.2%(-25.4)#3,482 |
| 70. | Tselakai Dezza | 10.0% | 29.3%(-19.3)#70 | 35.2%(-25.2)#3,589 |
| 71. | Clinton | 10.0% | 29.3%(-19.2)#71 | 35.2%(-25.1)#3,615 |
| 72. | Mendon | 10.1% | 29.3%(-19.2)#72 | 35.2%(-25.1)#3,628 |
| 73. | Levan | 10.2% | 29.3%(-19.1)#73 | 35.2%(-25.0)#3,681 |
| 74. | Spring City | 10.2% | 29.3%(-19.1)#74 | 35.2%(-25.0)#3,692 |
| 75. | Minersville | 10.5% | 29.3%(-18.7)#75 | 35.2%(-24.6)#3,869 |
| 76. | Fairview | 10.7% | 29.3%(-18.6)#76 | 35.2%(-24.5)#3,926 |
| 77. | Naples | 10.7% | 29.3%(-18.6)#77 | 35.2%(-24.5)#3,939 |
| 78. | Erda | 10.8% | 29.3%(-18.5)#78 | 35.2%(-24.4)#3,996 |
| 79. | Meadow | 10.9% | 29.3%(-18.4)#79 | 35.2%(-24.3)#4,066 |
| 80. | Oak City | 10.9% | 29.3%(-18.4)#80 | 35.2%(-24.3)#4,071 |
| 81. | Corinne | 11.0% | 29.3%(-18.3)#81 | 35.2%(-24.2)#4,105 |
| 82. | Torrey | 11.1% | 29.3%(-18.2)#82 | 35.2%(-24.1)#4,175 |
| 83. | Manila | 11.2% | 29.3%(-18.1)#83 | 35.2%(-24.0)#4,236 |
| 84. | Benjamin | 11.3% | 29.3%(-18.0)#84 | 35.2%(-23.9)#4,277 |
| 85. | Ballard | 11.4% | 29.3%(-17.9)#85 | 35.2%(-23.8)#4,302 |
| 86. | Glenwood | 11.5% | 29.3%(-17.7)#86 | 35.2%(-23.6)#4,409 |
| 87. | Eagle Mountain | 11.7% | 29.3%(-17.6)#87 | 35.2%(-23.5)#4,501 |
| 88. | Emery | 11.8% | 29.3%(-17.5)#88 | 35.2%(-23.4)#4,567 |
| 89. | Circleville | 12.0% | 29.3%(-17.3)#89 | 35.2%(-23.2)#4,663 |
| 90. | Kaysville | 12.1% | 29.3%(-17.2)#90 | 35.2%(-23.1)#4,721 |
| 91. | Centerfield | 12.1% | 29.3%(-17.1)#91 | 35.2%(-23.0)#4,755 |
| 92. | Newton | 12.2% | 29.3%(-17.0)#92 | 35.2%(-22.9)#4,814 |
| 93. | Monroe | 12.6% | 29.3%(-16.7)#93 | 35.2%(-22.6)#5,046 |
| 94. | Enterprise | 12.7% | 29.3%(-16.6)#94 | 35.2%(-22.5)#5,083 |
| 95. | West Mountain | 12.7% | 29.3%(-16.6)#95 | 35.2%(-22.5)#5,086 |
| 96. | Santaquin | 12.7% | 29.3%(-16.5)#96 | 35.2%(-22.5)#5,120 |
| 97. | Antimony | 12.8% | 29.3%(-16.5)#97 | 35.2%(-22.4)#5,144 |
| 98. | Brighton | 12.8% | 29.3%(-16.5)#98 | 35.2%(-22.4)#5,149 |
| 99. | Henrieville | 12.9% | 29.3%(-16.4)#99 | 35.2%(-22.3)#5,208 |
| 100. | Uintah | 13.0% | 29.3%(-16.3)#100 | 35.2%(-22.2)#5,312 |
Common Questions
What are the Top 10 Cities with the Lowest Percentage of Renter-Occupied Units in Utah?
Top 10 Cities with the Lowest Percentage of Renter-Occupied Units in Utah are:
What city has the Lowest Percentage of Renter-Occupied Units in Utah?
Elk Ridge has the Lowest Percentage of Renter-Occupied Units in Utah with 0.49%.
What is the Percentage of Renter-Occupied Units in the State of Utah?
Percentage of Renter-Occupied Units in Utah is 29.3%.
What is the Percentage of Renter-Occupied Units in the United States?
Percentage of Renter-Occupied Units in the United States is 35.2%.