Cities with the Lowest Percentage of Renter-Occupied Units in Kansas
RELATED REPORTS & OPTIONS
Lowest Renter-Occupied
Kansas
Compare Cities
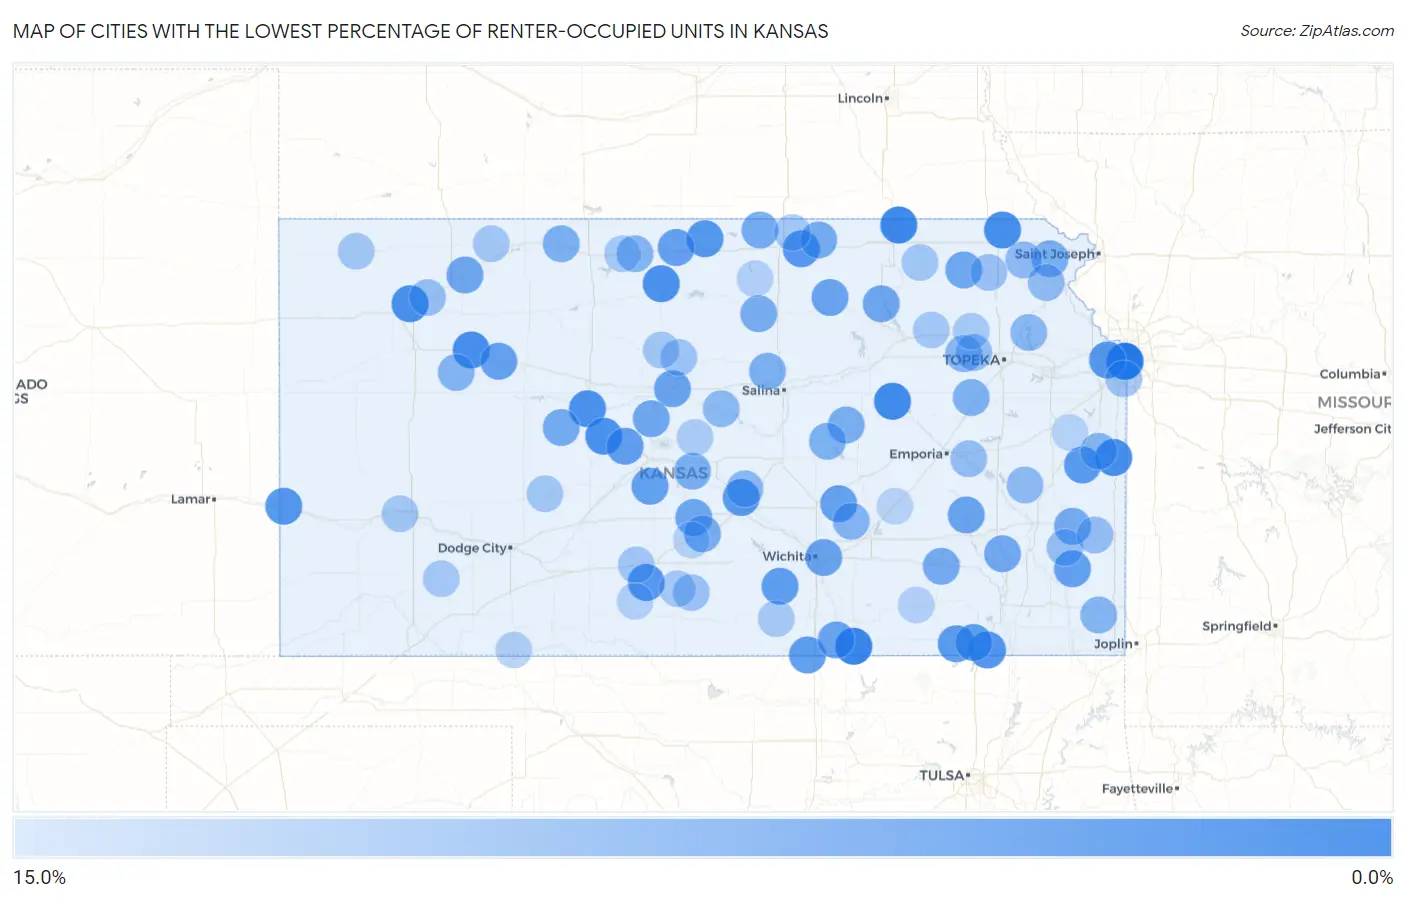
Map of Cities with the Lowest Percentage of Renter-Occupied Units in Kansas
15.0%
0.0%
Cities with the Lowest Percentage of Renter-Occupied Units in Kansas
| City | % Renter-Occupied | vs State | vs National | |
| 1. | Parkerfield | 0.95% | 33.1%(-32.2)#1 | 35.2%(-34.2)#52 |
| 2. | Oketo | 1.3% | 33.1%(-31.8)#2 | 35.2%(-33.9)#97 |
| 3. | Parkerville | 1.6% | 33.1%(-31.6)#3 | 35.2%(-33.6)#142 |
| 4. | Mission Woods | 1.6% | 33.1%(-31.5)#4 | 35.2%(-33.5)#151 |
| 5. | Morrill | 1.9% | 33.1%(-31.3)#5 | 35.2%(-33.3)#194 |
| 6. | Park | 2.0% | 33.1%(-31.1)#6 | 35.2%(-33.1)#227 |
| 7. | Linn Valley | 2.1% | 33.1%(-31.0)#7 | 35.2%(-33.1)#244 |
| 8. | Gem | 2.1% | 33.1%(-31.0)#8 | 35.2%(-33.1)#248 |
| 9. | Portis | 2.3% | 33.1%(-30.9)#9 | 35.2%(-32.9)#280 |
| 10. | Schoenchen | 2.4% | 33.1%(-30.7)#10 | 35.2%(-32.8)#320 |
| 11. | Bison | 2.5% | 33.1%(-30.6)#11 | 35.2%(-32.7)#353 |
| 12. | Westwood Hills | 2.8% | 33.1%(-30.3)#12 | 35.2%(-32.4)#445 |
| 13. | Tyro | 2.8% | 33.1%(-30.3)#13 | 35.2%(-32.4)#451 |
| 14. | Coolidge | 3.0% | 33.1%(-30.1)#14 | 35.2%(-32.2)#520 |
| 15. | Burr Oak | 3.1% | 33.1%(-30.1)#15 | 35.2%(-32.1)#537 |
| 16. | Lake Quivira | 3.2% | 33.1%(-29.9)#16 | 35.2%(-32.0)#578 |
| 17. | Cuba | 3.2% | 33.1%(-29.9)#17 | 35.2%(-32.0)#582 |
| 18. | Coats | 3.3% | 33.1%(-29.8)#18 | 35.2%(-31.9)#617 |
| 19. | Willowbrook | 3.4% | 33.1%(-29.7)#19 | 35.2%(-31.7)#657 |
| 20. | Peru | 3.5% | 33.1%(-29.6)#20 | 35.2%(-31.7)#683 |
| 21. | Parker | 3.5% | 33.1%(-29.6)#21 | 35.2%(-31.6)#691 |
| 22. | Havana | 3.7% | 33.1%(-29.4)#22 | 35.2%(-31.5)#744 |
| 23. | Hunnewell | 3.8% | 33.1%(-29.3)#23 | 35.2%(-31.3)#797 |
| 24. | Viola | 3.9% | 33.1%(-29.2)#24 | 35.2%(-31.3)#820 |
| 25. | Albert | 4.2% | 33.1%(-29.0)#25 | 35.2%(-31.0)#888 |
| 26. | Walnut | 4.2% | 33.1%(-28.9)#26 | 35.2%(-31.0)#912 |
| 27. | Seward | 4.3% | 33.1%(-28.8)#27 | 35.2%(-30.8)#951 |
| 28. | Lebanon | 4.4% | 33.1%(-28.7)#28 | 35.2%(-30.7)#985 |
| 29. | Elbing | 4.5% | 33.1%(-28.6)#29 | 35.2%(-30.6)#1,026 |
| 30. | Collyer | 4.7% | 33.1%(-28.5)#30 | 35.2%(-30.5)#1,081 |
| 31. | Eastborough | 4.8% | 33.1%(-28.4)#31 | 35.2%(-30.4)#1,117 |
| 32. | Geuda Springs | 4.8% | 33.1%(-28.4)#32 | 35.2%(-30.4)#1,119 |
| 33. | Morganville | 4.8% | 33.1%(-28.4)#33 | 35.2%(-30.4)#1,120 |
| 34. | Pilsen | 4.8% | 33.1%(-28.4)#34 | 35.2%(-30.4)#1,124 |
| 35. | Virgil | 4.8% | 33.1%(-28.4)#35 | 35.2%(-30.4)#1,131 |
| 36. | Dorrance | 4.8% | 33.1%(-28.3)#36 | 35.2%(-30.4)#1,145 |
| 37. | Sylvia | 5.1% | 33.1%(-28.0)#37 | 35.2%(-30.1)#1,269 |
| 38. | Randolph | 5.3% | 33.1%(-27.9)#38 | 35.2%(-29.9)#1,327 |
| 39. | Corning | 5.3% | 33.1%(-27.9)#39 | 35.2%(-29.9)#1,329 |
| 40. | Dresden | 5.3% | 33.1%(-27.9)#40 | 35.2%(-29.9)#1,338 |
| 41. | Susank | 5.3% | 33.1%(-27.9)#41 | 35.2%(-29.9)#1,339 |
| 42. | Buffalo | 5.4% | 33.1%(-27.8)#42 | 35.2%(-29.8)#1,375 |
| 43. | Mccracken | 5.6% | 33.1%(-27.6)#43 | 35.2%(-29.6)#1,468 |
| 44. | Haddam | 5.7% | 33.1%(-27.4)#44 | 35.2%(-29.5)#1,529 |
| 45. | Severy | 5.8% | 33.1%(-27.4)#45 | 35.2%(-29.4)#1,552 |
| 46. | Bronson | 5.8% | 33.1%(-27.4)#46 | 35.2%(-29.4)#1,557 |
| 47. | Republic | 5.8% | 33.1%(-27.4)#47 | 35.2%(-29.4)#1,562 |
| 48. | Glasco | 5.9% | 33.1%(-27.3)#48 | 35.2%(-29.3)#1,586 |
| 49. | Langdon | 5.9% | 33.1%(-27.3)#49 | 35.2%(-29.3)#1,604 |
| 50. | Ramona | 6.1% | 33.1%(-27.1)#50 | 35.2%(-29.1)#1,672 |
| 51. | Prairie View | 6.2% | 33.1%(-26.9)#51 | 35.2%(-28.9)#1,742 |
| 52. | Raymond | 6.2% | 33.1%(-26.9)#52 | 35.2%(-28.9)#1,743 |
| 53. | Culver | 6.2% | 33.1%(-26.9)#53 | 35.2%(-28.9)#1,747 |
| 54. | Denton | 6.3% | 33.1%(-26.8)#54 | 35.2%(-28.8)#1,783 |
| 55. | Durham | 6.5% | 33.1%(-26.7)#55 | 35.2%(-28.7)#1,832 |
| 56. | Harveyville | 6.7% | 33.1%(-26.5)#56 | 35.2%(-28.5)#1,913 |
| 57. | Potwin | 6.9% | 33.1%(-26.2)#57 | 35.2%(-28.3)#2,014 |
| 58. | Gove City | 7.0% | 33.1%(-26.2)#58 | 35.2%(-28.2)#2,046 |
| 59. | Fontana | 7.1% | 33.1%(-26.0)#59 | 35.2%(-28.0)#2,125 |
| 60. | Roseland | 7.1% | 33.1%(-26.0)#60 | 35.2%(-28.0)#2,147 |
| 61. | Athol | 7.1% | 33.1%(-26.0)#61 | 35.2%(-28.0)#2,148 |
| 62. | Maple Hill | 7.3% | 33.1%(-25.8)#62 | 35.2%(-27.9)#2,222 |
| 63. | The Highlands | 7.5% | 33.1%(-25.7)#63 | 35.2%(-27.7)#2,296 |
| 64. | Ozawkie | 7.5% | 33.1%(-25.6)#64 | 35.2%(-27.7)#2,300 |
| 65. | Kanopolis | 7.6% | 33.1%(-25.5)#65 | 35.2%(-27.6)#2,358 |
| 66. | Westphalia | 7.7% | 33.1%(-25.5)#66 | 35.2%(-27.5)#2,391 |
| 67. | Willis | 7.7% | 33.1%(-25.5)#67 | 35.2%(-27.5)#2,412 |
| 68. | Lancaster | 7.9% | 33.1%(-25.3)#68 | 35.2%(-27.3)#2,499 |
| 69. | Tecumseh | 8.2% | 33.1%(-25.0)#69 | 35.2%(-27.0)#2,613 |
| 70. | Neosho Rapids | 8.3% | 33.1%(-24.8)#70 | 35.2%(-26.9)#2,685 |
| 71. | Savonburg | 8.3% | 33.1%(-24.8)#71 | 35.2%(-26.9)#2,698 |
| 72. | Willard | 8.3% | 33.1%(-24.8)#72 | 35.2%(-26.9)#2,699 |
| 73. | Redfield | 8.3% | 33.1%(-24.8)#73 | 35.2%(-26.9)#2,702 |
| 74. | Rexford | 8.4% | 33.1%(-24.7)#74 | 35.2%(-26.7)#2,746 |
| 75. | Wetmore | 8.6% | 33.1%(-24.5)#75 | 35.2%(-26.6)#2,828 |
| 76. | Nashville | 8.7% | 33.1%(-24.5)#76 | 35.2%(-26.5)#2,884 |
| 77. | Lucas | 8.9% | 33.1%(-24.2)#77 | 35.2%(-26.2)#3,012 |
| 78. | Leawood | 9.0% | 33.1%(-24.1)#78 | 35.2%(-26.2)#3,060 |
| 79. | Cullison | 9.3% | 33.1%(-23.8)#79 | 35.2%(-25.9)#3,219 |
| 80. | Frankfort | 9.3% | 33.1%(-23.8)#80 | 35.2%(-25.8)#3,236 |
| 81. | Hanston | 9.4% | 33.1%(-23.8)#81 | 35.2%(-25.8)#3,252 |
| 82. | Norcatur | 9.4% | 33.1%(-23.8)#82 | 35.2%(-25.8)#3,253 |
| 83. | Mcdonald | 9.4% | 33.1%(-23.7)#83 | 35.2%(-25.7)#3,279 |
| 84. | Luray | 9.5% | 33.1%(-23.7)#84 | 35.2%(-25.7)#3,293 |
| 85. | Holcomb | 9.5% | 33.1%(-23.6)#85 | 35.2%(-25.7)#3,319 |
| 86. | Copeland | 9.5% | 33.1%(-23.6)#86 | 35.2%(-25.7)#3,325 |
| 87. | Isabel | 9.5% | 33.1%(-23.6)#87 | 35.2%(-25.7)#3,339 |
| 88. | Louisville | 9.6% | 33.1%(-23.6)#88 | 35.2%(-25.6)#3,360 |
| 89. | Munden | 9.6% | 33.1%(-23.5)#89 | 35.2%(-25.6)#3,381 |
| 90. | Kensington | 9.7% | 33.1%(-23.4)#90 | 35.2%(-25.5)#3,425 |
| 91. | Milan | 9.8% | 33.1%(-23.4)#91 | 35.2%(-25.4)#3,451 |
| 92. | Delia | 9.8% | 33.1%(-23.4)#92 | 35.2%(-25.4)#3,465 |
| 93. | Bushton | 10.1% | 33.1%(-23.0)#93 | 35.2%(-25.0)#3,670 |
| 94. | Englewood | 10.3% | 33.1%(-22.9)#94 | 35.2%(-24.9)#3,731 |
| 95. | Sun City | 10.5% | 33.1%(-22.6)#95 | 35.2%(-24.7)#3,863 |
| 96. | Jamestown | 10.6% | 33.1%(-22.5)#96 | 35.2%(-24.5)#3,916 |
| 97. | Grenola | 10.7% | 33.1%(-22.5)#97 | 35.2%(-24.5)#3,936 |
| 98. | Turon | 10.7% | 33.1%(-22.4)#98 | 35.2%(-24.5)#3,962 |
| 99. | Rantoul | 10.7% | 33.1%(-22.4)#99 | 35.2%(-24.5)#3,968 |
| 100. | Cassoday | 10.9% | 33.1%(-22.2)#100 | 35.2%(-24.2)#4,090 |
Common Questions
What are the Top 10 Cities with the Lowest Percentage of Renter-Occupied Units in Kansas?
Top 10 Cities with the Lowest Percentage of Renter-Occupied Units in Kansas are:
#1
0.95%
#2
1.3%
#3
1.6%
#4
1.6%
#5
1.9%
#6
2.0%
#7
2.1%
#8
2.1%
#9
2.3%
#10
2.4%
What city has the Lowest Percentage of Renter-Occupied Units in Kansas?
Parkerfield has the Lowest Percentage of Renter-Occupied Units in Kansas with 0.95%.
What is the Percentage of Renter-Occupied Units in the State of Kansas?
Percentage of Renter-Occupied Units in Kansas is 33.1%.
What is the Percentage of Renter-Occupied Units in the United States?
Percentage of Renter-Occupied Units in the United States is 35.2%.