Cities with the Lowest Percentage of Renter-Occupied Units in Pennsylvania
RELATED REPORTS & OPTIONS
Lowest Renter-Occupied
Pennsylvania
Compare Cities
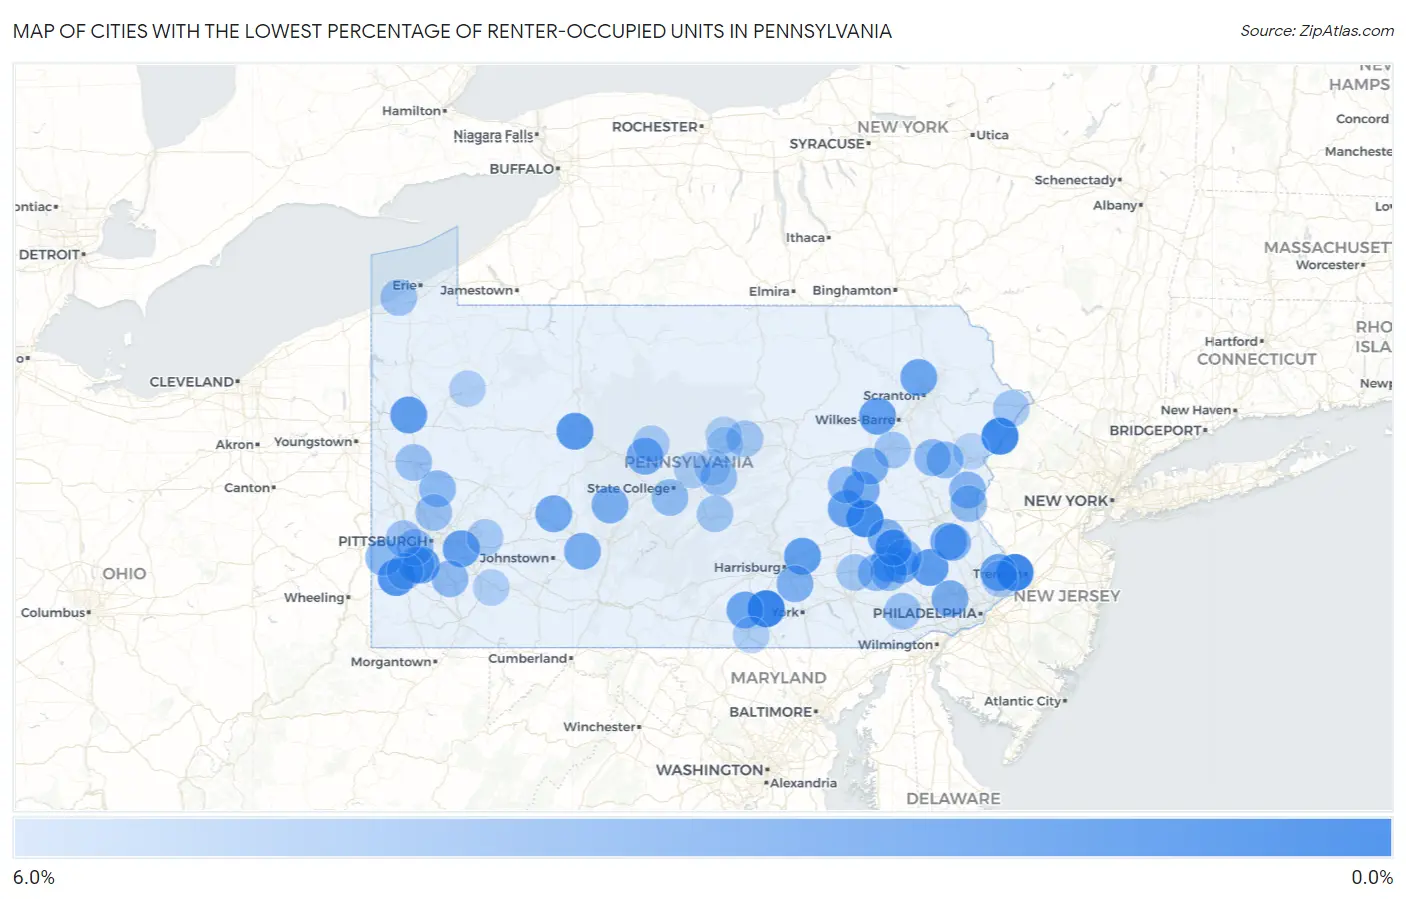
Map of Cities with the Lowest Percentage of Renter-Occupied Units in Pennsylvania
6.0%
0.0%
Cities with the Lowest Percentage of Renter-Occupied Units in Pennsylvania
| City | % Renter-Occupied | vs State | vs National | |
| 1. | Lake Meade | 0.46% | 30.8%(-30.4)#1 | 35.2%(-34.7)#10 |
| 2. | Woodside | 0.60% | 30.8%(-30.2)#2 | 35.2%(-34.6)#20 |
| 3. | Pine Ridge | 0.76% | 30.8%(-30.0)#3 | 35.2%(-34.4)#38 |
| 4. | Mckinley | 0.82% | 30.8%(-30.0)#4 | 35.2%(-34.4)#44 |
| 5. | Lake Wynonah | 0.97% | 30.8%(-29.8)#5 | 35.2%(-34.2)#55 |
| 6. | Wolfdale | 1.5% | 30.8%(-29.3)#6 | 35.2%(-33.7)#127 |
| 7. | Treasure Lake | 1.8% | 30.8%(-29.0)#7 | 35.2%(-33.4)#172 |
| 8. | Thornburg Borough | 1.9% | 30.8%(-28.9)#8 | 35.2%(-33.3)#188 |
| 9. | Pottsgrove | 1.9% | 30.8%(-28.9)#9 | 35.2%(-33.3)#202 |
| 10. | Lake Latonka | 2.0% | 30.8%(-28.8)#10 | 35.2%(-33.2)#222 |
| 11. | Skyline View | 2.1% | 30.8%(-28.7)#11 | 35.2%(-33.1)#235 |
| 12. | Mcmurray | 2.1% | 30.8%(-28.7)#12 | 35.2%(-33.1)#240 |
| 13. | Level Green | 2.1% | 30.8%(-28.7)#13 | 35.2%(-33.1)#246 |
| 14. | Silkworth | 2.2% | 30.8%(-28.7)#14 | 35.2%(-33.0)#255 |
| 15. | Ashville Borough | 2.2% | 30.8%(-28.6)#15 | 35.2%(-33.0)#266 |
| 16. | Sewickley Hills Borough | 2.3% | 30.8%(-28.5)#16 | 35.2%(-32.9)#279 |
| 17. | Twilight Borough | 2.3% | 30.8%(-28.5)#17 | 35.2%(-32.9)#286 |
| 18. | Richboro | 2.4% | 30.8%(-28.4)#18 | 35.2%(-32.8)#318 |
| 19. | Newtown | 2.4% | 30.8%(-28.4)#19 | 35.2%(-32.8)#322 |
| 20. | Villanova | 2.4% | 30.8%(-28.4)#20 | 35.2%(-32.8)#325 |
| 21. | Aspers | 2.4% | 30.8%(-28.4)#21 | 35.2%(-32.7)#332 |
| 22. | Glen Hope Borough | 2.4% | 30.8%(-28.4)#22 | 35.2%(-32.7)#333 |
| 23. | Manor Borough | 2.4% | 30.8%(-28.4)#23 | 35.2%(-32.7)#335 |
| 24. | Waverly | 2.5% | 30.8%(-28.4)#24 | 35.2%(-32.7)#336 |
| 25. | Muhlenberg Park | 2.5% | 30.8%(-28.3)#25 | 35.2%(-32.7)#358 |
| 26. | Grassflat | 2.7% | 30.8%(-28.1)#26 | 35.2%(-32.5)#422 |
| 27. | Heilwood | 2.7% | 30.8%(-28.1)#27 | 35.2%(-32.5)#423 |
| 28. | Rosslyn Farms Borough | 2.8% | 30.8%(-28.1)#28 | 35.2%(-32.4)#428 |
| 29. | Spinnerstown | 2.8% | 30.8%(-28.0)#29 | 35.2%(-32.4)#433 |
| 30. | Pennwyn | 2.8% | 30.8%(-28.0)#30 | 35.2%(-32.4)#434 |
| 31. | Gibraltar | 2.8% | 30.8%(-28.0)#31 | 35.2%(-32.4)#450 |
| 32. | Rose Valley Borough | 2.9% | 30.8%(-28.0)#32 | 35.2%(-32.3)#458 |
| 33. | Aaronsburg Cdp Centre County | 2.9% | 30.8%(-27.9)#33 | 35.2%(-32.3)#470 |
| 34. | Thompsonville | 2.9% | 30.8%(-27.9)#34 | 35.2%(-32.2)#486 |
| 35. | Altamont | 3.0% | 30.8%(-27.8)#35 | 35.2%(-32.2)#492 |
| 36. | Deer Lake Borough | 3.0% | 30.8%(-27.8)#36 | 35.2%(-32.2)#495 |
| 37. | Devon | 3.0% | 30.8%(-27.8)#37 | 35.2%(-32.2)#505 |
| 38. | Spring Hill | 3.0% | 30.8%(-27.8)#38 | 35.2%(-32.2)#509 |
| 39. | Blandburg | 3.1% | 30.8%(-27.7)#39 | 35.2%(-32.1)#541 |
| 40. | Weston | 3.2% | 30.8%(-27.7)#40 | 35.2%(-32.0)#561 |
| 41. | Clarksville Borough | 3.2% | 30.8%(-27.6)#41 | 35.2%(-32.0)#565 |
| 42. | Dauberville | 3.2% | 30.8%(-27.6)#42 | 35.2%(-32.0)#576 |
| 43. | Valley Green | 3.2% | 30.8%(-27.6)#43 | 35.2%(-31.9)#596 |
| 44. | Churchill Borough | 3.3% | 30.8%(-27.5)#44 | 35.2%(-31.9)#610 |
| 45. | Bradford Woods Borough | 3.3% | 30.8%(-27.5)#45 | 35.2%(-31.8)#623 |
| 46. | Milford Square | 3.4% | 30.8%(-27.4)#46 | 35.2%(-31.8)#639 |
| 47. | Belfast | 3.5% | 30.8%(-27.3)#47 | 35.2%(-31.6)#693 |
| 48. | Bear Creek Village Borough | 3.6% | 30.8%(-27.2)#48 | 35.2%(-31.5)#722 |
| 49. | Jacksonwald | 3.7% | 30.8%(-27.1)#49 | 35.2%(-31.5)#729 |
| 50. | Swartzville | 3.7% | 30.8%(-27.1)#50 | 35.2%(-31.5)#732 |
| 51. | Nixon | 3.7% | 30.8%(-27.1)#51 | 35.2%(-31.5)#736 |
| 52. | Cross Creek | 3.7% | 30.8%(-27.1)#52 | 35.2%(-31.5)#739 |
| 53. | Sun Valley | 3.7% | 30.8%(-27.1)#53 | 35.2%(-31.5)#753 |
| 54. | New Salem Borough | 3.7% | 30.8%(-27.1)#54 | 35.2%(-31.5)#756 |
| 55. | Fellsburg | 3.8% | 30.8%(-27.0)#55 | 35.2%(-31.4)#781 |
| 56. | Newburg | 3.8% | 30.8%(-27.0)#56 | 35.2%(-31.4)#786 |
| 57. | Aristes | 3.8% | 30.8%(-27.0)#57 | 35.2%(-31.3)#795 |
| 58. | Towamensing Trails | 3.9% | 30.8%(-26.9)#58 | 35.2%(-31.3)#804 |
| 59. | Pine Grove Mills | 3.9% | 30.8%(-26.9)#59 | 35.2%(-31.3)#818 |
| 60. | Alleghenyville | 3.9% | 30.8%(-26.9)#60 | 35.2%(-31.2)#823 |
| 61. | Palmer Heights | 4.0% | 30.8%(-26.8)#61 | 35.2%(-31.2)#835 |
| 62. | Rennerdale | 4.0% | 30.8%(-26.8)#62 | 35.2%(-31.2)#836 |
| 63. | Pughtown | 4.0% | 30.8%(-26.8)#63 | 35.2%(-31.2)#851 |
| 64. | Coburn | 4.1% | 30.8%(-26.7)#64 | 35.2%(-31.1)#860 |
| 65. | Lake Arthur Estates | 4.2% | 30.8%(-26.6)#65 | 35.2%(-31.0)#897 |
| 66. | Gibsonia | 4.2% | 30.8%(-26.6)#66 | 35.2%(-31.0)#901 |
| 67. | Jackson Center Borough | 4.2% | 30.8%(-26.6)#67 | 35.2%(-31.0)#913 |
| 68. | Mcgovern | 4.2% | 30.8%(-26.6)#68 | 35.2%(-30.9)#916 |
| 69. | Westwood | 4.3% | 30.8%(-26.6)#69 | 35.2%(-30.9)#920 |
| 70. | Robeson Extension | 4.3% | 30.8%(-26.6)#70 | 35.2%(-30.9)#922 |
| 71. | Avonia | 4.3% | 30.8%(-26.5)#71 | 35.2%(-30.9)#935 |
| 72. | Enlow | 4.3% | 30.8%(-26.5)#72 | 35.2%(-30.9)#940 |
| 73. | South Temple | 4.4% | 30.8%(-26.4)#73 | 35.2%(-30.8)#962 |
| 74. | Kimberton | 4.4% | 30.8%(-26.4)#74 | 35.2%(-30.8)#963 |
| 75. | Dilworthtown | 4.4% | 30.8%(-26.4)#75 | 35.2%(-30.7)#981 |
| 76. | Maitland | 4.5% | 30.8%(-26.3)#76 | 35.2%(-30.7)#1,001 |
| 77. | Beech Mountain Lakes | 4.5% | 30.8%(-26.3)#77 | 35.2%(-30.7)#1,017 |
| 78. | Pocono Woodland Lakes | 4.5% | 30.8%(-26.3)#78 | 35.2%(-30.6)#1,019 |
| 79. | Hopeland | 4.5% | 30.8%(-26.3)#79 | 35.2%(-30.6)#1,021 |
| 80. | Timblin Borough | 4.5% | 30.8%(-26.3)#80 | 35.2%(-30.6)#1,028 |
| 81. | Deemston Borough | 4.6% | 30.8%(-26.2)#81 | 35.2%(-30.6)#1,042 |
| 82. | Rauchtown | 4.6% | 30.8%(-26.2)#82 | 35.2%(-30.6)#1,050 |
| 83. | Sproul | 4.6% | 30.8%(-26.2)#83 | 35.2%(-30.6)#1,058 |
| 84. | Alba Borough | 4.7% | 30.8%(-26.1)#84 | 35.2%(-30.5)#1,094 |
| 85. | Churchville | 4.7% | 30.8%(-26.1)#85 | 35.2%(-30.5)#1,102 |
| 86. | Slickville | 4.8% | 30.8%(-26.0)#86 | 35.2%(-30.4)#1,118 |
| 87. | Pine Glen | 4.8% | 30.8%(-26.0)#87 | 35.2%(-30.4)#1,144 |
| 88. | Zion | 4.8% | 30.8%(-26.0)#88 | 35.2%(-30.4)#1,150 |
| 89. | Chadds Ford | 4.8% | 30.8%(-26.0)#89 | 35.2%(-30.3)#1,161 |
| 90. | Dunnstown | 5.0% | 30.8%(-25.8)#90 | 35.2%(-30.2)#1,217 |
| 91. | East Prospect Borough | 5.0% | 30.8%(-25.8)#91 | 35.2%(-30.2)#1,218 |
| 92. | Eagles Mere Borough | 5.0% | 30.8%(-25.8)#92 | 35.2%(-30.2)#1,224 |
| 93. | Lake Heritage | 5.0% | 30.8%(-25.8)#93 | 35.2%(-30.2)#1,230 |
| 94. | Bear Rocks | 5.0% | 30.8%(-25.8)#94 | 35.2%(-30.1)#1,238 |
| 95. | Hasson Heights | 5.1% | 30.8%(-25.8)#95 | 35.2%(-30.1)#1,248 |
| 96. | Loop | 5.1% | 30.8%(-25.8)#96 | 35.2%(-30.1)#1,249 |
| 97. | Madisonburg | 5.1% | 30.8%(-25.7)#97 | 35.2%(-30.1)#1,256 |
| 98. | Penn Estates | 5.2% | 30.8%(-25.6)#98 | 35.2%(-30.0)#1,302 |
| 99. | Rote | 5.3% | 30.8%(-25.5)#99 | 35.2%(-29.9)#1,320 |
| 100. | Hunker Borough | 5.3% | 30.8%(-25.5)#100 | 35.2%(-29.9)#1,349 |
Common Questions
What are the Top 10 Cities with the Lowest Percentage of Renter-Occupied Units in Pennsylvania?
Top 10 Cities with the Lowest Percentage of Renter-Occupied Units in Pennsylvania are:
#1
0.46%
#2
0.60%
#3
0.76%
#4
0.97%
#5
1.5%
#6
1.8%
#7
1.9%
#8
2.0%
#9
2.1%
#10
2.1%
What city has the Lowest Percentage of Renter-Occupied Units in Pennsylvania?
Lake Meade has the Lowest Percentage of Renter-Occupied Units in Pennsylvania with 0.46%.
What is the Percentage of Renter-Occupied Units in the State of Pennsylvania?
Percentage of Renter-Occupied Units in Pennsylvania is 30.8%.
What is the Percentage of Renter-Occupied Units in the United States?
Percentage of Renter-Occupied Units in the United States is 35.2%.