Cities with the Lowest Percentage of Renter-Occupied Units in North Carolina
RELATED REPORTS & OPTIONS
Lowest Renter-Occupied
North Carolina
Compare Cities
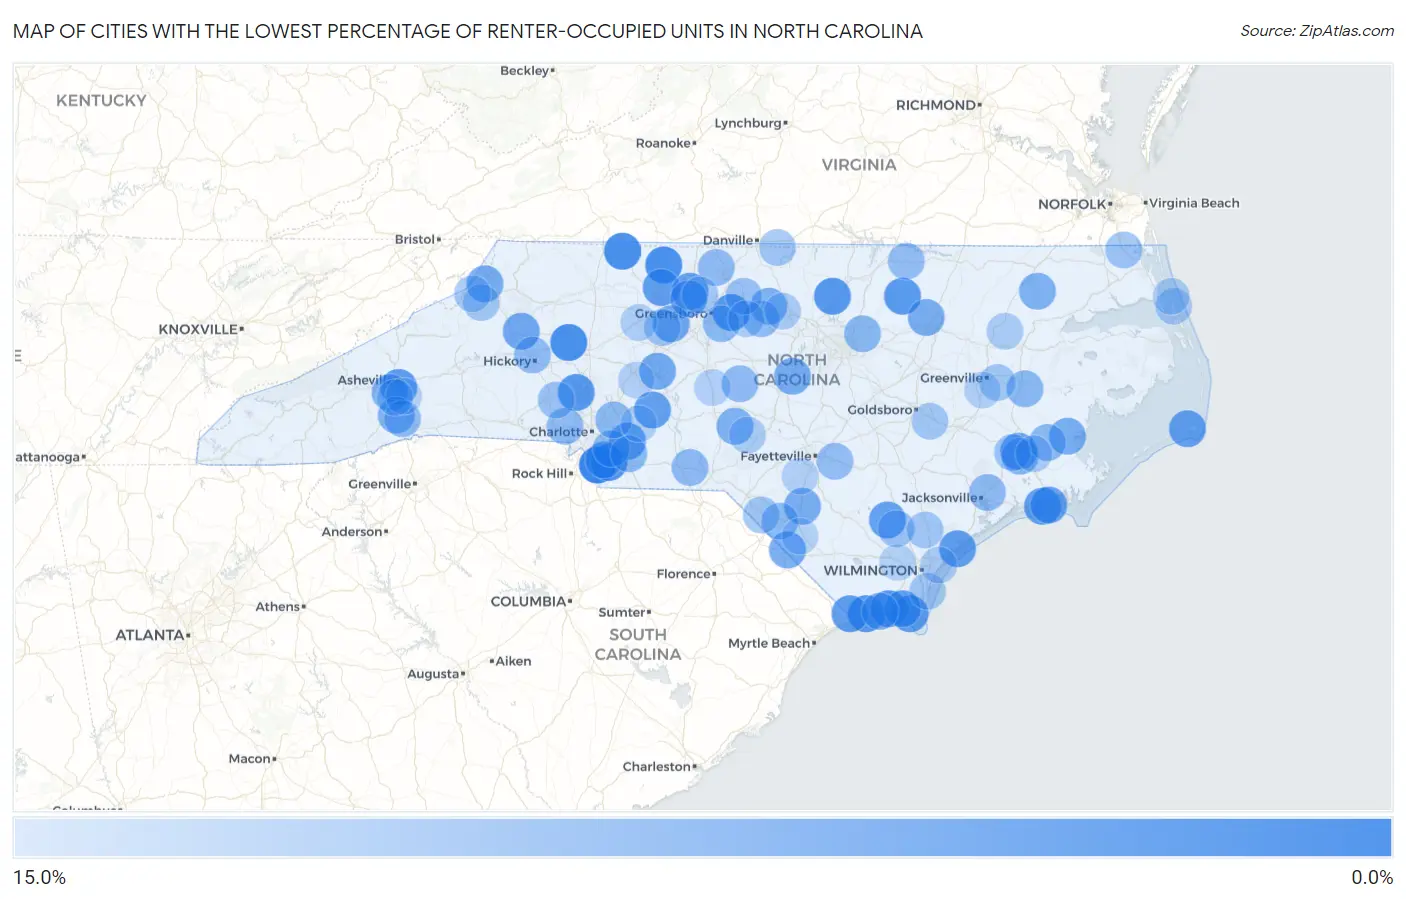
Map of Cities with the Lowest Percentage of Renter-Occupied Units in North Carolina
15.0%
0.0%
Cities with the Lowest Percentage of Renter-Occupied Units in North Carolina
| City | % Renter-Occupied | vs State | vs National | |
| 1. | Marvin | 0.11% | 33.8%(-33.7)#1 | 35.2%(-35.1)#1 |
| 2. | Stony Point | 2.1% | 33.8%(-31.7)#2 | 35.2%(-33.0)#249 |
| 3. | Flat Rock | 2.2% | 33.8%(-31.6)#3 | 35.2%(-33.0)#256 |
| 4. | Danbury | 2.2% | 33.8%(-31.6)#4 | 35.2%(-33.0)#265 |
| 5. | Governors Club | 2.4% | 33.8%(-31.4)#5 | 35.2%(-32.8)#314 |
| 6. | Arrowhead Beach | 2.6% | 33.8%(-31.2)#6 | 35.2%(-32.5)#407 |
| 7. | Wesley Chapel | 3.1% | 33.8%(-30.7)#7 | 35.2%(-32.1)#538 |
| 8. | Cypress Landing | 3.2% | 33.8%(-30.6)#8 | 35.2%(-32.0)#577 |
| 9. | Ocean Isle Beach | 3.2% | 33.8%(-30.6)#9 | 35.2%(-31.9)#593 |
| 10. | Stem | 3.4% | 33.8%(-30.4)#10 | 35.2%(-31.8)#642 |
| 11. | Sedalia | 3.5% | 33.8%(-30.3)#11 | 35.2%(-31.7)#673 |
| 12. | Varnamtown | 3.6% | 33.8%(-30.2)#12 | 35.2%(-31.6)#713 |
| 13. | Centerville | 3.6% | 33.8%(-30.2)#13 | 35.2%(-31.5)#718 |
| 14. | Westport | 3.7% | 33.8%(-30.0)#14 | 35.2%(-31.4)#763 |
| 15. | Biltmore Forest | 3.9% | 33.8%(-29.9)#15 | 35.2%(-31.3)#816 |
| 16. | Indian Beach | 4.1% | 33.8%(-29.7)#16 | 35.2%(-31.1)#859 |
| 17. | Caswell Beach | 4.1% | 33.8%(-29.7)#17 | 35.2%(-31.1)#872 |
| 18. | Carolina Shores | 4.2% | 33.8%(-29.6)#18 | 35.2%(-31.0)#905 |
| 19. | Germanton | 4.3% | 33.8%(-29.5)#19 | 35.2%(-30.9)#932 |
| 20. | Topsail Beach | 4.5% | 33.8%(-29.3)#20 | 35.2%(-30.7)#1,002 |
| 21. | St James | 4.5% | 33.8%(-29.3)#21 | 35.2%(-30.7)#1,005 |
| 22. | Ivanhoe | 4.8% | 33.8%(-29.0)#22 | 35.2%(-30.4)#1,141 |
| 23. | Millingport | 4.9% | 33.8%(-28.9)#23 | 35.2%(-30.3)#1,162 |
| 24. | Frisco | 4.9% | 33.8%(-28.9)#24 | 35.2%(-30.3)#1,182 |
| 25. | Pine Knoll Shores | 4.9% | 33.8%(-28.9)#25 | 35.2%(-30.3)#1,192 |
| 26. | Stokesdale | 5.0% | 33.8%(-28.8)#26 | 35.2%(-30.2)#1,231 |
| 27. | Fairview | 5.2% | 33.8%(-28.6)#27 | 35.2%(-30.0)#1,295 |
| 28. | Trent Woods | 5.5% | 33.8%(-28.3)#28 | 35.2%(-29.6)#1,448 |
| 29. | Wallburg | 5.9% | 33.8%(-27.9)#29 | 35.2%(-29.3)#1,580 |
| 30. | Cedar Rock | 6.1% | 33.8%(-27.7)#30 | 35.2%(-29.1)#1,685 |
| 31. | Smithtown | 6.2% | 33.8%(-27.6)#31 | 35.2%(-29.0)#1,707 |
| 32. | Oak Ridge | 6.2% | 33.8%(-27.6)#32 | 35.2%(-29.0)#1,711 |
| 33. | Southmont | 6.3% | 33.8%(-27.4)#33 | 35.2%(-28.8)#1,779 |
| 34. | Weddington | 6.4% | 33.8%(-27.4)#34 | 35.2%(-28.8)#1,793 |
| 35. | Marietta | 6.5% | 33.8%(-27.3)#35 | 35.2%(-28.7)#1,859 |
| 36. | Cove Creek | 6.8% | 33.8%(-26.9)#36 | 35.2%(-28.3)#1,983 |
| 37. | Moncure | 6.9% | 33.8%(-26.9)#37 | 35.2%(-28.3)#2,013 |
| 38. | Vandemere | 7.1% | 33.8%(-26.7)#38 | 35.2%(-28.1)#2,097 |
| 39. | Red Oak | 7.1% | 33.8%(-26.7)#39 | 35.2%(-28.0)#2,121 |
| 40. | Barker Ten Mile | 7.2% | 33.8%(-26.6)#40 | 35.2%(-28.0)#2,150 |
| 41. | Holden Beach | 7.5% | 33.8%(-26.3)#41 | 35.2%(-27.7)#2,278 |
| 42. | Woodlawn | 7.5% | 33.8%(-26.3)#42 | 35.2%(-27.7)#2,295 |
| 43. | Bent Creek | 7.6% | 33.8%(-26.2)#43 | 35.2%(-27.6)#2,353 |
| 44. | Powellsville | 7.7% | 33.8%(-26.1)#44 | 35.2%(-27.5)#2,396 |
| 45. | Seven Lakes | 7.7% | 33.8%(-26.1)#45 | 35.2%(-27.5)#2,415 |
| 46. | Horse Shoe | 7.8% | 33.8%(-26.0)#46 | 35.2%(-27.4)#2,437 |
| 47. | Brices Creek | 8.4% | 33.8%(-25.4)#47 | 35.2%(-26.8)#2,733 |
| 48. | Briar Chapel | 8.6% | 33.8%(-25.2)#48 | 35.2%(-26.6)#2,822 |
| 49. | Rolesville | 8.9% | 33.8%(-24.9)#49 | 35.2%(-26.3)#2,968 |
| 50. | Grantsboro | 8.9% | 33.8%(-24.9)#50 | 35.2%(-26.3)#2,974 |
| 51. | Washington Park | 8.9% | 33.8%(-24.9)#51 | 35.2%(-26.2)#3,003 |
| 52. | Stallings | 9.0% | 33.8%(-24.8)#52 | 35.2%(-26.2)#3,067 |
| 53. | Unionville | 9.1% | 33.8%(-24.7)#53 | 35.2%(-26.1)#3,085 |
| 54. | Raynham | 9.1% | 33.8%(-24.7)#54 | 35.2%(-26.1)#3,132 |
| 55. | Brandywine Bay | 9.1% | 33.8%(-24.7)#55 | 35.2%(-26.1)#3,138 |
| 56. | Harrisburg | 9.1% | 33.8%(-24.7)#56 | 35.2%(-26.1)#3,144 |
| 57. | Forest Oaks | 9.2% | 33.8%(-24.6)#57 | 35.2%(-26.0)#3,154 |
| 58. | Bennett | 9.3% | 33.8%(-24.5)#58 | 35.2%(-25.9)#3,196 |
| 59. | Lilesville | 9.4% | 33.8%(-24.4)#59 | 35.2%(-25.8)#3,274 |
| 60. | Wentworth | 9.4% | 33.8%(-24.3)#60 | 35.2%(-25.7)#3,288 |
| 61. | Mcadenville | 9.5% | 33.8%(-24.3)#61 | 35.2%(-25.7)#3,310 |
| 62. | Pumpkin Center | 9.5% | 33.8%(-24.3)#62 | 35.2%(-25.7)#3,322 |
| 63. | Swepsonville | 9.5% | 33.8%(-24.3)#63 | 35.2%(-25.6)#3,352 |
| 64. | Northlakes | 9.6% | 33.8%(-24.2)#64 | 35.2%(-25.6)#3,373 |
| 65. | Laurel Park | 9.8% | 33.8%(-24.0)#65 | 35.2%(-25.4)#3,470 |
| 66. | Macon | 10.0% | 33.8%(-23.8)#66 | 35.2%(-25.2)#3,588 |
| 67. | Stedman | 10.1% | 33.8%(-23.7)#67 | 35.2%(-25.1)#3,623 |
| 68. | Atkinson | 10.4% | 33.8%(-23.4)#68 | 35.2%(-24.8)#3,781 |
| 69. | Altamahaw | 10.5% | 33.8%(-23.3)#69 | 35.2%(-24.7)#3,827 |
| 70. | Moyock | 10.6% | 33.8%(-23.1)#70 | 35.2%(-24.5)#3,921 |
| 71. | Iron Station | 10.6% | 33.8%(-23.1)#71 | 35.2%(-24.5)#3,922 |
| 72. | Midway | 10.9% | 33.8%(-22.9)#72 | 35.2%(-24.3)#4,063 |
| 73. | River Bend | 11.0% | 33.8%(-22.8)#73 | 35.2%(-24.2)#4,107 |
| 74. | Raemon | 11.1% | 33.8%(-22.7)#74 | 35.2%(-24.1)#4,171 |
| 75. | Milton | 11.1% | 33.8%(-22.7)#75 | 35.2%(-24.1)#4,181 |
| 76. | St Helena | 11.3% | 33.8%(-22.5)#76 | 35.2%(-23.9)#4,263 |
| 77. | Seven Devils | 11.6% | 33.8%(-22.2)#77 | 35.2%(-23.6)#4,451 |
| 78. | Simpson | 11.6% | 33.8%(-22.2)#78 | 35.2%(-23.6)#4,457 |
| 79. | Sea Breeze | 11.6% | 33.8%(-22.2)#79 | 35.2%(-23.5)#4,467 |
| 80. | Walnut Creek | 11.7% | 33.8%(-22.1)#80 | 35.2%(-23.5)#4,491 |
| 81. | Beech Mountain | 11.7% | 33.8%(-22.1)#81 | 35.2%(-23.5)#4,524 |
| 82. | Southern Shores | 12.0% | 33.8%(-21.8)#82 | 35.2%(-23.2)#4,653 |
| 83. | Summerfield | 12.0% | 33.8%(-21.8)#83 | 35.2%(-23.2)#4,681 |
| 84. | Ogden | 12.3% | 33.8%(-21.5)#84 | 35.2%(-22.9)#4,821 |
| 85. | Fairfield Harbour | 12.3% | 33.8%(-21.5)#85 | 35.2%(-22.9)#4,844 |
| 86. | Efland | 12.3% | 33.8%(-21.5)#86 | 35.2%(-22.9)#4,845 |
| 87. | Pinehurst | 12.5% | 33.8%(-21.3)#87 | 35.2%(-22.7)#4,951 |
| 88. | Hamilton | 12.5% | 33.8%(-21.3)#88 | 35.2%(-22.7)#4,969 |
| 89. | Duck | 12.6% | 33.8%(-21.2)#89 | 35.2%(-22.6)#5,032 |
| 90. | Alamance | 12.7% | 33.8%(-21.1)#90 | 35.2%(-22.5)#5,104 |
| 91. | Bermuda Run | 12.7% | 33.8%(-21.1)#91 | 35.2%(-22.5)#5,121 |
| 92. | Winterville | 12.8% | 33.8%(-21.0)#92 | 35.2%(-22.4)#5,179 |
| 93. | Locust | 13.0% | 33.8%(-20.8)#93 | 35.2%(-22.2)#5,297 |
| 94. | Seagrove | 13.1% | 33.8%(-20.7)#94 | 35.2%(-22.1)#5,372 |
| 95. | Faith | 13.2% | 33.8%(-20.6)#95 | 35.2%(-22.0)#5,424 |
| 96. | Parkton | 13.2% | 33.8%(-20.6)#96 | 35.2%(-22.0)#5,428 |
| 97. | Orrum | 13.3% | 33.8%(-20.5)#97 | 35.2%(-21.9)#5,501 |
| 98. | Sandy Creek | 13.4% | 33.8%(-20.4)#98 | 35.2%(-21.8)#5,541 |
| 99. | Royal Pines | 13.5% | 33.8%(-20.2)#99 | 35.2%(-21.6)#5,625 |
| 100. | Avery Creek | 13.6% | 33.8%(-20.2)#100 | 35.2%(-21.6)#5,660 |
Common Questions
What are the Top 10 Cities with the Lowest Percentage of Renter-Occupied Units in North Carolina?
Top 10 Cities with the Lowest Percentage of Renter-Occupied Units in North Carolina are:
#1
0.11%
#2
2.1%
#3
2.2%
#4
2.2%
#5
3.1%
#6
3.2%
#7
3.4%
#8
3.5%
#9
3.6%
#10
3.6%
What city has the Lowest Percentage of Renter-Occupied Units in North Carolina?
Marvin has the Lowest Percentage of Renter-Occupied Units in North Carolina with 0.11%.
What is the Percentage of Renter-Occupied Units in the State of North Carolina?
Percentage of Renter-Occupied Units in North Carolina is 33.8%.
What is the Percentage of Renter-Occupied Units in the United States?
Percentage of Renter-Occupied Units in the United States is 35.2%.