Cities with the Lowest Percentage of Renter-Occupied Units in Delaware
RELATED REPORTS & OPTIONS
Lowest Renter-Occupied
Delaware
Compare Cities
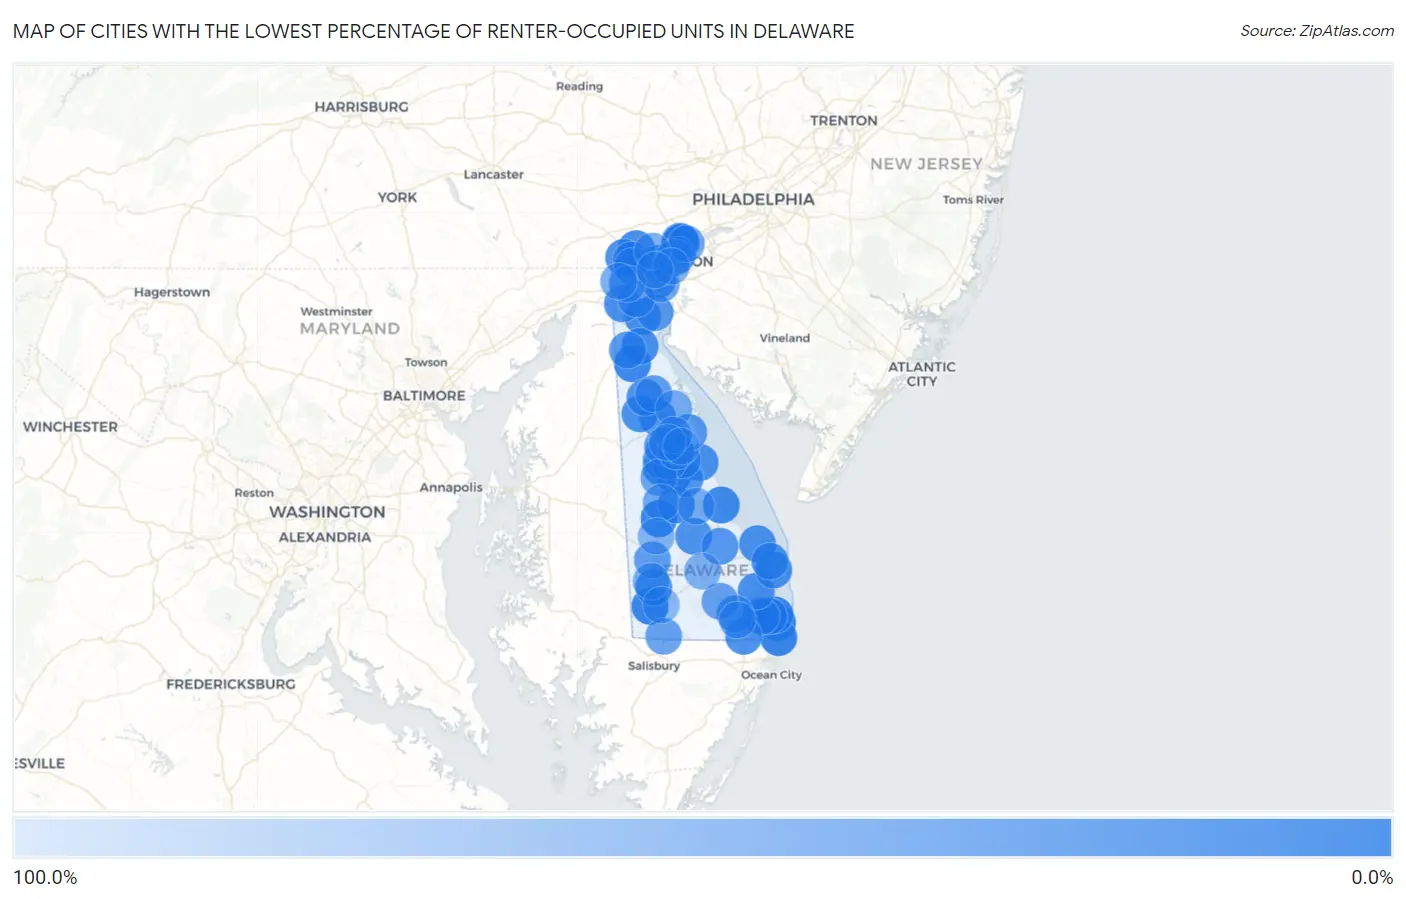
Map of Cities with the Lowest Percentage of Renter-Occupied Units in Delaware
100.0%
0.0%
Cities with the Lowest Percentage of Renter-Occupied Units in Delaware
| City | % Renter-Occupied | vs State | vs National | |
| 1. | South Bethany | 0.66% | 28.0%(-27.4)#1 | 35.2%(-34.5)#23 |
| 2. | Bethel | 1.2% | 28.0%(-26.9)#2 | 35.2%(-34.0)#78 |
| 3. | Fenwick Island | 1.5% | 28.0%(-26.5)#3 | 35.2%(-33.7)#128 |
| 4. | Riverview | 1.7% | 28.0%(-26.3)#4 | 35.2%(-33.5)#165 |
| 5. | Townsend | 4.3% | 28.0%(-23.7)#5 | 35.2%(-30.8)#946 |
| 6. | Farmington | 4.6% | 28.0%(-23.5)#6 | 35.2%(-30.6)#1,054 |
| 7. | Bethany Beach | 4.8% | 28.0%(-23.3)#7 | 35.2%(-30.4)#1,137 |
| 8. | Ocean View | 6.0% | 28.0%(-22.1)#8 | 35.2%(-29.2)#1,625 |
| 9. | Millville | 7.0% | 28.0%(-21.0)#9 | 35.2%(-28.1)#2,074 |
| 10. | Slaughter Beach | 7.8% | 28.0%(-20.2)#10 | 35.2%(-27.4)#2,454 |
| 11. | Hockessin | 8.7% | 28.0%(-19.4)#11 | 35.2%(-26.5)#2,861 |
| 12. | Viola | 9.7% | 28.0%(-18.4)#12 | 35.2%(-25.5)#3,409 |
| 13. | St Georges | 10.4% | 28.0%(-17.6)#13 | 35.2%(-24.7)#3,811 |
| 14. | Highland Acres | 10.8% | 28.0%(-17.2)#14 | 35.2%(-24.4)#4,006 |
| 15. | Cheswold | 11.1% | 28.0%(-16.9)#15 | 35.2%(-24.1)#4,211 |
| 16. | Lincoln | 11.8% | 28.0%(-16.2)#16 | 35.2%(-23.4)#4,571 |
| 17. | Odessa | 12.4% | 28.0%(-15.6)#17 | 35.2%(-22.8)#4,924 |
| 18. | Houston | 13.0% | 28.0%(-15.1)#18 | 35.2%(-22.2)#5,278 |
| 19. | North Star | 13.1% | 28.0%(-14.9)#19 | 35.2%(-22.1)#5,357 |
| 20. | Long Neck | 13.6% | 28.0%(-14.5)#20 | 35.2%(-21.6)#5,629 |
| 21. | Kenton | 13.7% | 28.0%(-14.4)#21 | 35.2%(-21.5)#5,705 |
| 22. | Selbyville | 13.8% | 28.0%(-14.2)#22 | 35.2%(-21.3)#5,812 |
| 23. | Dewey Beach | 13.9% | 28.0%(-14.1)#23 | 35.2%(-21.3)#5,865 |
| 24. | Lewes | 14.8% | 28.0%(-13.3)#24 | 35.2%(-20.4)#6,407 |
| 25. | Rehoboth Beach | 15.0% | 28.0%(-13.0)#25 | 35.2%(-20.2)#6,570 |
| 26. | Bowers | 15.4% | 28.0%(-12.6)#26 | 35.2%(-19.7)#6,818 |
| 27. | Glasgow | 15.6% | 28.0%(-12.4)#27 | 35.2%(-19.6)#6,901 |
| 28. | Blades | 15.9% | 28.0%(-12.1)#28 | 35.2%(-19.2)#7,090 |
| 29. | Pike Creek | 16.0% | 28.0%(-12.1)#29 | 35.2%(-19.2)#7,117 |
| 30. | Camden | 16.1% | 28.0%(-11.9)#30 | 35.2%(-19.1)#7,205 |
| 31. | Ardencroft | 17.0% | 28.0%(-11.0)#31 | 35.2%(-18.2)#7,804 |
| 32. | Ellendale | 17.2% | 28.0%(-10.9)#32 | 35.2%(-18.0)#7,880 |
| 33. | Clayton | 18.8% | 28.0%(-9.25)#33 | 35.2%(-16.4)#9,012 |
| 34. | Ardentown | 20.4% | 28.0%(-7.69)#34 | 35.2%(-14.8)#10,058 |
| 35. | Kent Acres | 21.6% | 28.0%(-6.40)#35 | 35.2%(-13.5)#10,890 |
| 36. | Frederica | 21.7% | 28.0%(-6.36)#36 | 35.2%(-13.5)#10,916 |
| 37. | Wilmington Manor | 22.7% | 28.0%(-5.33)#37 | 35.2%(-12.5)#11,599 |
| 38. | Dagsboro | 23.9% | 28.0%(-4.18)#38 | 35.2%(-11.3)#12,404 |
| 39. | Milton | 25.2% | 28.0%(-2.83)#39 | 35.2%(-9.97)#13,319 |
| 40. | Magnolia | 25.5% | 28.0%(-2.51)#40 | 35.2%(-9.65)#13,523 |
| 41. | Middletown | 26.7% | 28.0%(-1.30)#41 | 35.2%(-8.44)#14,298 |
| 42. | Little Creek | 28.0% | 28.0%(-0.083)#42 | 35.2%(-7.23)#15,153 |
| 43. | Woodside | 28.4% | 28.0%(+0.391)#43 | 35.2%(-6.75)#15,465 |
| 44. | Arden | 30.3% | 28.0%(+2.28)#44 | 35.2%(-4.86)#16,757 |
| 45. | Bridgeville | 30.8% | 28.0%(+2.74)#45 | 35.2%(-4.41)#17,061 |
| 46. | Delaware City | 31.5% | 28.0%(+3.42)#46 | 35.2%(-3.72)#17,447 |
| 47. | Smyrna | 31.9% | 28.0%(+3.88)#47 | 35.2%(-3.27)#17,721 |
| 48. | Woodside East | 33.2% | 28.0%(+5.12)#48 | 35.2%(-2.03)#18,464 |
| 49. | Bellefonte | 33.2% | 28.0%(+5.19)#49 | 35.2%(-1.96)#18,505 |
| 50. | Wyoming | 33.9% | 28.0%(+5.88)#50 | 35.2%(-1.27)#18,924 |
| 51. | Elsmere | 33.9% | 28.0%(+5.88)#51 | 35.2%(-1.27)#18,925 |
| 52. | Millsboro | 34.8% | 28.0%(+6.79)#52 | 35.2%(-0.351)#19,437 |
| 53. | Pike Creek Valley | 35.8% | 28.0%(+7.80)#53 | 35.2%(+0.652)#19,976 |
| 54. | Bear | 36.9% | 28.0%(+8.85)#54 | 35.2%(+1.71)#20,584 |
| 55. | Delmar | 37.8% | 28.0%(+9.77)#55 | 35.2%(+2.63)#21,061 |
| 56. | New Castle | 38.0% | 28.0%(+9.99)#56 | 35.2%(+2.85)#21,187 |
| 57. | Brookside | 39.2% | 28.0%(+11.2)#57 | 35.2%(+4.06)#21,751 |
| 58. | Frankford | 40.0% | 28.0%(+12.0)#58 | 35.2%(+4.82)#22,099 |
| 59. | Felton | 40.7% | 28.0%(+12.7)#59 | 35.2%(+5.55)#22,484 |
| 60. | Edgemoor | 42.0% | 28.0%(+14.0)#60 | 35.2%(+6.82)#23,015 |
| 61. | Harrington | 43.0% | 28.0%(+15.0)#61 | 35.2%(+7.82)#23,447 |
| 62. | Rising Sun Lebanon | 43.9% | 28.0%(+15.9)#62 | 35.2%(+8.75)#23,824 |
| 63. | Claymont | 46.1% | 28.0%(+18.0)#63 | 35.2%(+10.9)#24,594 |
| 64. | Leipsic | 46.8% | 28.0%(+18.8)#64 | 35.2%(+11.7)#24,826 |
| 65. | Newark | 47.9% | 28.0%(+19.9)#65 | 35.2%(+12.7)#25,188 |
| 66. | Seaford | 49.9% | 28.0%(+21.9)#66 | 35.2%(+14.8)#25,747 |
| 67. | Milford | 50.0% | 28.0%(+22.0)#67 | 35.2%(+14.9)#25,832 |
| 68. | Greenville | 50.4% | 28.0%(+22.3)#68 | 35.2%(+15.2)#25,910 |
| 69. | Dover | 51.7% | 28.0%(+23.6)#69 | 35.2%(+16.5)#26,248 |
| 70. | Wilmington | 54.9% | 28.0%(+26.8)#70 | 35.2%(+19.7)#26,853 |
| 71. | Rodney Village | 55.2% | 28.0%(+27.2)#71 | 35.2%(+20.0)#26,912 |
| 72. | Georgetown | 56.6% | 28.0%(+28.5)#72 | 35.2%(+21.4)#27,124 |
| 73. | Greenwood | 59.1% | 28.0%(+31.0)#73 | 35.2%(+23.9)#27,429 |
| 74. | Newport | 61.3% | 28.0%(+33.3)#74 | 35.2%(+26.1)#27,656 |
| 75. | Laurel | 65.0% | 28.0%(+37.0)#75 | 35.2%(+29.8)#27,958 |
| 76. | Dover Base Housing | 100.0% | 28.0%(+72.0)#76 | 35.2%(+64.8)#28,695 |
1
Common Questions
What are the Top 10 Cities with the Lowest Percentage of Renter-Occupied Units in Delaware?
Top 10 Cities with the Lowest Percentage of Renter-Occupied Units in Delaware are:
#1
0.0%
#2
0.0%
#3
0.66%
#4
1.2%
#5
1.5%
#6
1.7%
#7
4.3%
#8
4.6%
#9
4.8%
#10
6.0%
What city has the Lowest Percentage of Renter-Occupied Units in Delaware?
South Bethany has the Lowest Percentage of Renter-Occupied Units in Delaware with 0.66%.
What is the Percentage of Renter-Occupied Units in the State of Delaware?
Percentage of Renter-Occupied Units in Delaware is 28.0%.
What is the Percentage of Renter-Occupied Units in the United States?
Percentage of Renter-Occupied Units in the United States is 35.2%.