Pine Canyon, CA Map & Demographics
Pine Canyon Map
Pine Canyon Overview
$33,765
PER CAPITA INCOME
$64,730
AVG FAMILY INCOME
$115,210
AVG HOUSEHOLD INCOME
41.1%
WAGE / INCOME GAP [ % ]
58.9¢/ $1
WAGE / INCOME GAP [ $ ]
0.26
INEQUALITY / GINI INDEX
2,092
TOTAL POPULATION
1,297
MALE POPULATION
795
FEMALE POPULATION
163.14
MALES / 100 FEMALES
61.30
FEMALES / 100 MALES
47.3
MEDIAN AGE
3.1
AVG FAMILY SIZE
2.8
AVG HOUSEHOLD SIZE
985
LABOR FORCE [ PEOPLE ]
54.7%
PERCENT IN LABOR FORCE
2.6%
UNEMPLOYMENT RATE
Income in Pine Canyon
Income Overview in Pine Canyon
Per Capita Income in Pine Canyon is $33,765, while median incomes of families and households are $64,730 and $115,210 respectively.
| Characteristic | Number | Measure |
| Per Capita Income | 2,092 | $33,765 |
| Median Family Income | 568 | $64,730 |
| Mean Family Income | 568 | $82,696 |
| Median Household Income | 750 | $115,210 |
| Mean Household Income | 750 | $100,763 |
| Income Deficit | 568 | $0 |
| Wage / Income Gap (%) | 2,092 | 41.14% |
| Wage / Income Gap ($) | 2,092 | 58.86¢ per $1 |
| Gini / Inequality Index | 2,092 | 0.26 |
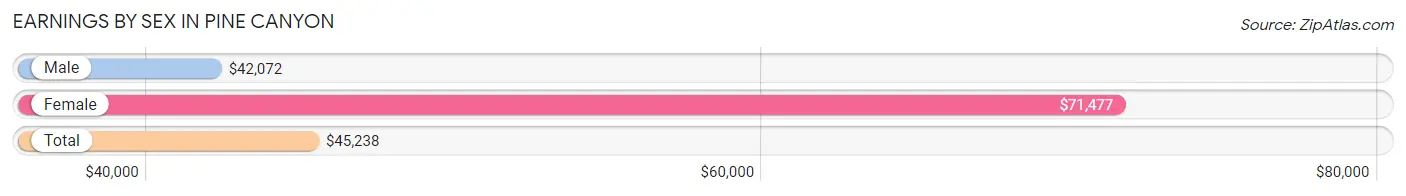
Earnings by Sex in Pine Canyon
Average Earnings in Pine Canyon are $45,238, $42,072 for men and $71,477 for women, a difference of 41.1%.
| Sex | Number | Average Earnings |
| Male | 657 (62.1%) | $42,072 |
| Female | 401 (37.9%) | $71,477 |
| Total | 1,058 (100.0%) | $45,238 |
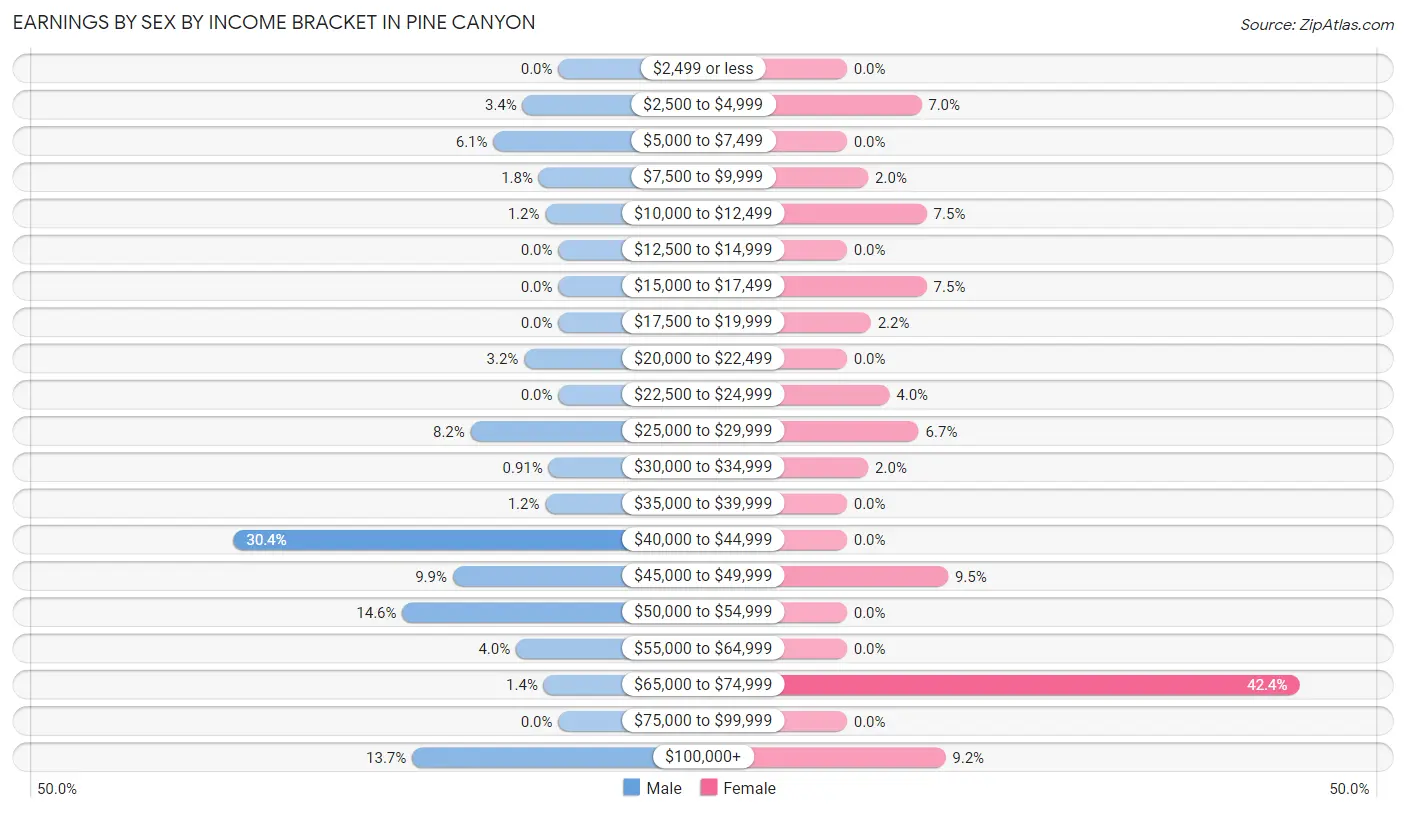
Earnings by Sex by Income Bracket in Pine Canyon
The most common earnings brackets in Pine Canyon are $40,000 to $44,999 for men (200 | 30.4%) and $65,000 to $74,999 for women (170 | 42.4%).
| Income | Male | Female |
| $2,499 or less | 0 (0.0%) | 0 (0.0%) |
| $2,500 to $4,999 | 22 (3.4%) | 28 (7.0%) |
| $5,000 to $7,499 | 40 (6.1%) | 0 (0.0%) |
| $7,500 to $9,999 | 12 (1.8%) | 8 (2.0%) |
| $10,000 to $12,499 | 8 (1.2%) | 30 (7.5%) |
| $12,500 to $14,999 | 0 (0.0%) | 0 (0.0%) |
| $15,000 to $17,499 | 0 (0.0%) | 30 (7.5%) |
| $17,500 to $19,999 | 0 (0.0%) | 9 (2.2%) |
| $20,000 to $22,499 | 21 (3.2%) | 0 (0.0%) |
| $22,500 to $24,999 | 0 (0.0%) | 16 (4.0%) |
| $25,000 to $29,999 | 54 (8.2%) | 27 (6.7%) |
| $30,000 to $34,999 | 6 (0.9%) | 8 (2.0%) |
| $35,000 to $39,999 | 8 (1.2%) | 0 (0.0%) |
| $40,000 to $44,999 | 200 (30.4%) | 0 (0.0%) |
| $45,000 to $49,999 | 65 (9.9%) | 38 (9.5%) |
| $50,000 to $54,999 | 96 (14.6%) | 0 (0.0%) |
| $55,000 to $64,999 | 26 (4.0%) | 0 (0.0%) |
| $65,000 to $74,999 | 9 (1.4%) | 170 (42.4%) |
| $75,000 to $99,999 | 0 (0.0%) | 0 (0.0%) |
| $100,000+ | 90 (13.7%) | 37 (9.2%) |
| Total | 657 (100.0%) | 401 (100.0%) |
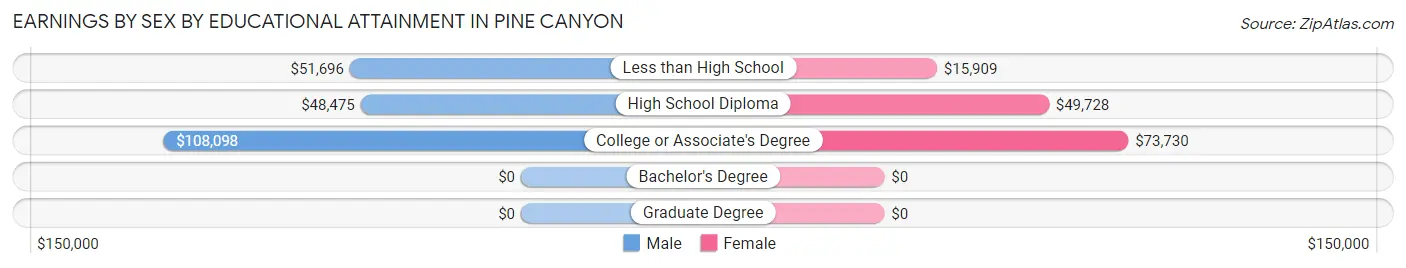
Earnings by Sex by Educational Attainment in Pine Canyon
Average earnings in Pine Canyon are $43,500 for men and $72,626 for women, a difference of 40.1%. Men with an educational attainment of college or associate's degree enjoy the highest average annual earnings of $108,098, while those with high school diploma education earn the least with $48,475. Women with an educational attainment of college or associate's degree earn the most with the average annual earnings of $73,730, while those with less than high school education have the smallest earnings of $15,909.
| Educational Attainment | Male Income | Female Income |
| Less than High School | $51,696 | $15,909 |
| High School Diploma | $48,475 | $49,728 |
| College or Associate's Degree | $108,098 | $73,730 |
| Bachelor's Degree | - | - |
| Graduate Degree | - | - |
| Total | $43,500 | $72,626 |
Family Income in Pine Canyon
Family Income Brackets in Pine Canyon
According to the Pine Canyon family income data, there are 188 families falling into the $35,000 to $49,999 income range, which is the most common income bracket and makes up 33.1% of all families.
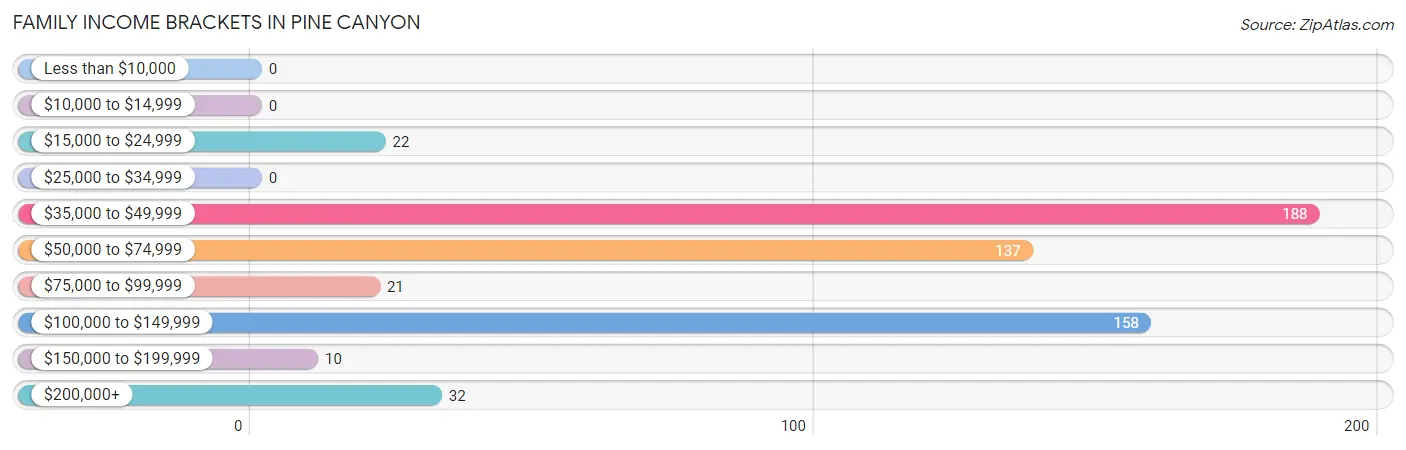
| Income Bracket | # Families | % Families |
| Less than $10,000 | 0 | 0.0% |
| $10,000 to $14,999 | 0 | 0.0% |
| $15,000 to $24,999 | 22 | 3.9% |
| $25,000 to $34,999 | 0 | 0.0% |
| $35,000 to $49,999 | 188 | 33.1% |
| $50,000 to $74,999 | 137 | 24.1% |
| $75,000 to $99,999 | 21 | 3.7% |
| $100,000 to $149,999 | 158 | 27.8% |
| $150,000 to $199,999 | 10 | 1.8% |
| $200,000+ | 32 | 5.6% |
Family Income by Famaliy Size in Pine Canyon
2-person families (137 | 24.1%) account for the highest median family income in Pine Canyon with $101,597 per family, while 2-person families (137 | 24.1%) have the highest median income of $50,798 per family member.
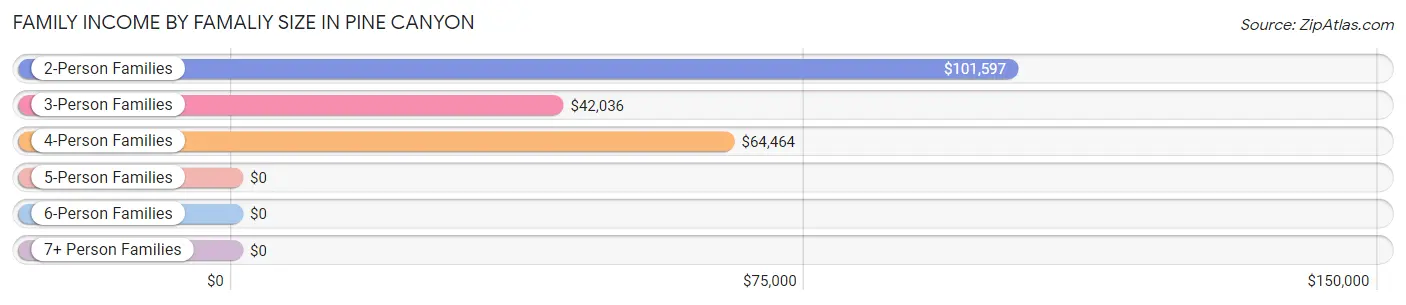
| Income Bracket | # Families | Median Income |
| 2-Person Families | 137 (24.1%) | $101,597 |
| 3-Person Families | 316 (55.6%) | $42,036 |
| 4-Person Families | 66 (11.6%) | $64,464 |
| 5-Person Families | 8 (1.4%) | $0 |
| 6-Person Families | 0 (0.0%) | $0 |
| 7+ Person Families | 41 (7.2%) | $0 |
| Total | 568 (100.0%) | $64,730 |
Family Income by Number of Earners in Pine Canyon
The median family income in Pine Canyon is $64,730, with families comprising 2 earners (125) having the highest median family income of $121,042, while families with 1 earner (268) have the lowest median family income of $41,677, accounting for 22.0% and 47.2% of families, respectively.
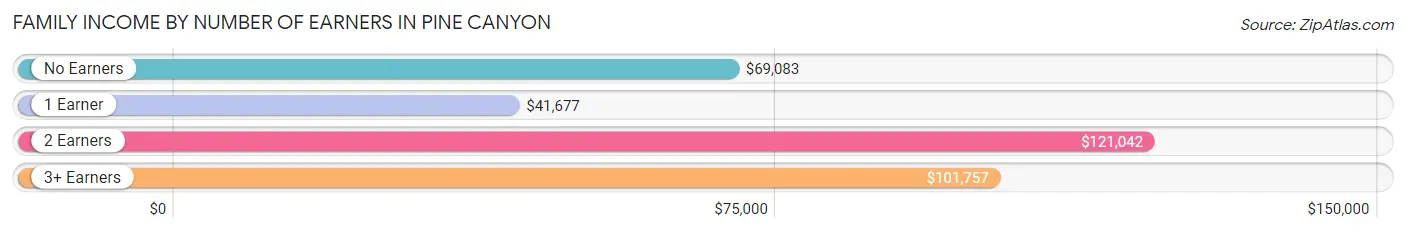
| Number of Earners | # Families | Median Income |
| No Earners | 107 (18.8%) | $69,083 |
| 1 Earner | 268 (47.2%) | $41,677 |
| 2 Earners | 125 (22.0%) | $121,042 |
| 3+ Earners | 68 (12.0%) | $101,757 |
| Total | 568 (100.0%) | $64,730 |
Household Income in Pine Canyon
Household Income Brackets in Pine Canyon
With 404 households falling in the category, the $100,000 to $149,999 income range is the most frequent in Pine Canyon, accounting for 53.9% of all households.
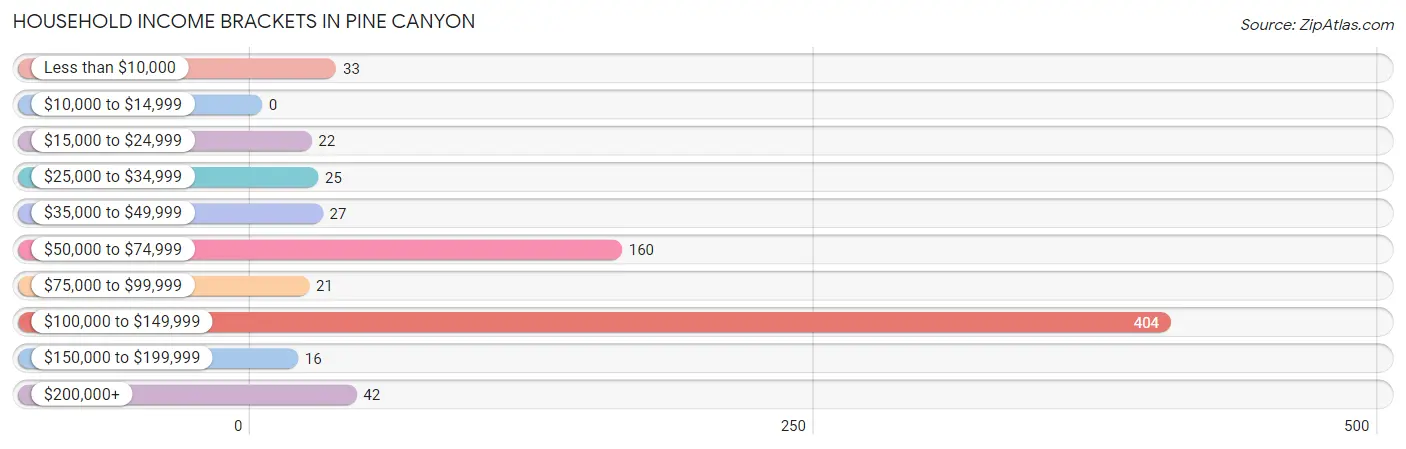
| Income Bracket | # Households | % Households |
| Less than $10,000 | 33 | 4.4% |
| $10,000 to $14,999 | 0 | 0.0% |
| $15,000 to $24,999 | 22 | 2.9% |
| $25,000 to $34,999 | 25 | 3.3% |
| $35,000 to $49,999 | 27 | 3.6% |
| $50,000 to $74,999 | 160 | 21.3% |
| $75,000 to $99,999 | 21 | 2.8% |
| $100,000 to $149,999 | 404 | 53.9% |
| $150,000 to $199,999 | 16 | 2.1% |
| $200,000+ | 42 | 5.6% |
Household Income by Householder Age in Pine Canyon
The median household income in Pine Canyon is $115,210, with the highest median household income of $123,551 found in the 25 to 44 years age bracket for the primary householder. A total of 154 households (20.5%) fall into this category. Meanwhile, the 15 to 24 years age bracket for the primary householder has the lowest median household income of $0, with 34 households (4.5%) in this group.
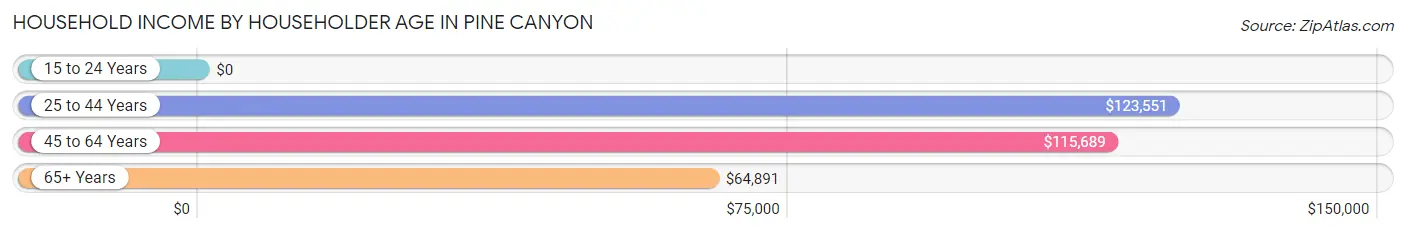
| Income Bracket | # Households | Median Income |
| 15 to 24 Years | 34 (4.5%) | $0 |
| 25 to 44 Years | 154 (20.5%) | $123,551 |
| 45 to 64 Years | 410 (54.7%) | $115,689 |
| 65+ Years | 152 (20.3%) | $64,891 |
| Total | 750 (100.0%) | $115,210 |
Poverty in Pine Canyon
Income Below Poverty by Sex and Age in Pine Canyon
With 5.2% poverty level for males and 6.2% for females among the residents of Pine Canyon, 12 to 14 year old males and 16 and 17 year old females are the most vulnerable to poverty, with 26 males (44.8%) and 27 females (100.0%) in their respective age groups living below the poverty level.
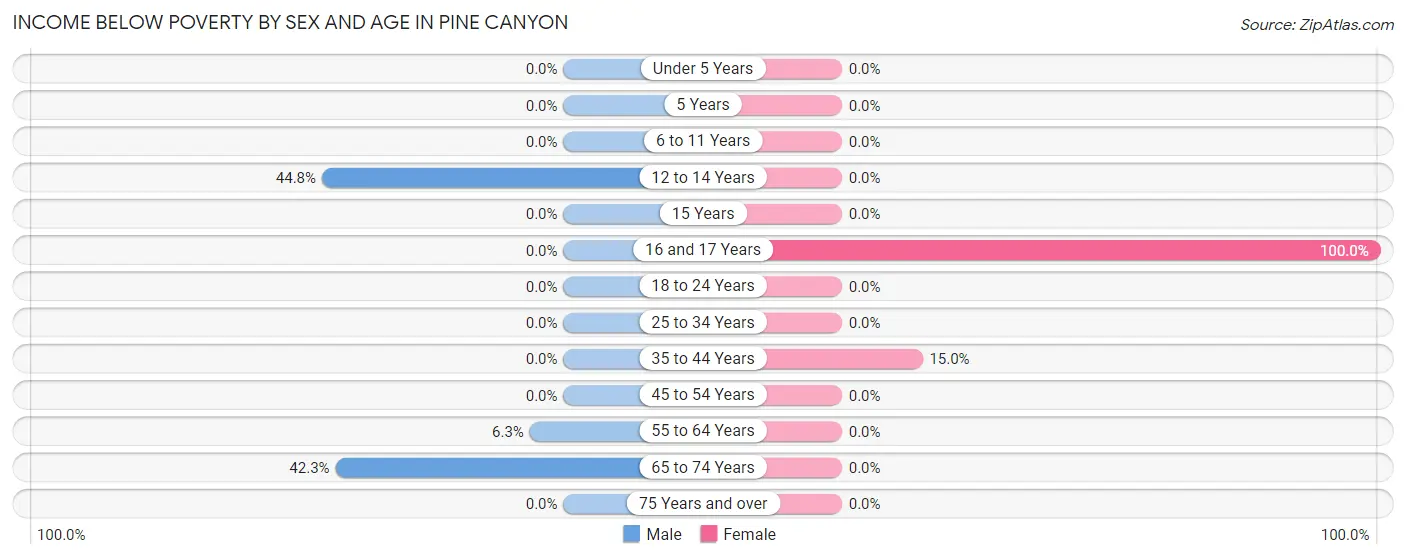
| Age Bracket | Male | Female |
| Under 5 Years | 0 (0.0%) | 0 (0.0%) |
| 5 Years | 0 (0.0%) | 0 (0.0%) |
| 6 to 11 Years | 0 (0.0%) | 0 (0.0%) |
| 12 to 14 Years | 26 (44.8%) | 0 (0.0%) |
| 15 Years | 0 (0.0%) | 0 (0.0%) |
| 16 and 17 Years | 0 (0.0%) | 27 (100.0%) |
| 18 to 24 Years | 0 (0.0%) | 0 (0.0%) |
| 25 to 34 Years | 0 (0.0%) | 0 (0.0%) |
| 35 to 44 Years | 0 (0.0%) | 22 (15.0%) |
| 45 to 54 Years | 0 (0.0%) | 0 (0.0%) |
| 55 to 64 Years | 8 (6.2%) | 0 (0.0%) |
| 65 to 74 Years | 33 (42.3%) | 0 (0.0%) |
| 75 Years and over | 0 (0.0%) | 0 (0.0%) |
| Total | 67 (5.2%) | 49 (6.2%) |
Income Above Poverty by Sex and Age in Pine Canyon
According to the poverty statistics in Pine Canyon, males aged 6 to 11 years and females aged 5 years are the age groups that are most secure financially, with 100.0% of males and 100.0% of females in these age groups living above the poverty line.
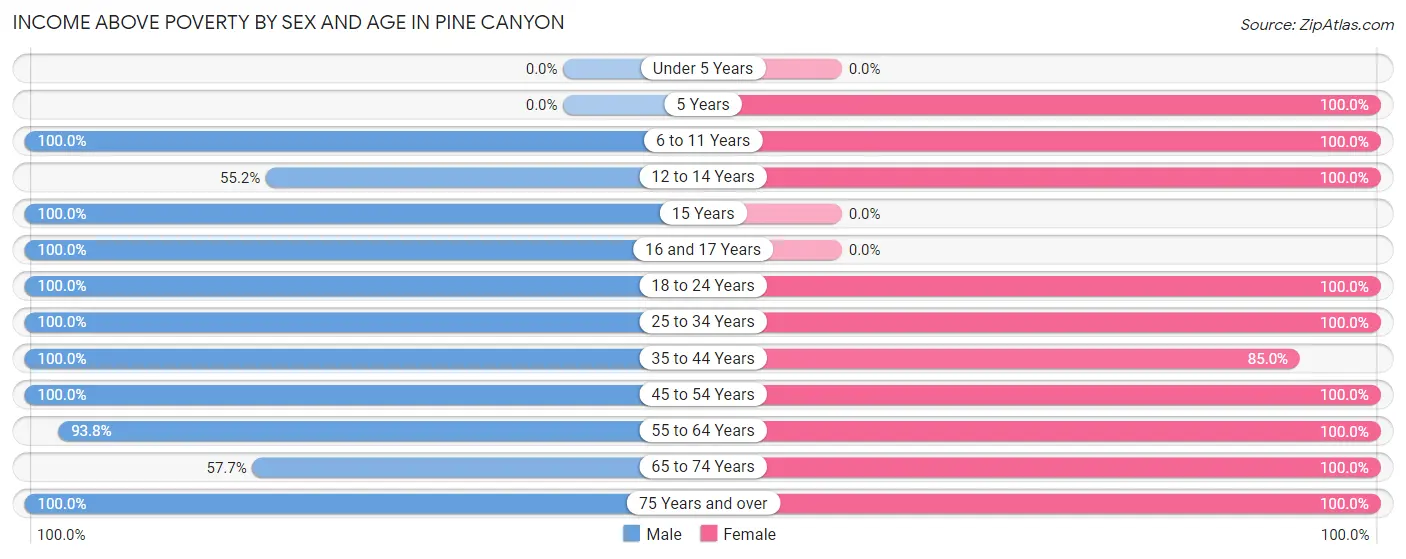
| Age Bracket | Male | Female |
| Under 5 Years | 0 (0.0%) | 0 (0.0%) |
| 5 Years | 0 (0.0%) | 17 (100.0%) |
| 6 to 11 Years | 22 (100.0%) | 55 (100.0%) |
| 12 to 14 Years | 32 (55.2%) | 8 (100.0%) |
| 15 Years | 130 (100.0%) | 0 (0.0%) |
| 16 and 17 Years | 162 (100.0%) | 0 (0.0%) |
| 18 to 24 Years | 79 (100.0%) | 34 (100.0%) |
| 25 to 34 Years | 115 (100.0%) | 31 (100.0%) |
| 35 to 44 Years | 76 (100.0%) | 125 (85.0%) |
| 45 to 54 Years | 351 (100.0%) | 213 (100.0%) |
| 55 to 64 Years | 120 (93.8%) | 98 (100.0%) |
| 65 to 74 Years | 45 (57.7%) | 50 (100.0%) |
| 75 Years and over | 95 (100.0%) | 115 (100.0%) |
| Total | 1,227 (94.8%) | 746 (93.8%) |
Income Below Poverty Among Married-Couple Families in Pine Canyon
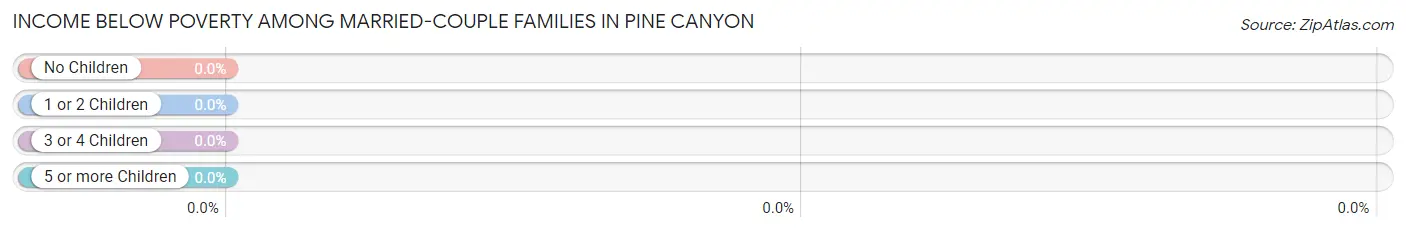
| Children | Above Poverty | Below Poverty |
| No Children | 185 (100.0%) | 0 (0.0%) |
| 1 or 2 Children | 97 (100.0%) | 0 (0.0%) |
| 3 or 4 Children | 0 (0.0%) | 0 (0.0%) |
| 5 or more Children | 18 (100.0%) | 0 (0.0%) |
| Total | 300 (100.0%) | 0 (0.0%) |
Income Below Poverty Among Single-Parent Households in Pine Canyon
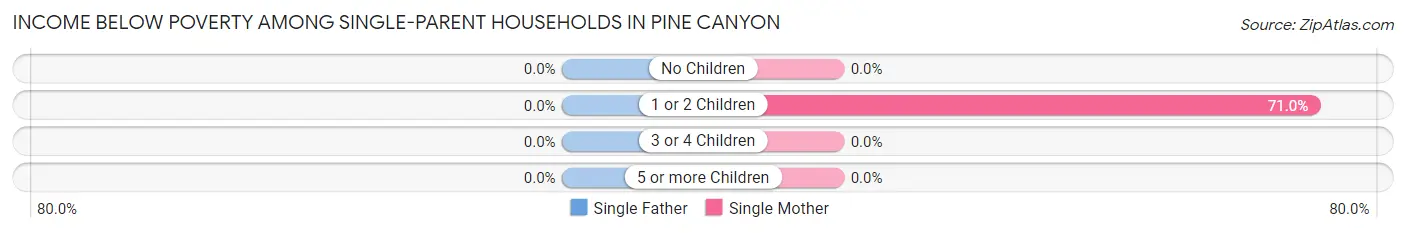
| Children | Single Father | Single Mother |
| No Children | 0 (0.0%) | 0 (0.0%) |
| 1 or 2 Children | 0 (0.0%) | 22 (71.0%) |
| 3 or 4 Children | 0 (0.0%) | 0 (0.0%) |
| 5 or more Children | 0 (0.0%) | 0 (0.0%) |
| Total | 0 (0.0%) | 22 (30.1%) |
Income Below Poverty Among Married-Couple vs Single-Parent Households in Pine Canyon
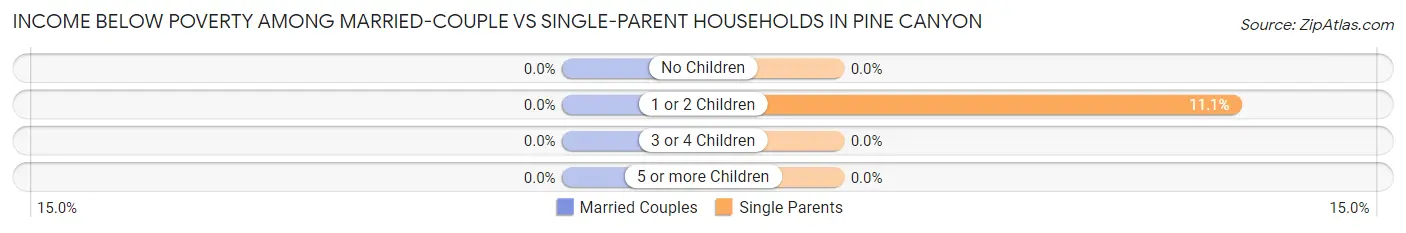
| Children | Married-Couple Families | Single-Parent Households |
| No Children | 0 (0.0%) | 0 (0.0%) |
| 1 or 2 Children | 0 (0.0%) | 22 (11.1%) |
| 3 or 4 Children | 0 (0.0%) | 0 (0.0%) |
| 5 or more Children | 0 (0.0%) | 0 (0.0%) |
| Total | 0 (0.0%) | 22 (8.2%) |
Race in Pine Canyon
The most populous races in Pine Canyon are Hispanic or Latino (1,186 | 56.7%), White / Caucasian (915 | 43.7%), and Some other Race (607 | 29.0%).
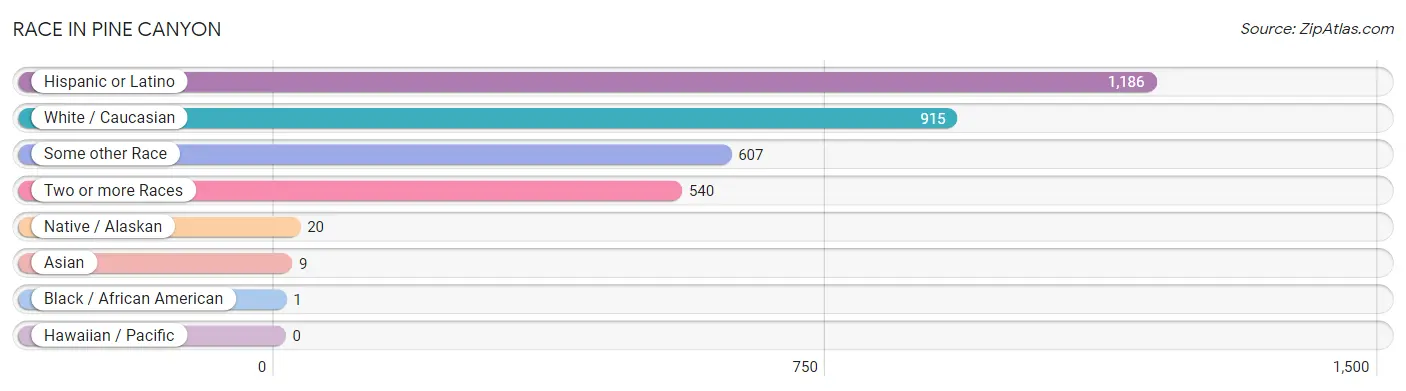
| Race | # Population | % Population |
| Asian | 9 | 0.4% |
| Black / African American | 1 | 0.1% |
| Hawaiian / Pacific | 0 | 0.0% |
| Hispanic or Latino | 1,186 | 56.7% |
| Native / Alaskan | 20 | 1.0% |
| White / Caucasian | 915 | 43.7% |
| Two or more Races | 540 | 25.8% |
| Some other Race | 607 | 29.0% |
| Total | 2,092 | 100.0% |
Ancestry in Pine Canyon
The most populous ancestries reported in Pine Canyon are Mexican (1,140 | 54.5%), Scottish (264 | 12.6%), German (184 | 8.8%), English (161 | 7.7%), and French (101 | 4.8%), together accounting for 88.4% of all Pine Canyon residents.
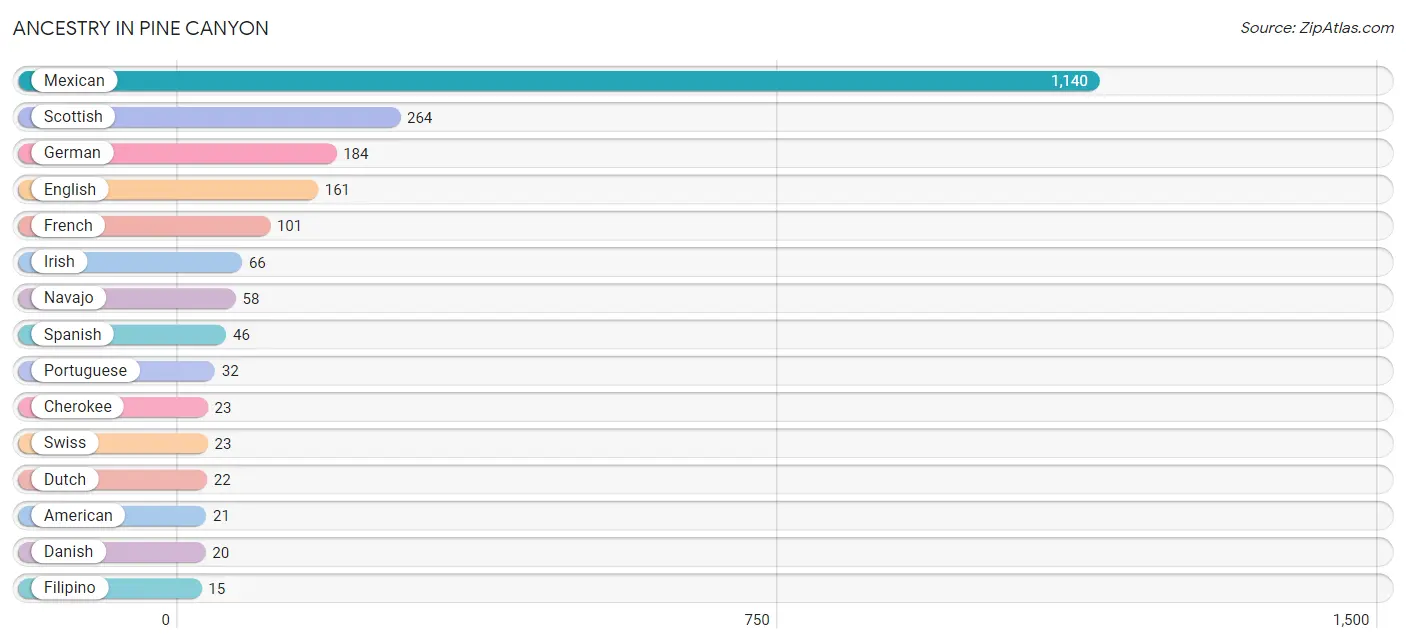
| Ancestry | # Population | % Population |
| American | 21 | 1.0% |
| British | 9 | 0.4% |
| Cherokee | 23 | 1.1% |
| Danish | 20 | 1.0% |
| Dutch | 22 | 1.1% |
| English | 161 | 7.7% |
| Filipino | 15 | 0.7% |
| French | 101 | 4.8% |
| German | 184 | 8.8% |
| Irish | 66 | 3.2% |
| Korean | 9 | 0.4% |
| Lithuanian | 15 | 0.7% |
| Mexican | 1,140 | 54.5% |
| Mexican American Indian | 14 | 0.7% |
| Navajo | 58 | 2.8% |
| Portuguese | 32 | 1.5% |
| Scottish | 264 | 12.6% |
| Spanish | 46 | 2.2% |
| Swedish | 8 | 0.4% |
| Swiss | 23 | 1.1% | View All 20 Rows |
Immigrants in Pine Canyon
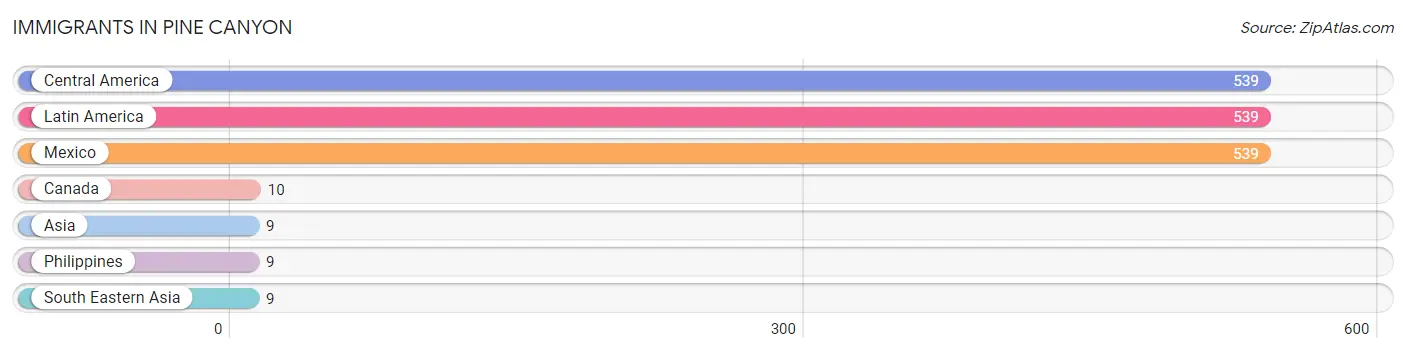
The most numerous immigrant groups reported in Pine Canyon came from Central America (539 | 25.8%), Latin America (539 | 25.8%), Mexico (539 | 25.8%), Canada (10 | 0.5%), and Asia (9 | 0.4%), together accounting for 78.2% of all Pine Canyon residents.
| Immigration Origin | # Population | % Population |
| Asia | 9 | 0.4% |
| Canada | 10 | 0.5% |
| Central America | 539 | 25.8% |
| Latin America | 539 | 25.8% |
| Mexico | 539 | 25.8% |
| Philippines | 9 | 0.4% |
| South Eastern Asia | 9 | 0.4% | View All 7 Rows |
Sex and Age in Pine Canyon
Sex and Age in Pine Canyon
The most populous age groups in Pine Canyon are 15 to 19 Years (341 | 26.3%) for men and 50 to 54 Years (183 | 23.0%) for women.
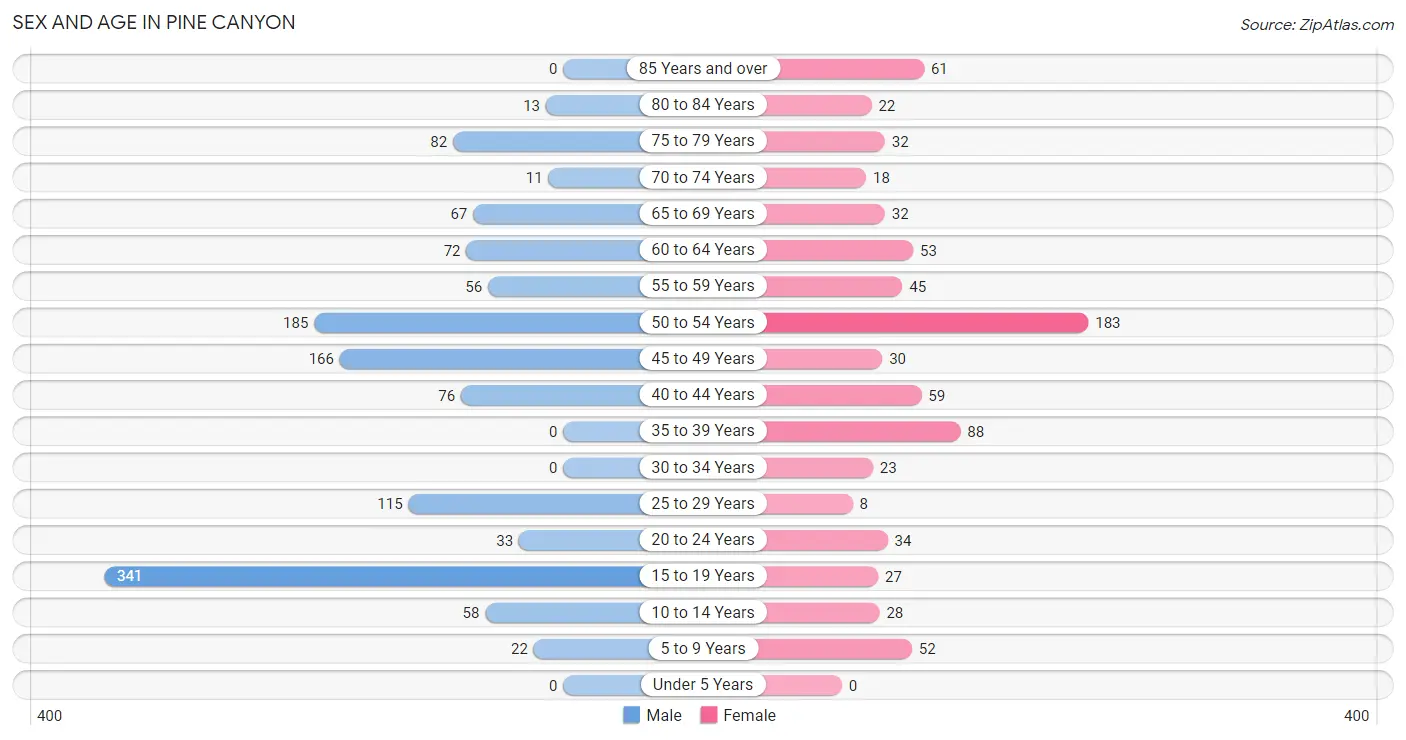
| Age Bracket | Male | Female |
| Under 5 Years | 0 (0.0%) | 0 (0.0%) |
| 5 to 9 Years | 22 (1.7%) | 52 (6.5%) |
| 10 to 14 Years | 58 (4.5%) | 28 (3.5%) |
| 15 to 19 Years | 341 (26.3%) | 27 (3.4%) |
| 20 to 24 Years | 33 (2.5%) | 34 (4.3%) |
| 25 to 29 Years | 115 (8.9%) | 8 (1.0%) |
| 30 to 34 Years | 0 (0.0%) | 23 (2.9%) |
| 35 to 39 Years | 0 (0.0%) | 88 (11.1%) |
| 40 to 44 Years | 76 (5.9%) | 59 (7.4%) |
| 45 to 49 Years | 166 (12.8%) | 30 (3.8%) |
| 50 to 54 Years | 185 (14.3%) | 183 (23.0%) |
| 55 to 59 Years | 56 (4.3%) | 45 (5.7%) |
| 60 to 64 Years | 72 (5.6%) | 53 (6.7%) |
| 65 to 69 Years | 67 (5.2%) | 32 (4.0%) |
| 70 to 74 Years | 11 (0.9%) | 18 (2.3%) |
| 75 to 79 Years | 82 (6.3%) | 32 (4.0%) |
| 80 to 84 Years | 13 (1.0%) | 22 (2.8%) |
| 85 Years and over | 0 (0.0%) | 61 (7.7%) |
| Total | 1,297 (100.0%) | 795 (100.0%) |
Families and Households in Pine Canyon
Median Family Size in Pine Canyon
The median family size in Pine Canyon is 3.09 persons per family, with married-couple families (300 | 52.8%) accounting for the largest median family size of 3.74 persons per family. On the other hand, single male/father families (195 | 34.3%) represent the smallest median family size with 2.08 persons per family.
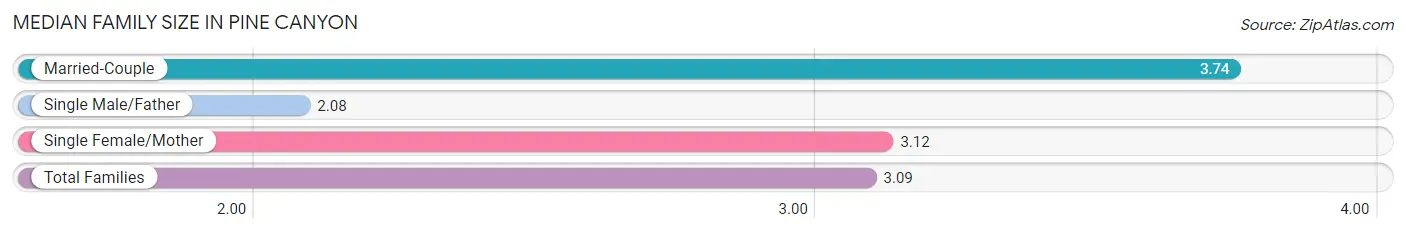
| Family Type | # Families | Family Size |
| Married-Couple | 300 (52.8%) | 3.74 |
| Single Male/Father | 195 (34.3%) | 2.08 |
| Single Female/Mother | 73 (12.9%) | 3.12 |
| Total Families | 568 (100.0%) | 3.09 |
Median Household Size in Pine Canyon
The median household size in Pine Canyon is 2.79 persons per household, with married-couple households (300 | 40.0%) accounting for the largest median household size of 3.74 persons per household. non-family households (182 | 24.3%) represent the smallest median household size with 1.37 persons per household.
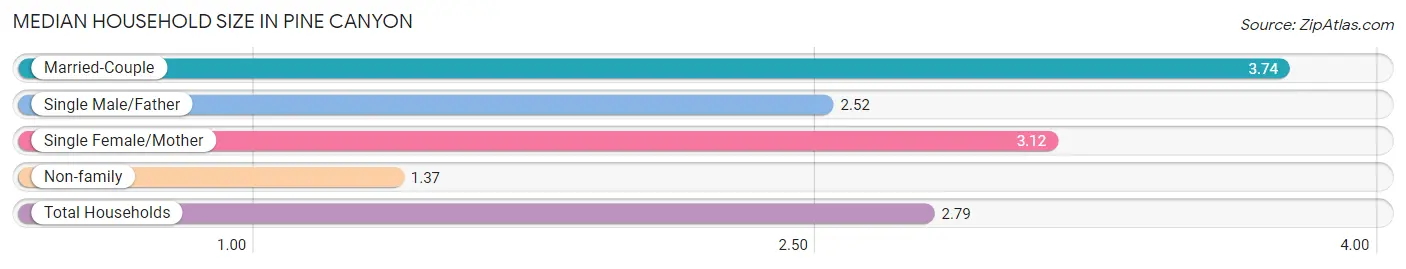
| Household Type | # Households | Household Size |
| Married-Couple | 300 (40.0%) | 3.74 |
| Single Male/Father | 195 (26.0%) | 2.52 |
| Single Female/Mother | 73 (9.7%) | 3.12 |
| Non-family | 182 (24.3%) | 1.37 |
| Total Households | 750 (100.0%) | 2.79 |
Household Size by Marriage Status in Pine Canyon
Out of a total of 750 households in Pine Canyon, 568 (75.7%) are family households, while 182 (24.3%) are nonfamily households. The most numerous type of family households are 4-person households, comprising 233, and the most common type of nonfamily households are 1-person households, comprising 124.
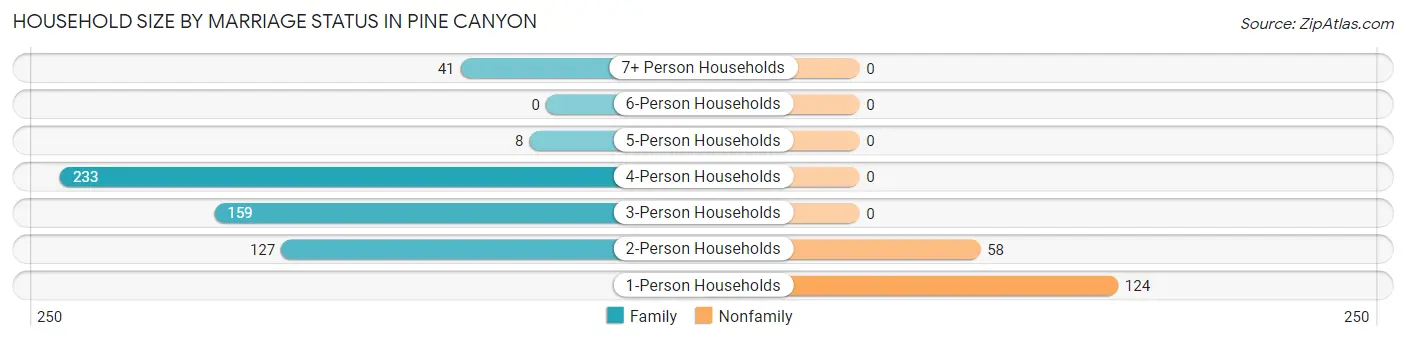
| Household Size | Family Households | Nonfamily Households |
| 1-Person Households | - | 124 (16.5%) |
| 2-Person Households | 127 (16.9%) | 58 (7.7%) |
| 3-Person Households | 159 (21.2%) | 0 (0.0%) |
| 4-Person Households | 233 (31.1%) | 0 (0.0%) |
| 5-Person Households | 8 (1.1%) | 0 (0.0%) |
| 6-Person Households | 0 (0.0%) | 0 (0.0%) |
| 7+ Person Households | 41 (5.5%) | 0 (0.0%) |
| Total | 568 (75.7%) | 182 (24.3%) |
Female Fertility in Pine Canyon
Fertility by Age in Pine Canyon
| Age Bracket | Women with Births | Births / 1,000 Women |
| 15 to 19 years | 0 (0.0%) | 0.0 |
| 20 to 34 years | 0 (0.0%) | 0.0 |
| 35 to 50 years | 0 (0.0%) | 0.0 |
| Total | 0 (0.0%) | 0.0 |
Fertility by Age by Marriage Status in Pine Canyon
| Age Bracket | Married | Unmarried |
| 15 to 19 years | 0 (0.0%) | 0 (0.0%) |
| 20 to 34 years | 0 (0.0%) | 0 (0.0%) |
| 35 to 50 years | 0 (0.0%) | 0 (0.0%) |
| Total | 0 (0.0%) | 0 (0.0%) |
Fertility by Education in Pine Canyon
| Educational Attainment | Women with Births | Births / 1,000 Women |
| Less than High School | 0 (0.0%) | 0.0 |
| High School Diploma | 0 (0.0%) | 0.0 |
| College or Associate's Degree | 0 (0.0%) | 0.0 |
| Bachelor's Degree | 0 (0.0%) | 0.0 |
| Graduate Degree | 0 (0.0%) | 0.0 |
| Total | 0 (0.0%) | 0.0 |
Fertility by Education by Marriage Status in Pine Canyon
| Educational Attainment | Married | Unmarried |
| Less than High School | 0 (0.0%) | 0 (0.0%) |
| High School Diploma | 0 (0.0%) | 0 (0.0%) |
| College or Associate's Degree | 0 (0.0%) | 0 (0.0%) |
| Bachelor's Degree | 0 (0.0%) | 0 (0.0%) |
| Graduate Degree | 0 (0.0%) | 0 (0.0%) |
| Total | 0 (0.0%) | 0 (0.0%) |
Employment Characteristics in Pine Canyon
Employment by Class of Employer in Pine Canyon
Among the 959 employed individuals in Pine Canyon, private company employees (538 | 56.1%), federal government employees (213 | 22.2%), and local government employees (139 | 14.5%) make up the most common classes of employment.
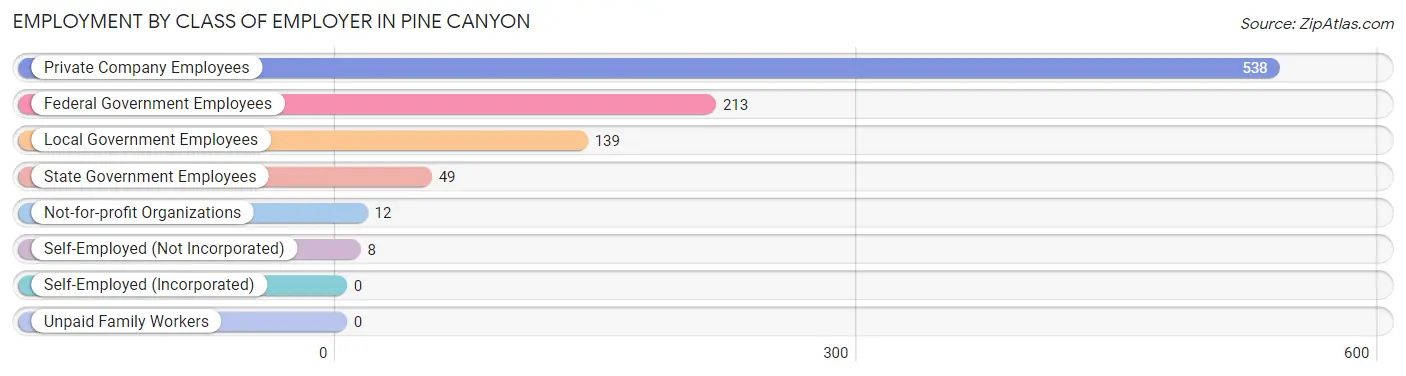
| Employer Class | # Employees | % Employees |
| Private Company Employees | 538 | 56.1% |
| Self-Employed (Incorporated) | 0 | 0.0% |
| Self-Employed (Not Incorporated) | 8 | 0.8% |
| Not-for-profit Organizations | 12 | 1.3% |
| Local Government Employees | 139 | 14.5% |
| State Government Employees | 49 | 5.1% |
| Federal Government Employees | 213 | 22.2% |
| Unpaid Family Workers | 0 | 0.0% |
| Total | 959 | 100.0% |
Employment Status by Age in Pine Canyon
According to the labor force statistics for Pine Canyon, out of the total population over 16 years of age (1,801), 54.7% or 985 individuals are in the labor force, with 2.6% or 26 of them unemployed. The age group with the highest labor force participation rate is 25 to 29 years, with 100.0% or 123 individuals in the labor force. Within the labor force, the 20 to 24 years age range has the highest percentage of unemployed individuals, with 15.3% or 9 of them being unemployed.
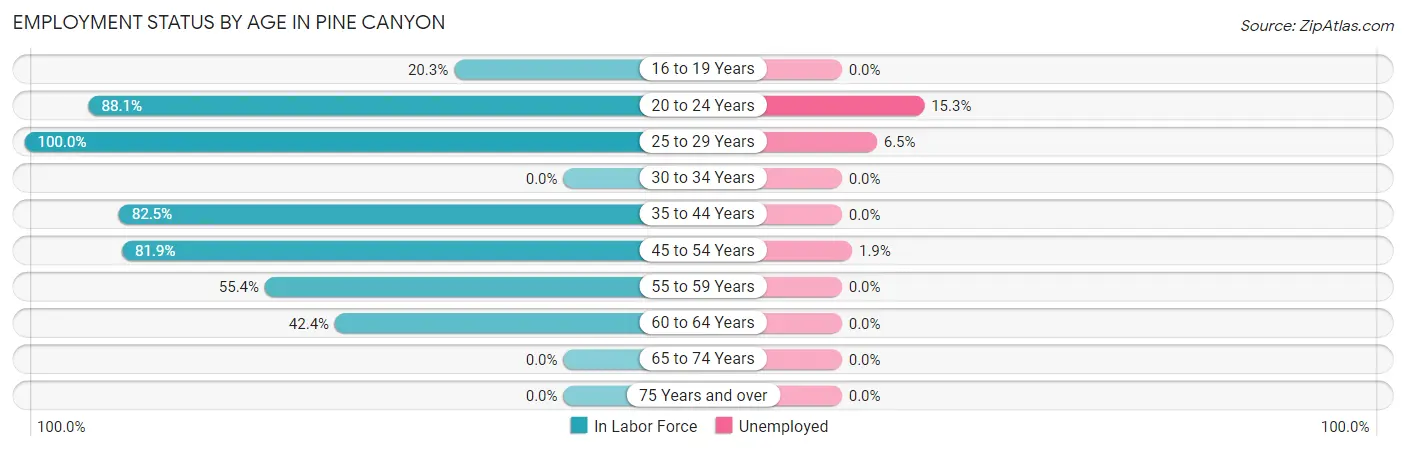
| Age Bracket | In Labor Force | Unemployed |
| 16 to 19 Years | 48 (20.3%) | 0 (0.0%) |
| 20 to 24 Years | 59 (88.1%) | 9 (15.3%) |
| 25 to 29 Years | 123 (100.0%) | 8 (6.5%) |
| 30 to 34 Years | 0 (0.0%) | 0 (0.0%) |
| 35 to 44 Years | 184 (82.5%) | 0 (0.0%) |
| 45 to 54 Years | 462 (81.9%) | 9 (1.9%) |
| 55 to 59 Years | 56 (55.4%) | 0 (0.0%) |
| 60 to 64 Years | 53 (42.4%) | 0 (0.0%) |
| 65 to 74 Years | 0 (0.0%) | 0 (0.0%) |
| 75 Years and over | 0 (0.0%) | 0 (0.0%) |
| Total | 985 (54.7%) | 26 (2.6%) |
Employment Status by Educational Attainment in Pine Canyon
According to labor force statistics for Pine Canyon, 75.8% of individuals (879) out of the total population between 25 and 64 years of age (1,159) are in the labor force, with 1.9% or 17 of them being unemployed. The group with the highest labor force participation rate are those with the educational attainment of high school diploma, with 88.1% or 312 individuals in the labor force. Within the labor force, individuals with college / associate degree education have the highest percentage of unemployment, with 3.7% or 8 of them being unemployed.
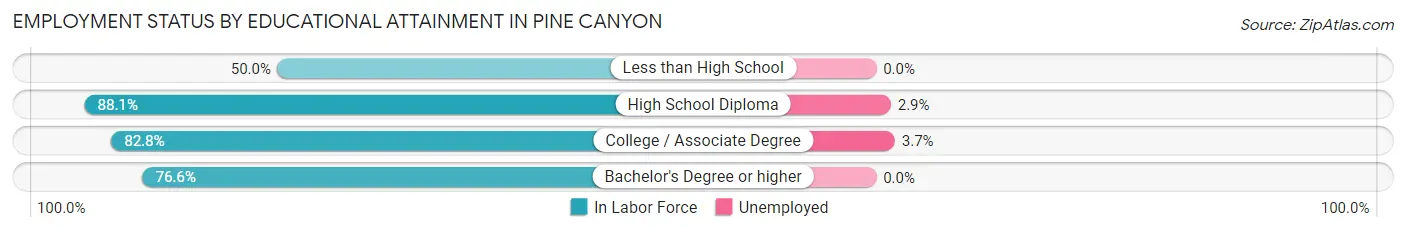
| Educational Attainment | In Labor Force | Unemployed |
| Less than High School | 126 (50.0%) | 0 (0.0%) |
| High School Diploma | 312 (88.1%) | 10 (2.9%) |
| College / Associate Degree | 217 (82.8%) | 10 (3.7%) |
| Bachelor's Degree or higher | 223 (76.6%) | 0 (0.0%) |
| Total | 879 (75.8%) | 22 (1.9%) |
Employment Occupations by Sex in Pine Canyon
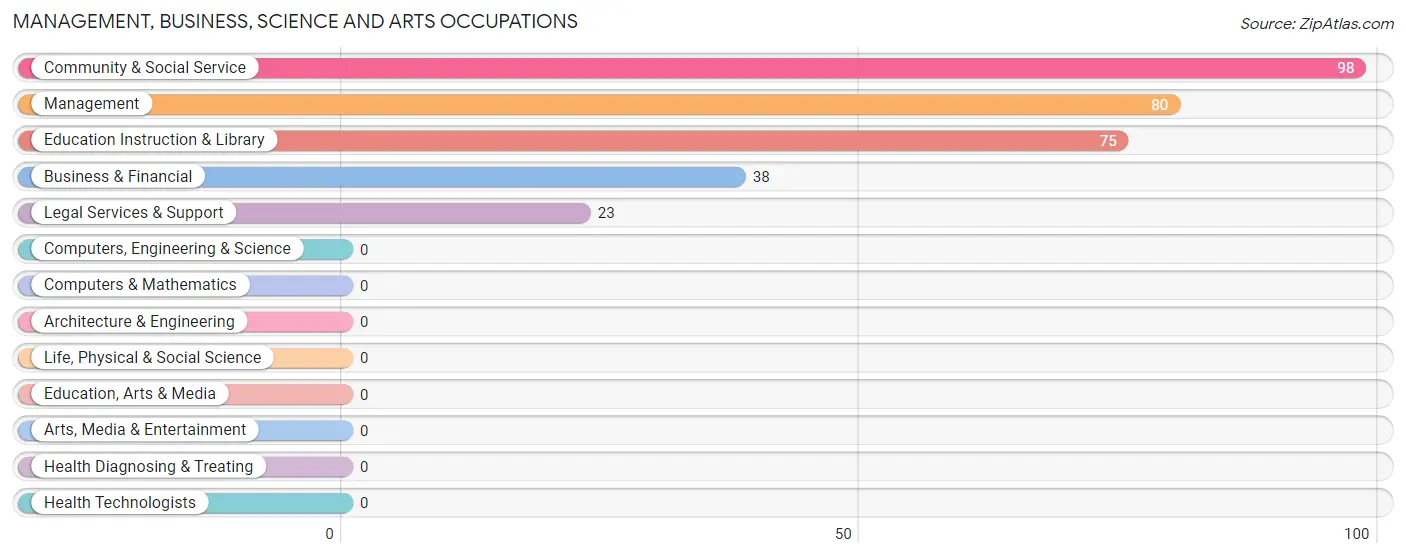
Management, Business, Science and Arts Occupations
The most common Management, Business, Science and Arts occupations in Pine Canyon are Community & Social Service (98 | 10.2%), Management (80 | 8.3%), Education Instruction & Library (75 | 7.8%), Business & Financial (38 | 4.0%), and Legal Services & Support (23 | 2.4%).
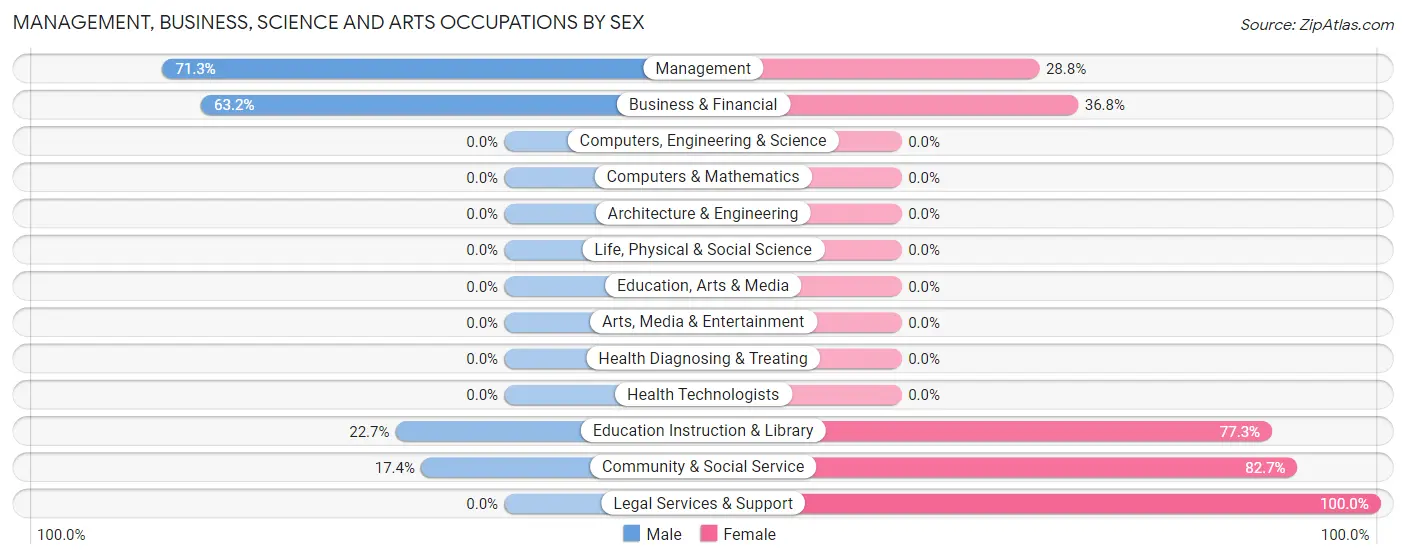
Management, Business, Science and Arts Occupations by Sex
Within the Management, Business, Science and Arts occupations in Pine Canyon, the most male-oriented occupations are Management (71.3%), Business & Financial (63.2%), and Education Instruction & Library (22.7%), while the most female-oriented occupations are Legal Services & Support (100.0%), Community & Social Service (82.7%), and Education Instruction & Library (77.3%).
| Occupation | Male | Female |
| Management | 57 (71.3%) | 23 (28.7%) |
| Business & Financial | 24 (63.2%) | 14 (36.8%) |
| Computers, Engineering & Science | 0 (0.0%) | 0 (0.0%) |
| Computers & Mathematics | 0 (0.0%) | 0 (0.0%) |
| Architecture & Engineering | 0 (0.0%) | 0 (0.0%) |
| Life, Physical & Social Science | 0 (0.0%) | 0 (0.0%) |
| Community & Social Service | 17 (17.3%) | 81 (82.7%) |
| Education, Arts & Media | 0 (0.0%) | 0 (0.0%) |
| Legal Services & Support | 0 (0.0%) | 23 (100.0%) |
| Education Instruction & Library | 17 (22.7%) | 58 (77.3%) |
| Arts, Media & Entertainment | 0 (0.0%) | 0 (0.0%) |
| Health Diagnosing & Treating | 0 (0.0%) | 0 (0.0%) |
| Health Technologists | 0 (0.0%) | 0 (0.0%) |
| Total (Category) | 98 (45.4%) | 118 (54.6%) |
| Total (Overall) | 622 (64.9%) | 337 (35.1%) |
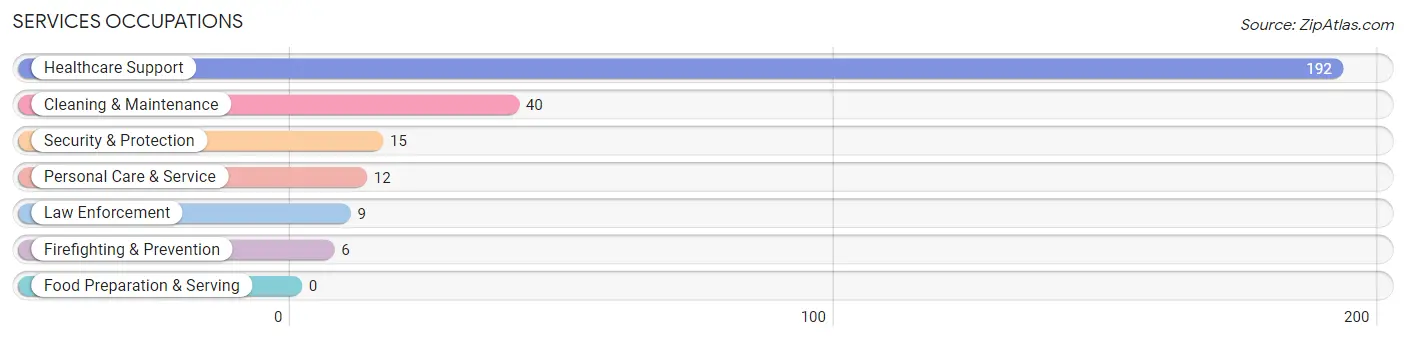
Services Occupations
The most common Services occupations in Pine Canyon are Healthcare Support (192 | 20.0%), Cleaning & Maintenance (40 | 4.2%), Security & Protection (15 | 1.6%), Personal Care & Service (12 | 1.3%), and Law Enforcement (9 | 0.9%).
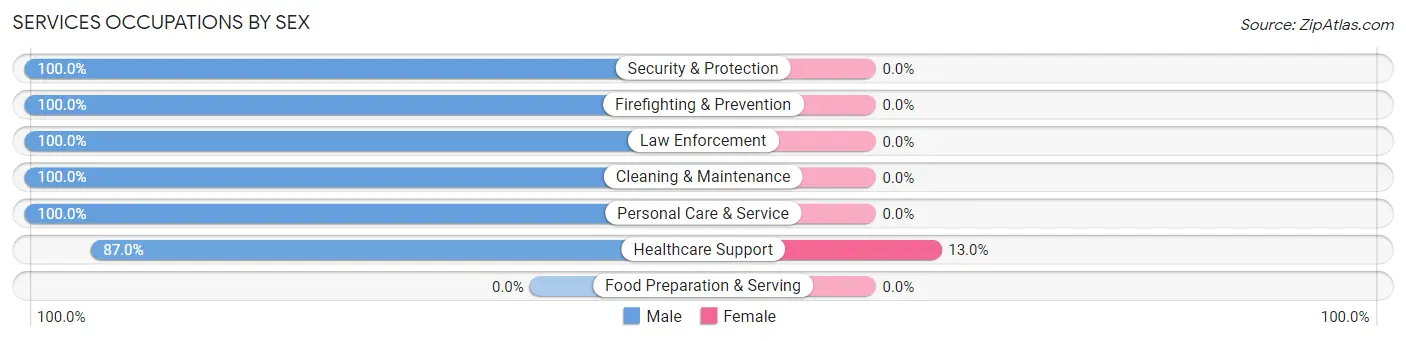
Services Occupations by Sex
| Occupation | Male | Female |
| Healthcare Support | 167 (87.0%) | 25 (13.0%) |
| Security & Protection | 15 (100.0%) | 0 (0.0%) |
| Firefighting & Prevention | 6 (100.0%) | 0 (0.0%) |
| Law Enforcement | 9 (100.0%) | 0 (0.0%) |
| Food Preparation & Serving | 0 (0.0%) | 0 (0.0%) |
| Cleaning & Maintenance | 40 (100.0%) | 0 (0.0%) |
| Personal Care & Service | 12 (100.0%) | 0 (0.0%) |
| Total (Category) | 234 (90.3%) | 25 (9.7%) |
| Total (Overall) | 622 (64.9%) | 337 (35.1%) |
Sales and Office Occupations
The most common Sales and Office occupations in Pine Canyon are Office & Administration (159 | 16.6%), and Sales & Related (10 | 1.0%).
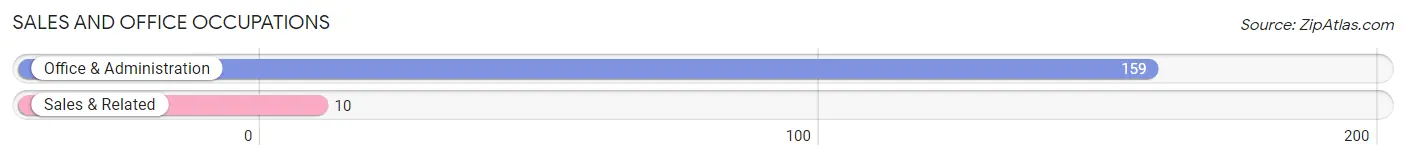
Sales and Office Occupations by Sex

| Occupation | Male | Female |
| Sales & Related | 10 (100.0%) | 0 (0.0%) |
| Office & Administration | 0 (0.0%) | 159 (100.0%) |
| Total (Category) | 10 (5.9%) | 159 (94.1%) |
| Total (Overall) | 622 (64.9%) | 337 (35.1%) |
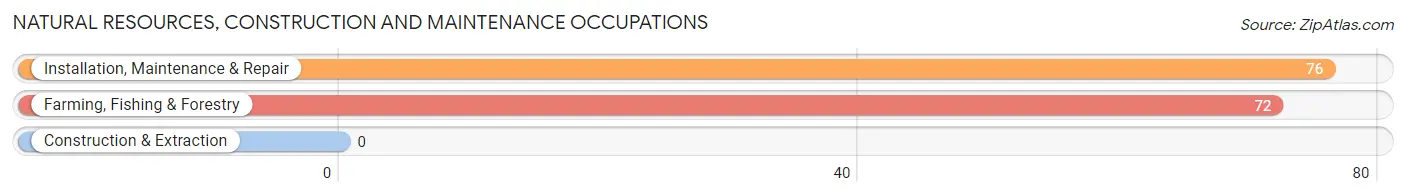
Natural Resources, Construction and Maintenance Occupations
The most common Natural Resources, Construction and Maintenance occupations in Pine Canyon are Installation, Maintenance & Repair (76 | 7.9%), and Farming, Fishing & Forestry (72 | 7.5%).
Natural Resources, Construction and Maintenance Occupations by Sex
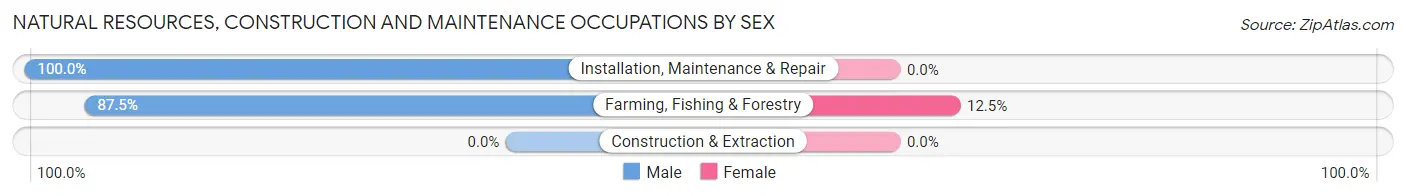
| Occupation | Male | Female |
| Farming, Fishing & Forestry | 63 (87.5%) | 9 (12.5%) |
| Construction & Extraction | 0 (0.0%) | 0 (0.0%) |
| Installation, Maintenance & Repair | 76 (100.0%) | 0 (0.0%) |
| Total (Category) | 139 (93.9%) | 9 (6.1%) |
| Total (Overall) | 622 (64.9%) | 337 (35.1%) |
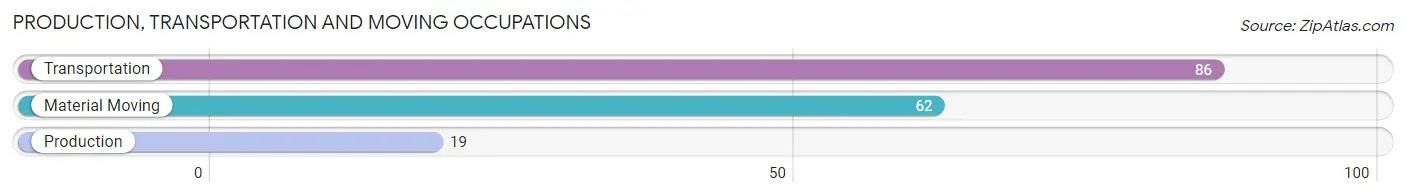
Production, Transportation and Moving Occupations
The most common Production, Transportation and Moving occupations in Pine Canyon are Transportation (86 | 9.0%), Material Moving (62 | 6.5%), and Production (19 | 2.0%).
Production, Transportation and Moving Occupations by Sex
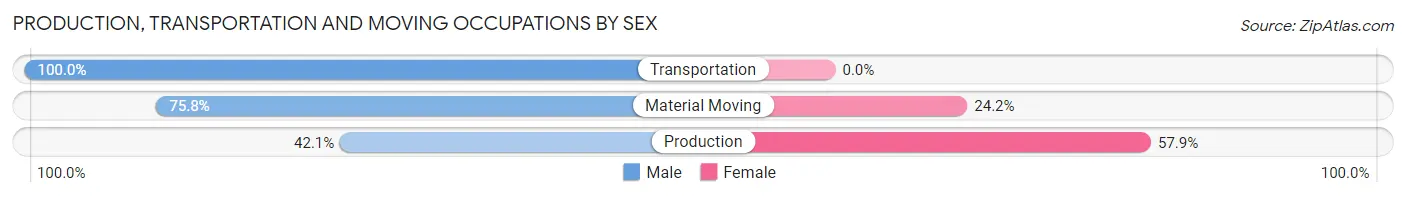
| Occupation | Male | Female |
| Production | 8 (42.1%) | 11 (57.9%) |
| Transportation | 86 (100.0%) | 0 (0.0%) |
| Material Moving | 47 (75.8%) | 15 (24.2%) |
| Total (Category) | 141 (84.4%) | 26 (15.6%) |
| Total (Overall) | 622 (64.9%) | 337 (35.1%) |
Employment Industries by Sex in Pine Canyon
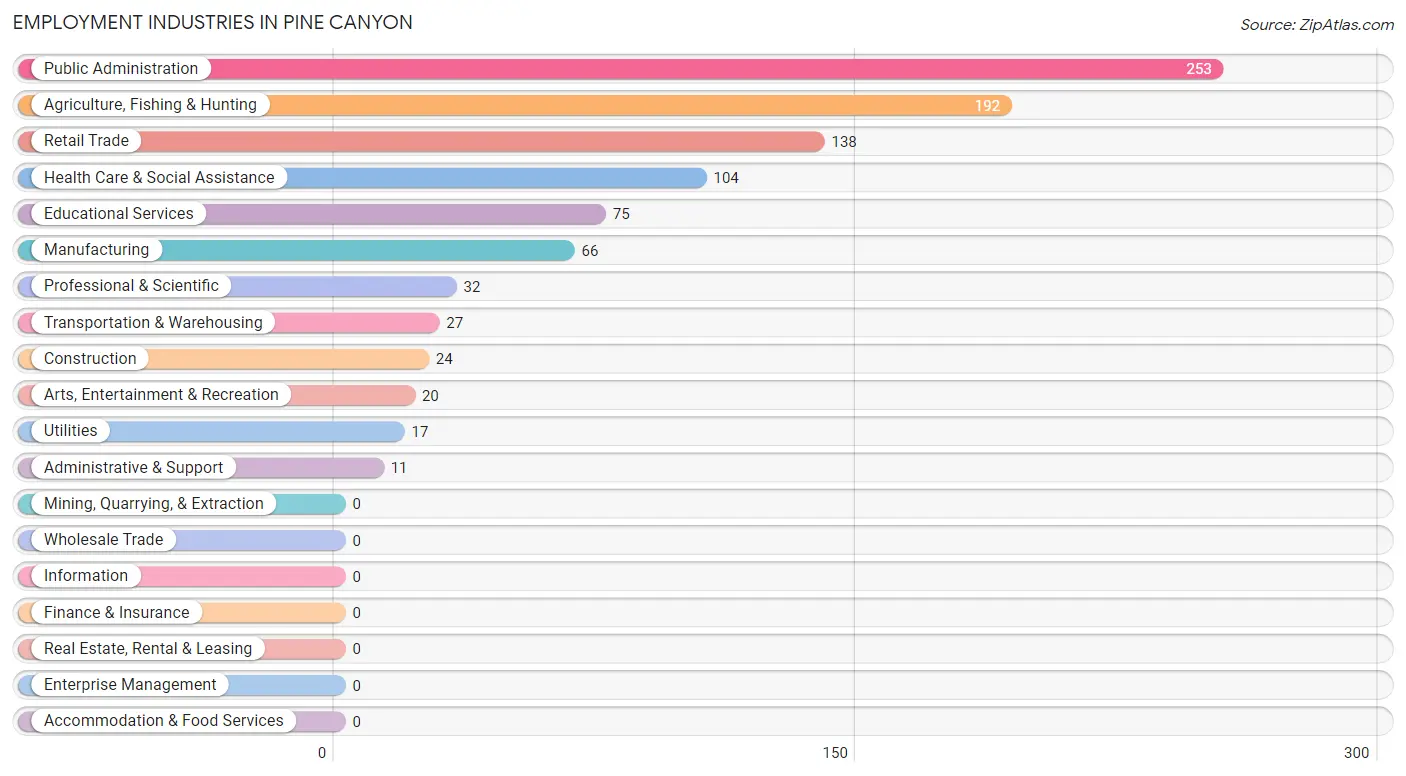
Employment Industries in Pine Canyon
The major employment industries in Pine Canyon include Public Administration (253 | 26.4%), Agriculture, Fishing & Hunting (192 | 20.0%), Retail Trade (138 | 14.4%), Health Care & Social Assistance (104 | 10.8%), and Educational Services (75 | 7.8%).
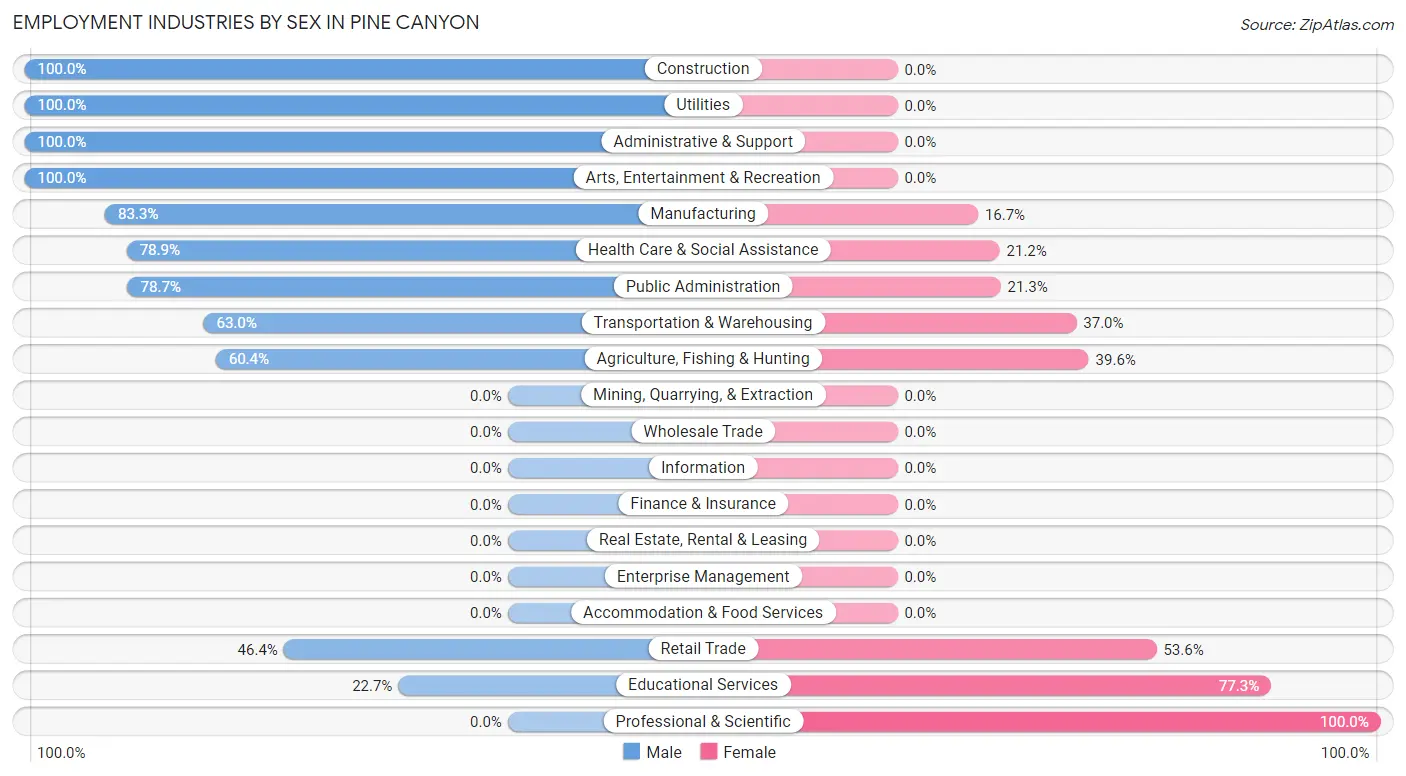
Employment Industries by Sex in Pine Canyon
The Pine Canyon industries that see more men than women are Construction (100.0%), Utilities (100.0%), and Administrative & Support (100.0%), whereas the industries that tend to have a higher number of women are Professional & Scientific (100.0%), Educational Services (77.3%), and Retail Trade (53.6%).
| Industry | Male | Female |
| Agriculture, Fishing & Hunting | 116 (60.4%) | 76 (39.6%) |
| Mining, Quarrying, & Extraction | 0 (0.0%) | 0 (0.0%) |
| Construction | 24 (100.0%) | 0 (0.0%) |
| Manufacturing | 55 (83.3%) | 11 (16.7%) |
| Wholesale Trade | 0 (0.0%) | 0 (0.0%) |
| Retail Trade | 64 (46.4%) | 74 (53.6%) |
| Transportation & Warehousing | 17 (63.0%) | 10 (37.0%) |
| Utilities | 17 (100.0%) | 0 (0.0%) |
| Information | 0 (0.0%) | 0 (0.0%) |
| Finance & Insurance | 0 (0.0%) | 0 (0.0%) |
| Real Estate, Rental & Leasing | 0 (0.0%) | 0 (0.0%) |
| Professional & Scientific | 0 (0.0%) | 32 (100.0%) |
| Enterprise Management | 0 (0.0%) | 0 (0.0%) |
| Administrative & Support | 11 (100.0%) | 0 (0.0%) |
| Educational Services | 17 (22.7%) | 58 (77.3%) |
| Health Care & Social Assistance | 82 (78.8%) | 22 (21.1%) |
| Arts, Entertainment & Recreation | 20 (100.0%) | 0 (0.0%) |
| Accommodation & Food Services | 0 (0.0%) | 0 (0.0%) |
| Public Administration | 199 (78.7%) | 54 (21.3%) |
| Total | 622 (64.9%) | 337 (35.1%) |
Education in Pine Canyon
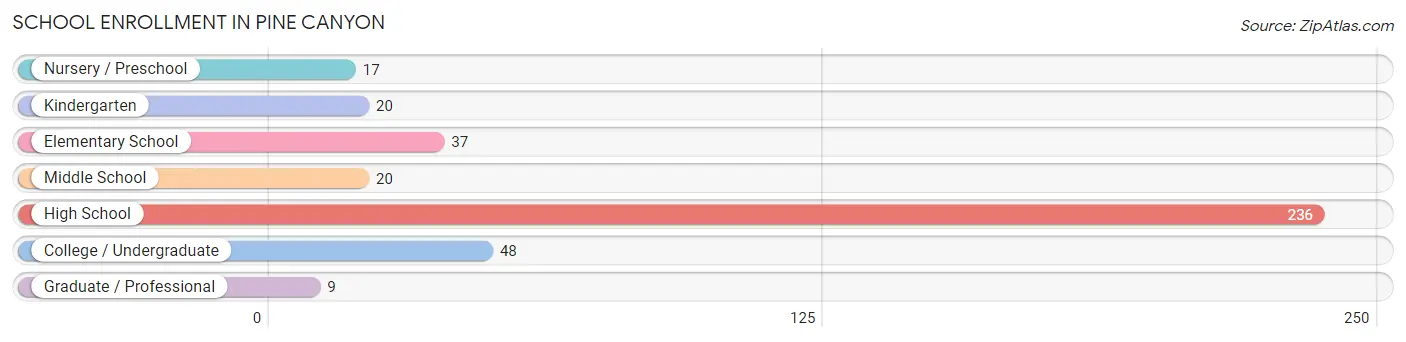
School Enrollment in Pine Canyon
The most common levels of schooling among the 387 students in Pine Canyon are high school (236 | 61.0%), college / undergraduate (48 | 12.4%), and elementary school (37 | 9.6%).
| School Level | # Students | % Students |
| Nursery / Preschool | 17 | 4.4% |
| Kindergarten | 20 | 5.2% |
| Elementary School | 37 | 9.6% |
| Middle School | 20 | 5.2% |
| High School | 236 | 61.0% |
| College / Undergraduate | 48 | 12.4% |
| Graduate / Professional | 9 | 2.3% |
| Total | 387 | 100.0% |
School Enrollment by Age by Funding Source in Pine Canyon
Out of a total of 387 students who are enrolled in schools in Pine Canyon, 18 (4.7%) attend a private institution, while the remaining 369 (95.3%) are enrolled in public schools. The age group of 20 to 24 year olds has the highest likelihood of being enrolled in private schools, with 9 (27.3% in the age bracket) enrolled. Conversely, the age group of 5 to 9 year old has the lowest likelihood of being enrolled in a private school, with 74 (100.0% in the age bracket) attending a public institution.
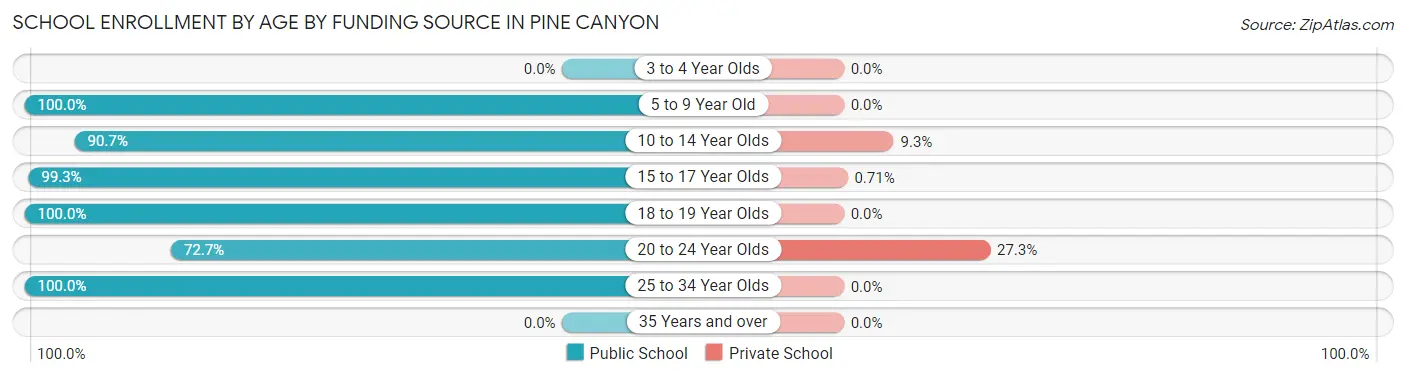
| Age Bracket | Public School | Private School |
| 3 to 4 Year Olds | 0 (0.0%) | 0 (0.0%) |
| 5 to 9 Year Old | 74 (100.0%) | 0 (0.0%) |
| 10 to 14 Year Olds | 78 (90.7%) | 8 (9.3%) |
| 15 to 17 Year Olds | 139 (99.3%) | 1 (0.7%) |
| 18 to 19 Year Olds | 46 (100.0%) | 0 (0.0%) |
| 20 to 24 Year Olds | 24 (72.7%) | 9 (27.3%) |
| 25 to 34 Year Olds | 8 (100.0%) | 0 (0.0%) |
| 35 Years and over | 0 (0.0%) | 0 (0.0%) |
| Total | 369 (95.3%) | 18 (4.7%) |
Educational Attainment by Field of Study in Pine Canyon
Education (184 | 37.4%), arts & humanities (167 | 33.9%), business (43 | 8.7%), science & technology (25 | 5.1%), and social sciences (23 | 4.7%) are the most common fields of study among 492 individuals in Pine Canyon who have obtained a bachelor's degree or higher.
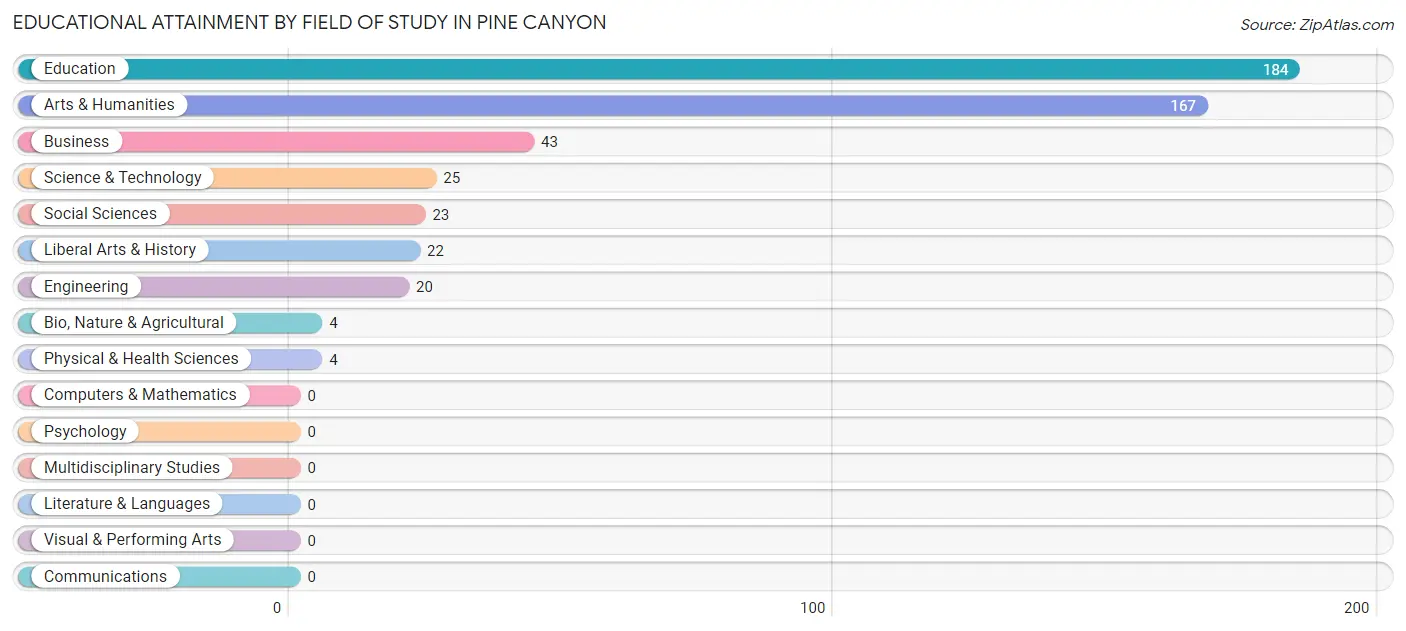
| Field of Study | # Graduates | % Graduates |
| Computers & Mathematics | 0 | 0.0% |
| Bio, Nature & Agricultural | 4 | 0.8% |
| Physical & Health Sciences | 4 | 0.8% |
| Psychology | 0 | 0.0% |
| Social Sciences | 23 | 4.7% |
| Engineering | 20 | 4.1% |
| Multidisciplinary Studies | 0 | 0.0% |
| Science & Technology | 25 | 5.1% |
| Business | 43 | 8.7% |
| Education | 184 | 37.4% |
| Literature & Languages | 0 | 0.0% |
| Liberal Arts & History | 22 | 4.5% |
| Visual & Performing Arts | 0 | 0.0% |
| Communications | 0 | 0.0% |
| Arts & Humanities | 167 | 33.9% |
| Total | 492 | 100.0% |
Transportation & Commute in Pine Canyon
Vehicle Availability by Sex in Pine Canyon
The most prevalent vehicle ownership categories in Pine Canyon are males with 2 vehicles (412, accounting for 66.2%) and females with 2 vehicles (249, making up 122.3%).
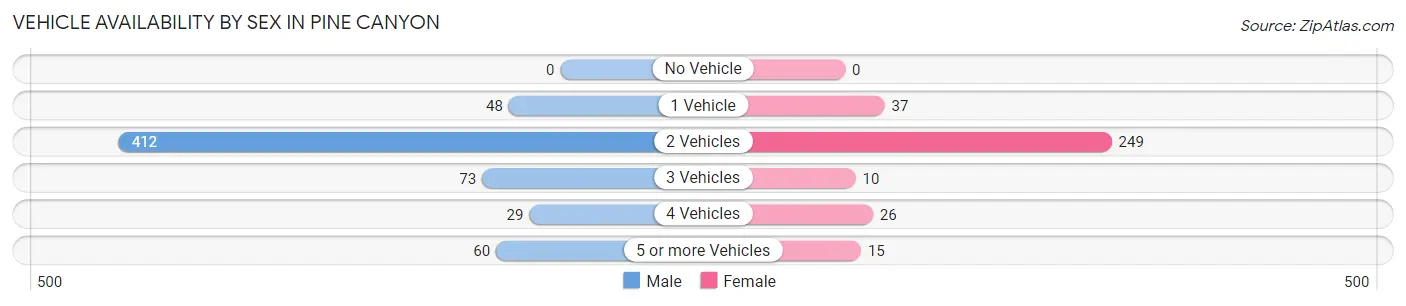
| Vehicles Available | Male | Female |
| No Vehicle | 0 (0.0%) | 0 (0.0%) |
| 1 Vehicle | 48 (7.7%) | 37 (11.0%) |
| 2 Vehicles | 412 (66.2%) | 249 (73.9%) |
| 3 Vehicles | 73 (11.7%) | 10 (3.0%) |
| 4 Vehicles | 29 (4.7%) | 26 (7.7%) |
| 5 or more Vehicles | 60 (9.7%) | 15 (4.4%) |
| Total | 622 (100.0%) | 337 (100.0%) |
Commute Time in Pine Canyon
The most frequently occuring commute durations in Pine Canyon are 45 to 59 minutes (187 commuters, 24.8%), 40 to 44 minutes (110 commuters, 14.6%), and 10 to 14 minutes (107 commuters, 14.2%).
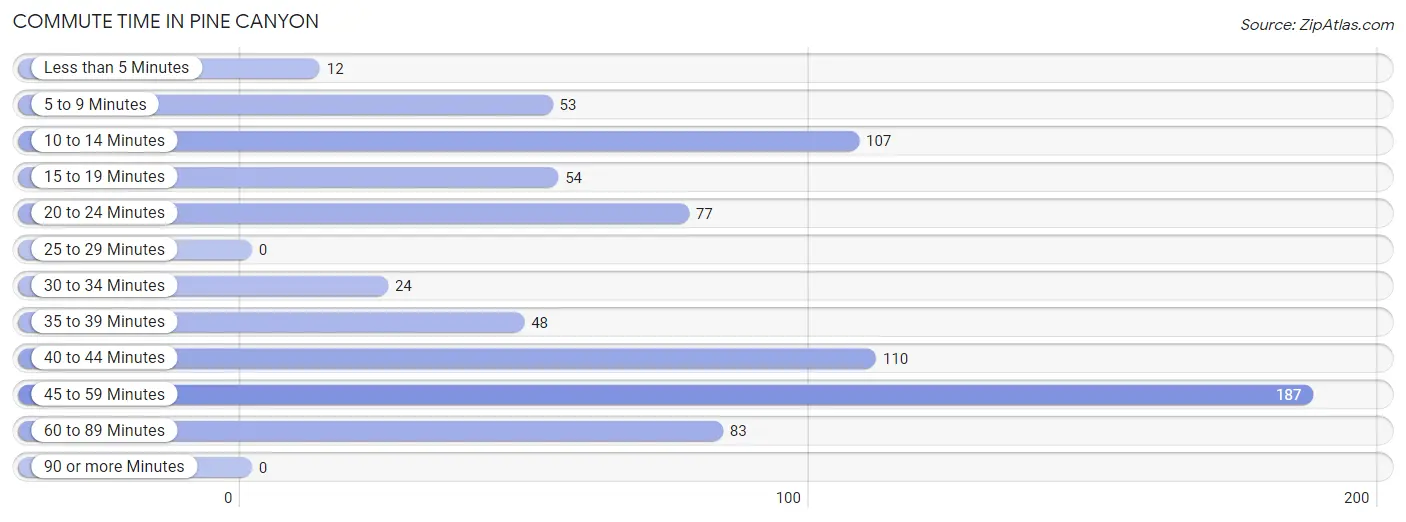
| Commute Time | # Commuters | % Commuters |
| Less than 5 Minutes | 12 | 1.6% |
| 5 to 9 Minutes | 53 | 7.0% |
| 10 to 14 Minutes | 107 | 14.2% |
| 15 to 19 Minutes | 54 | 7.1% |
| 20 to 24 Minutes | 77 | 10.2% |
| 25 to 29 Minutes | 0 | 0.0% |
| 30 to 34 Minutes | 24 | 3.2% |
| 35 to 39 Minutes | 48 | 6.4% |
| 40 to 44 Minutes | 110 | 14.6% |
| 45 to 59 Minutes | 187 | 24.8% |
| 60 to 89 Minutes | 83 | 11.0% |
| 90 or more Minutes | 0 | 0.0% |
Commute Time by Sex in Pine Canyon
The most common commute times in Pine Canyon are 40 to 44 minutes (110 commuters, 24.2%) for males and 45 to 59 minutes (107 commuters, 35.7%) for females.
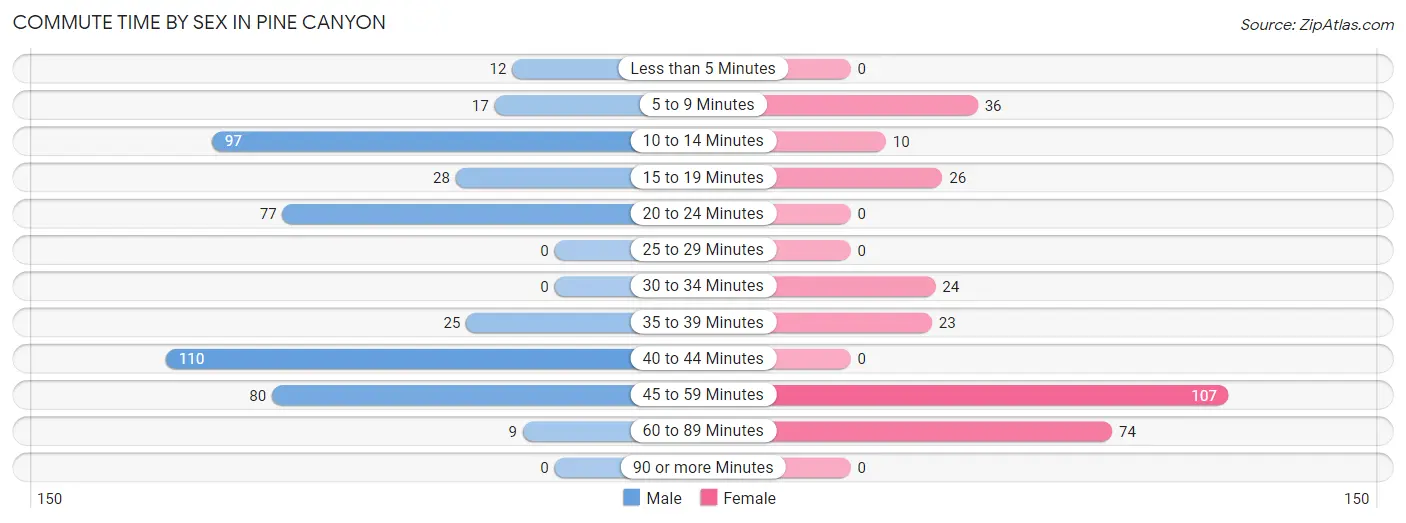
| Commute Time | Male | Female |
| Less than 5 Minutes | 12 (2.6%) | 0 (0.0%) |
| 5 to 9 Minutes | 17 (3.7%) | 36 (12.0%) |
| 10 to 14 Minutes | 97 (21.3%) | 10 (3.3%) |
| 15 to 19 Minutes | 28 (6.1%) | 26 (8.7%) |
| 20 to 24 Minutes | 77 (16.9%) | 0 (0.0%) |
| 25 to 29 Minutes | 0 (0.0%) | 0 (0.0%) |
| 30 to 34 Minutes | 0 (0.0%) | 24 (8.0%) |
| 35 to 39 Minutes | 25 (5.5%) | 23 (7.7%) |
| 40 to 44 Minutes | 110 (24.2%) | 0 (0.0%) |
| 45 to 59 Minutes | 80 (17.6%) | 107 (35.7%) |
| 60 to 89 Minutes | 9 (2.0%) | 74 (24.7%) |
| 90 or more Minutes | 0 (0.0%) | 0 (0.0%) |
Time of Departure to Work by Sex in Pine Canyon
The most frequent times of departure to work in Pine Canyon are 7:00 AM to 7:29 AM (170, 37.4%) for males and 8:00 AM to 8:29 AM (74, 24.7%) for females.
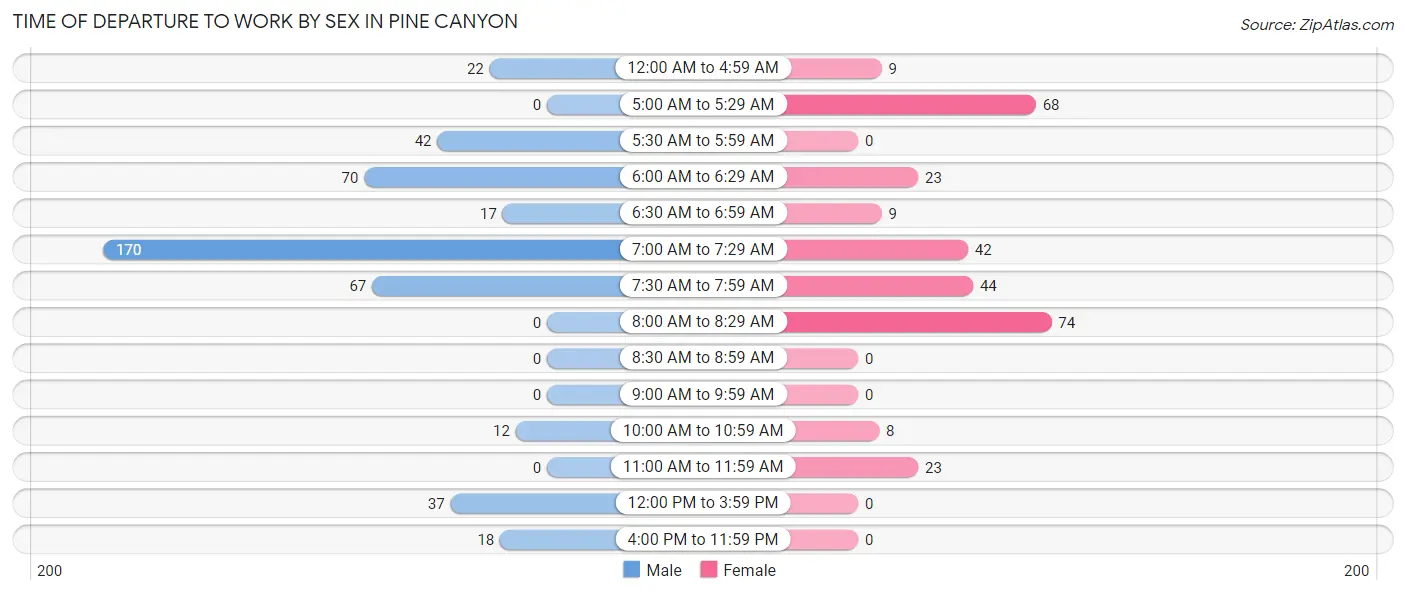
| Time of Departure | Male | Female |
| 12:00 AM to 4:59 AM | 22 (4.8%) | 9 (3.0%) |
| 5:00 AM to 5:29 AM | 0 (0.0%) | 68 (22.7%) |
| 5:30 AM to 5:59 AM | 42 (9.2%) | 0 (0.0%) |
| 6:00 AM to 6:29 AM | 70 (15.4%) | 23 (7.7%) |
| 6:30 AM to 6:59 AM | 17 (3.7%) | 9 (3.0%) |
| 7:00 AM to 7:29 AM | 170 (37.4%) | 42 (14.0%) |
| 7:30 AM to 7:59 AM | 67 (14.7%) | 44 (14.7%) |
| 8:00 AM to 8:29 AM | 0 (0.0%) | 74 (24.7%) |
| 8:30 AM to 8:59 AM | 0 (0.0%) | 0 (0.0%) |
| 9:00 AM to 9:59 AM | 0 (0.0%) | 0 (0.0%) |
| 10:00 AM to 10:59 AM | 12 (2.6%) | 8 (2.7%) |
| 11:00 AM to 11:59 AM | 0 (0.0%) | 23 (7.7%) |
| 12:00 PM to 3:59 PM | 37 (8.1%) | 0 (0.0%) |
| 4:00 PM to 11:59 PM | 18 (4.0%) | 0 (0.0%) |
| Total | 455 (100.0%) | 300 (100.0%) |
Housing Occupancy in Pine Canyon
Occupancy by Ownership in Pine Canyon
Of the total 750 dwellings in Pine Canyon, owner-occupied units account for 688 (91.7%), while renter-occupied units make up 62 (8.3%).
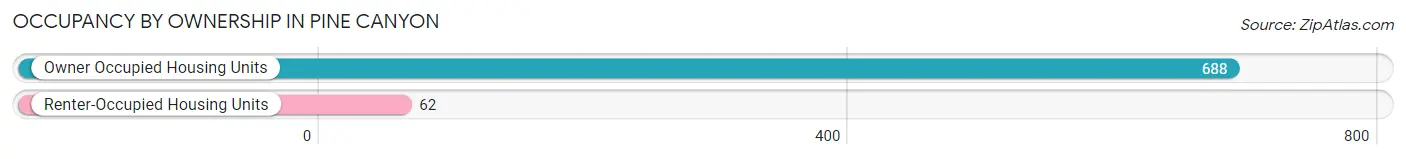
| Occupancy | # Housing Units | % Housing Units |
| Owner Occupied Housing Units | 688 | 91.7% |
| Renter-Occupied Housing Units | 62 | 8.3% |
| Total Occupied Housing Units | 750 | 100.0% |
Occupancy by Household Size in Pine Canyon
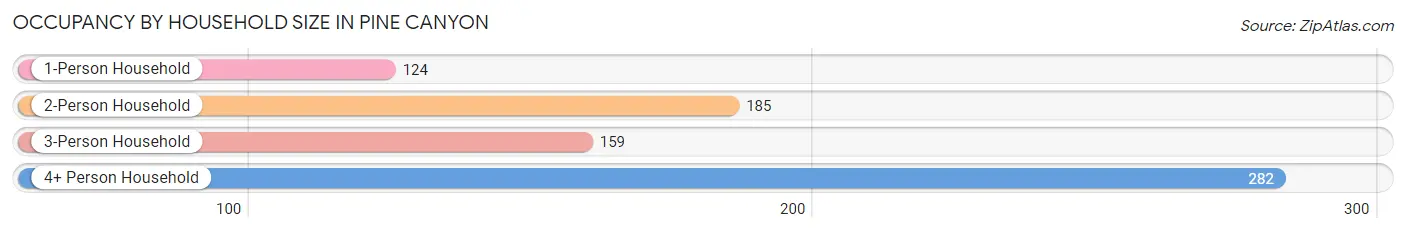
| Household Size | # Housing Units | % Housing Units |
| 1-Person Household | 124 | 16.5% |
| 2-Person Household | 185 | 24.7% |
| 3-Person Household | 159 | 21.2% |
| 4+ Person Household | 282 | 37.6% |
| Total Housing Units | 750 | 100.0% |
Occupancy by Ownership by Household Size in Pine Canyon
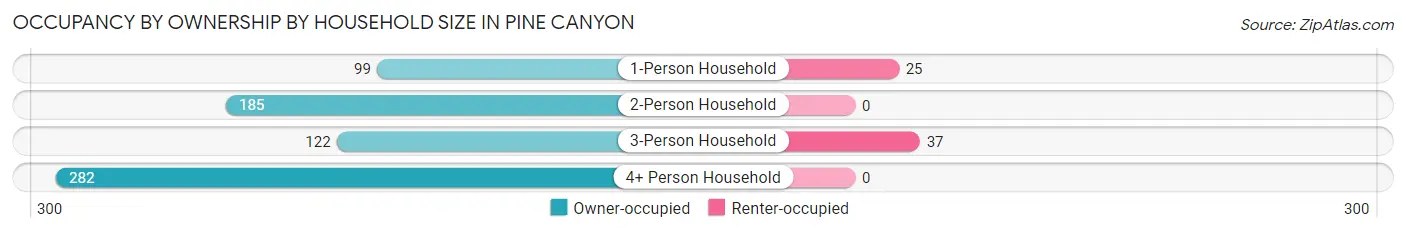
| Household Size | Owner-occupied | Renter-occupied |
| 1-Person Household | 99 (79.8%) | 25 (20.2%) |
| 2-Person Household | 185 (100.0%) | 0 (0.0%) |
| 3-Person Household | 122 (76.7%) | 37 (23.3%) |
| 4+ Person Household | 282 (100.0%) | 0 (0.0%) |
| Total Housing Units | 688 (91.7%) | 62 (8.3%) |
Occupancy by Educational Attainment in Pine Canyon
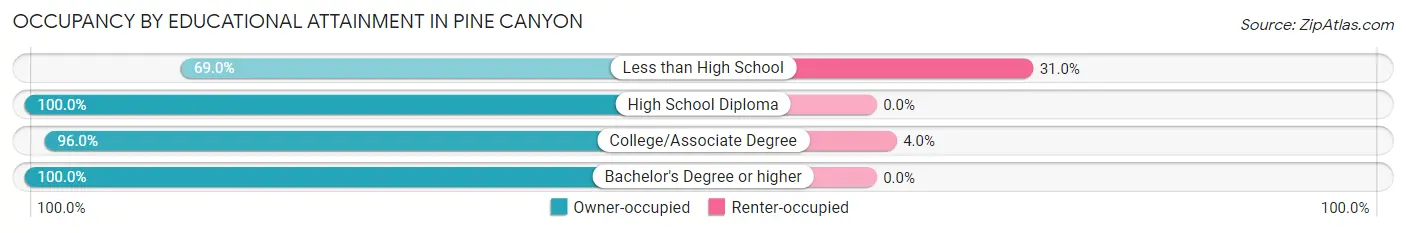
| Household Size | Owner-occupied | Renter-occupied |
| Less than High School | 120 (69.0%) | 54 (31.0%) |
| High School Diploma | 129 (100.0%) | 0 (0.0%) |
| College/Associate Degree | 193 (96.0%) | 8 (4.0%) |
| Bachelor's Degree or higher | 246 (100.0%) | 0 (0.0%) |
Occupancy by Age of Householder in Pine Canyon
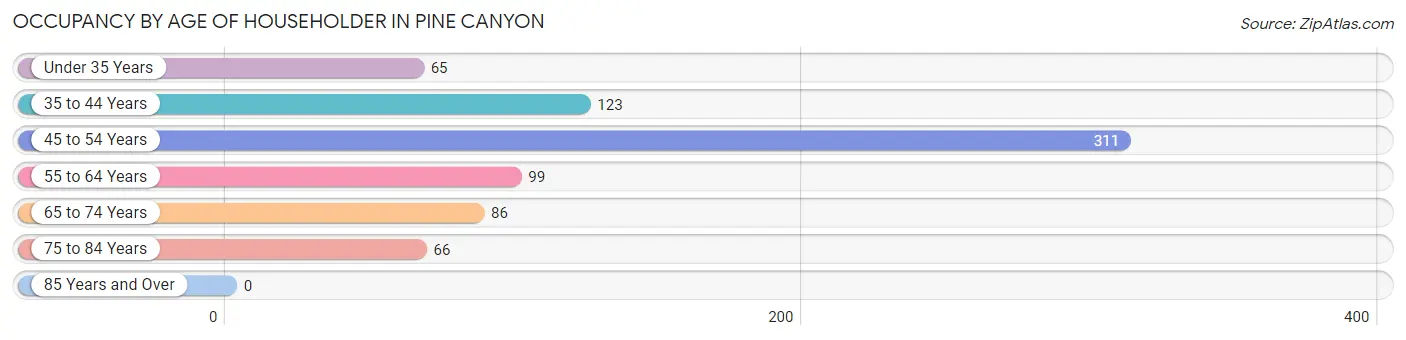
| Age Bracket | # Households | % Households |
| Under 35 Years | 65 | 8.7% |
| 35 to 44 Years | 123 | 16.4% |
| 45 to 54 Years | 311 | 41.5% |
| 55 to 64 Years | 99 | 13.2% |
| 65 to 74 Years | 86 | 11.5% |
| 75 to 84 Years | 66 | 8.8% |
| 85 Years and Over | 0 | 0.0% |
| Total | 750 | 100.0% |
Housing Finances in Pine Canyon
Median Income by Occupancy in Pine Canyon
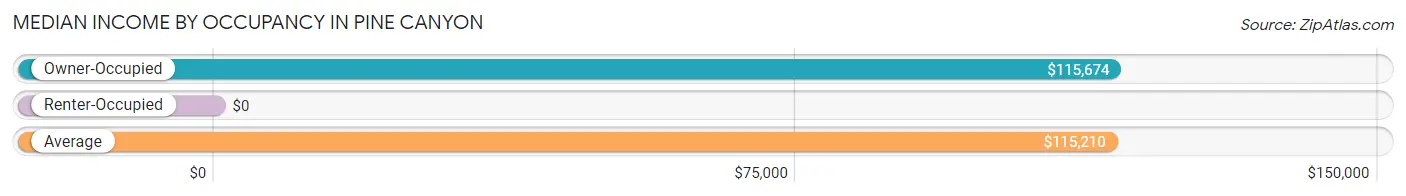
| Occupancy Type | # Households | Median Income |
| Owner-Occupied | 688 (91.7%) | $115,674 |
| Renter-Occupied | 62 (8.3%) | $0 |
| Average | 750 (100.0%) | $115,210 |
Occupancy by Householder Income Bracket in Pine Canyon
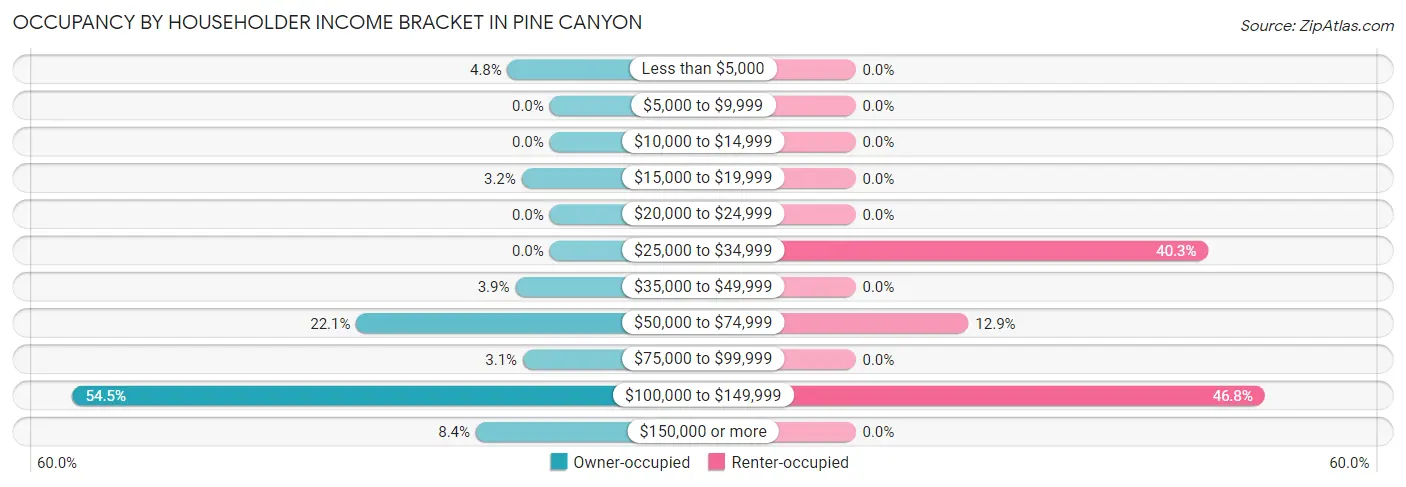
| Income Bracket | Owner-occupied | Renter-occupied |
| Less than $5,000 | 33 (4.8%) | 0 (0.0%) |
| $5,000 to $9,999 | 0 (0.0%) | 0 (0.0%) |
| $10,000 to $14,999 | 0 (0.0%) | 0 (0.0%) |
| $15,000 to $19,999 | 22 (3.2%) | 0 (0.0%) |
| $20,000 to $24,999 | 0 (0.0%) | 0 (0.0%) |
| $25,000 to $34,999 | 0 (0.0%) | 25 (40.3%) |
| $35,000 to $49,999 | 27 (3.9%) | 0 (0.0%) |
| $50,000 to $74,999 | 152 (22.1%) | 8 (12.9%) |
| $75,000 to $99,999 | 21 (3.0%) | 0 (0.0%) |
| $100,000 to $149,999 | 375 (54.5%) | 29 (46.8%) |
| $150,000 or more | 58 (8.4%) | 0 (0.0%) |
| Total | 688 (100.0%) | 62 (100.0%) |
Monthly Housing Cost Tiers in Pine Canyon
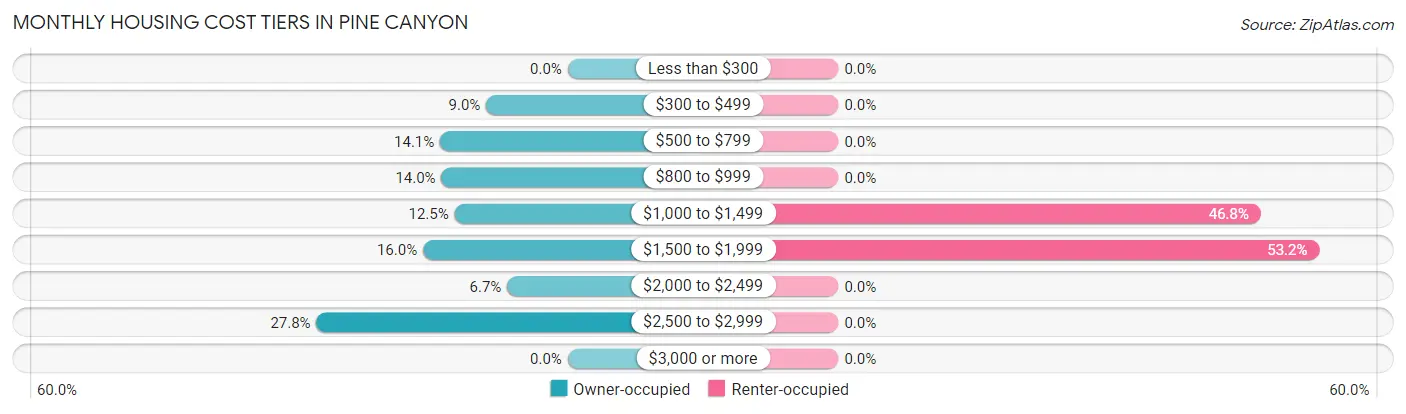
| Monthly Cost | Owner-occupied | Renter-occupied |
| Less than $300 | 0 (0.0%) | 0 (0.0%) |
| $300 to $499 | 62 (9.0%) | 0 (0.0%) |
| $500 to $799 | 97 (14.1%) | 0 (0.0%) |
| $800 to $999 | 96 (14.0%) | 0 (0.0%) |
| $1,000 to $1,499 | 86 (12.5%) | 29 (46.8%) |
| $1,500 to $1,999 | 110 (16.0%) | 33 (53.2%) |
| $2,000 to $2,499 | 46 (6.7%) | 0 (0.0%) |
| $2,500 to $2,999 | 191 (27.8%) | 0 (0.0%) |
| $3,000 or more | 0 (0.0%) | 0 (0.0%) |
| Total | 688 (100.0%) | 62 (100.0%) |
Physical Housing Characteristics in Pine Canyon
Housing Structures in Pine Canyon
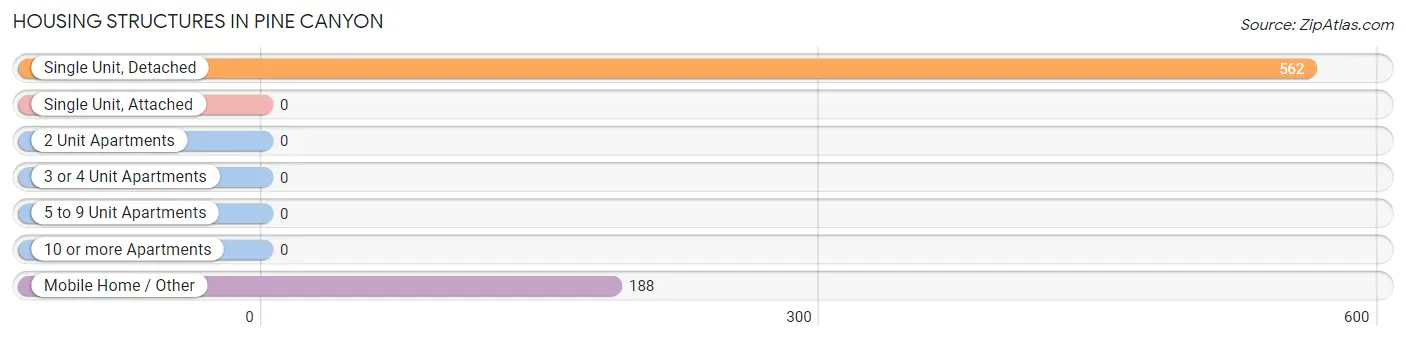
| Structure Type | # Housing Units | % Housing Units |
| Single Unit, Detached | 562 | 74.9% |
| Single Unit, Attached | 0 | 0.0% |
| 2 Unit Apartments | 0 | 0.0% |
| 3 or 4 Unit Apartments | 0 | 0.0% |
| 5 to 9 Unit Apartments | 0 | 0.0% |
| 10 or more Apartments | 0 | 0.0% |
| Mobile Home / Other | 188 | 25.1% |
| Total | 750 | 100.0% |
Housing Structures by Occupancy in Pine Canyon
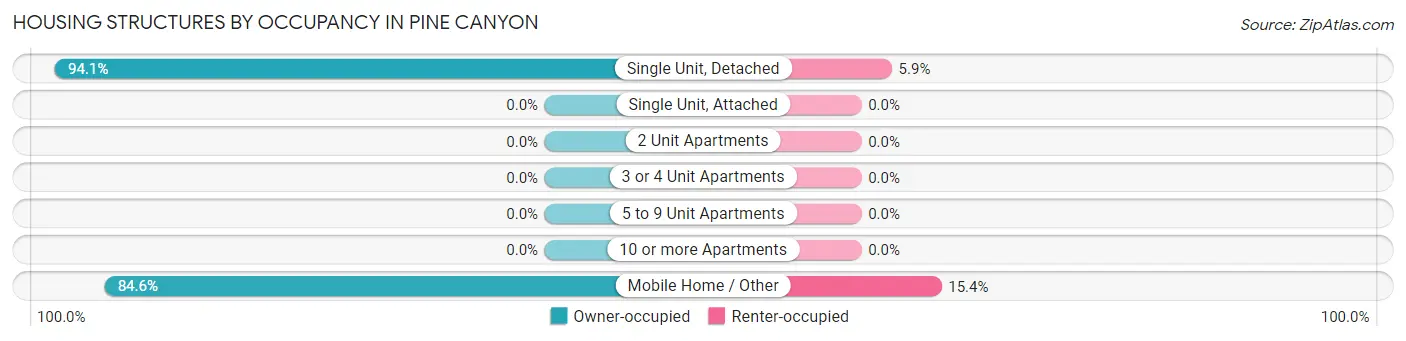
| Structure Type | Owner-occupied | Renter-occupied |
| Single Unit, Detached | 529 (94.1%) | 33 (5.9%) |
| Single Unit, Attached | 0 (0.0%) | 0 (0.0%) |
| 2 Unit Apartments | 0 (0.0%) | 0 (0.0%) |
| 3 or 4 Unit Apartments | 0 (0.0%) | 0 (0.0%) |
| 5 to 9 Unit Apartments | 0 (0.0%) | 0 (0.0%) |
| 10 or more Apartments | 0 (0.0%) | 0 (0.0%) |
| Mobile Home / Other | 159 (84.6%) | 29 (15.4%) |
| Total | 688 (91.7%) | 62 (8.3%) |
Housing Structures by Number of Rooms in Pine Canyon
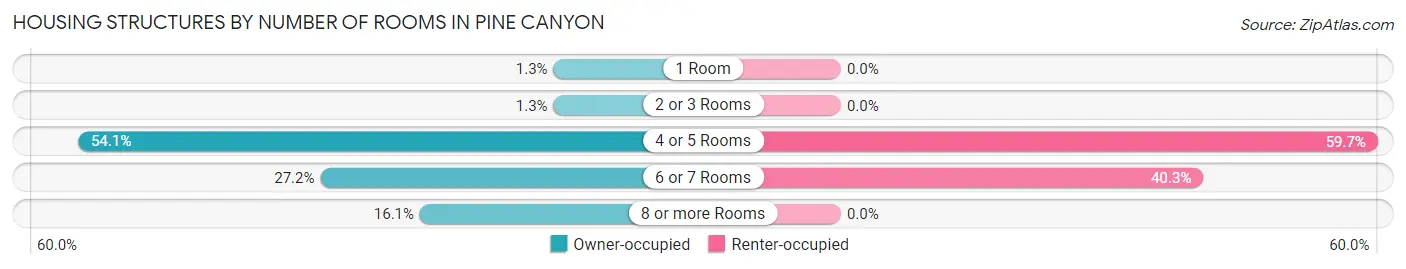
| Number of Rooms | Owner-occupied | Renter-occupied |
| 1 Room | 9 (1.3%) | 0 (0.0%) |
| 2 or 3 Rooms | 9 (1.3%) | 0 (0.0%) |
| 4 or 5 Rooms | 372 (54.1%) | 37 (59.7%) |
| 6 or 7 Rooms | 187 (27.2%) | 25 (40.3%) |
| 8 or more Rooms | 111 (16.1%) | 0 (0.0%) |
| Total | 688 (100.0%) | 62 (100.0%) |
Housing Structure by Heating Type in Pine Canyon
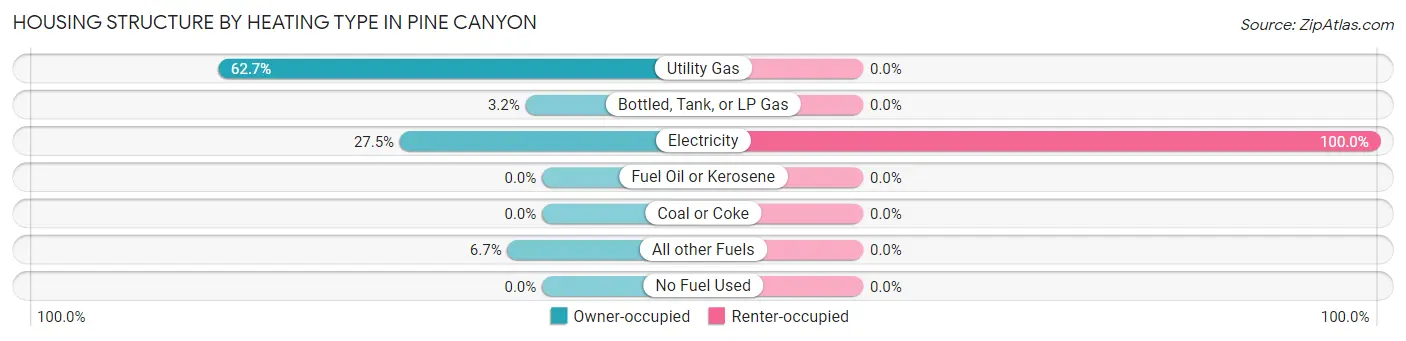
| Heating Type | Owner-occupied | Renter-occupied |
| Utility Gas | 431 (62.6%) | 0 (0.0%) |
| Bottled, Tank, or LP Gas | 22 (3.2%) | 0 (0.0%) |
| Electricity | 189 (27.5%) | 62 (100.0%) |
| Fuel Oil or Kerosene | 0 (0.0%) | 0 (0.0%) |
| Coal or Coke | 0 (0.0%) | 0 (0.0%) |
| All other Fuels | 46 (6.7%) | 0 (0.0%) |
| No Fuel Used | 0 (0.0%) | 0 (0.0%) |
| Total | 688 (100.0%) | 62 (100.0%) |
Household Vehicle Usage in Pine Canyon
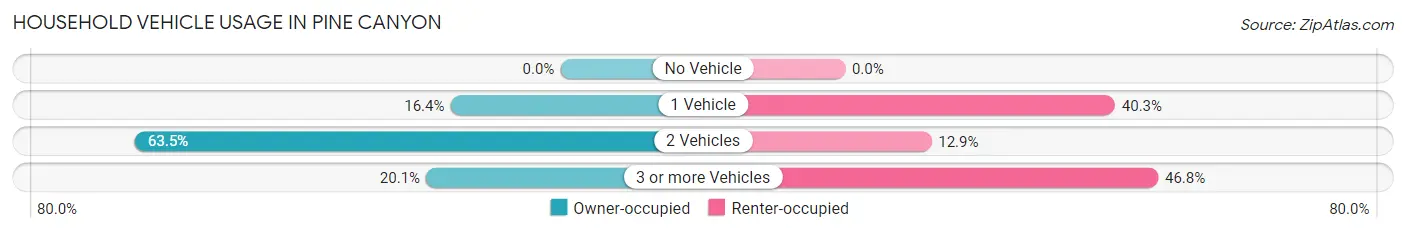
| Vehicles per Household | Owner-occupied | Renter-occupied |
| No Vehicle | 0 (0.0%) | 0 (0.0%) |
| 1 Vehicle | 113 (16.4%) | 25 (40.3%) |
| 2 Vehicles | 437 (63.5%) | 8 (12.9%) |
| 3 or more Vehicles | 138 (20.1%) | 29 (46.8%) |
| Total | 688 (100.0%) | 62 (100.0%) |
Real Estate & Mortgages in Pine Canyon
Real Estate and Mortgage Overview in Pine Canyon
| Characteristic | Without Mortgage | With Mortgage |
| Housing Units | 272 | 416 |
| Median Property Value | - | - |
| Median Household Income | $68,813 | $42 |
| Monthly Housing Costs | $763 | $0 |
| Real Estate Taxes | $640 | $0 |
Property Value by Mortgage Status in Pine Canyon
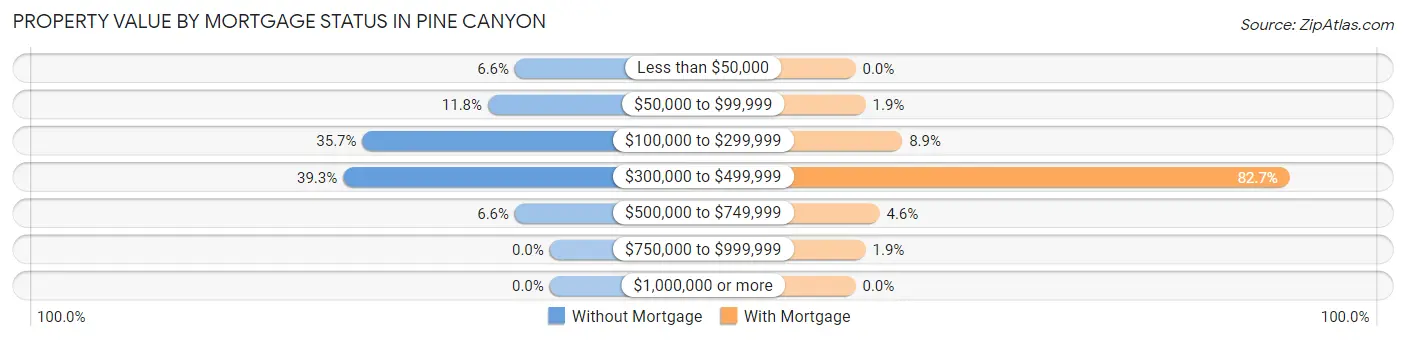
| Property Value | Without Mortgage | With Mortgage |
| Less than $50,000 | 18 (6.6%) | 0 (0.0%) |
| $50,000 to $99,999 | 32 (11.8%) | 8 (1.9%) |
| $100,000 to $299,999 | 97 (35.7%) | 37 (8.9%) |
| $300,000 to $499,999 | 107 (39.3%) | 344 (82.7%) |
| $500,000 to $749,999 | 18 (6.6%) | 19 (4.6%) |
| $750,000 to $999,999 | 0 (0.0%) | 8 (1.9%) |
| $1,000,000 or more | 0 (0.0%) | 0 (0.0%) |
| Total | 272 (100.0%) | 416 (100.0%) |
Household Income by Mortgage Status in Pine Canyon
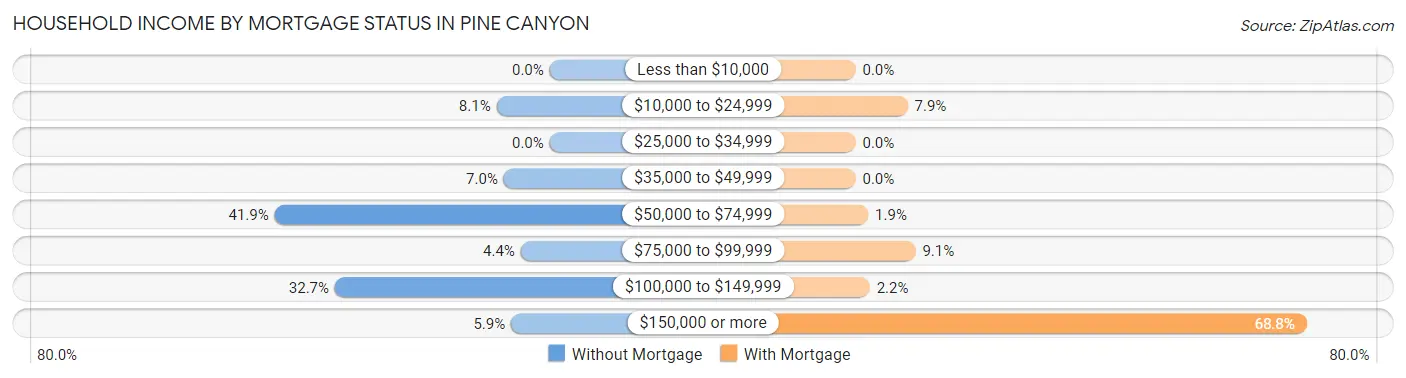
| Household Income | Without Mortgage | With Mortgage |
| Less than $10,000 | 0 (0.0%) | 0 (0.0%) |
| $10,000 to $24,999 | 22 (8.1%) | 33 (7.9%) |
| $25,000 to $34,999 | 0 (0.0%) | 0 (0.0%) |
| $35,000 to $49,999 | 19 (7.0%) | 0 (0.0%) |
| $50,000 to $74,999 | 114 (41.9%) | 8 (1.9%) |
| $75,000 to $99,999 | 12 (4.4%) | 38 (9.1%) |
| $100,000 to $149,999 | 89 (32.7%) | 9 (2.2%) |
| $150,000 or more | 16 (5.9%) | 286 (68.8%) |
| Total | 272 (100.0%) | 416 (100.0%) |
Property Value to Household Income Ratio in Pine Canyon
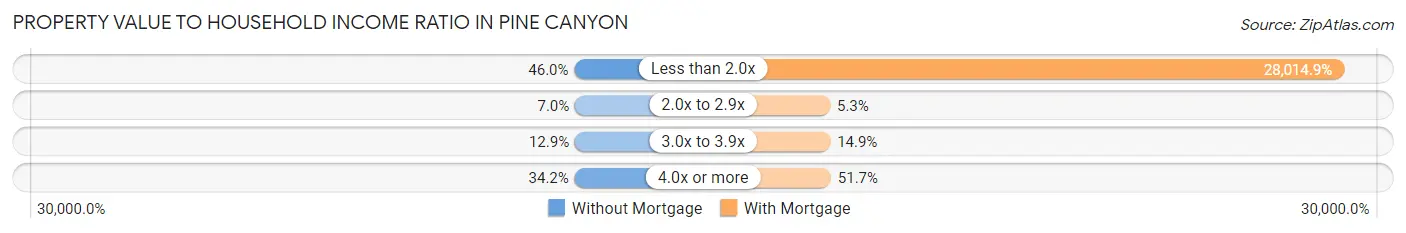
| Value-to-Income Ratio | Without Mortgage | With Mortgage |
| Less than 2.0x | 125 (46.0%) | 116,542 (28,014.9%) |
| 2.0x to 2.9x | 19 (7.0%) | 22 (5.3%) |
| 3.0x to 3.9x | 35 (12.9%) | 62 (14.9%) |
| 4.0x or more | 93 (34.2%) | 215 (51.7%) |
| Total | 272 (100.0%) | 416 (100.0%) |
Real Estate Taxes by Mortgage Status in Pine Canyon
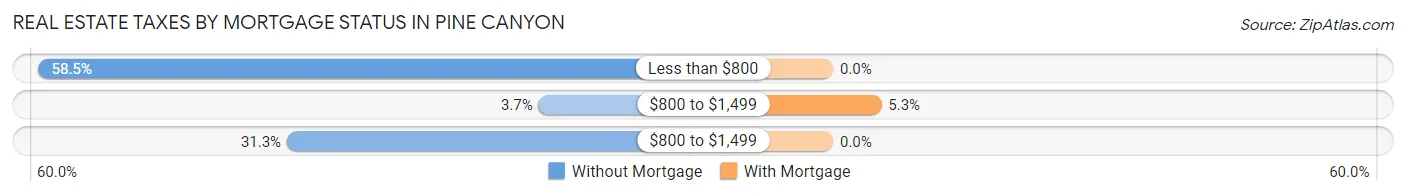
| Property Taxes | Without Mortgage | With Mortgage |
| Less than $800 | 159 (58.5%) | 0 (0.0%) |
| $800 to $1,499 | 10 (3.7%) | 22 (5.3%) |
| $800 to $1,499 | 85 (31.2%) | 0 (0.0%) |
| Total | 272 (100.0%) | 416 (100.0%) |
Health & Disability in Pine Canyon
Health Insurance Coverage by Age in Pine Canyon
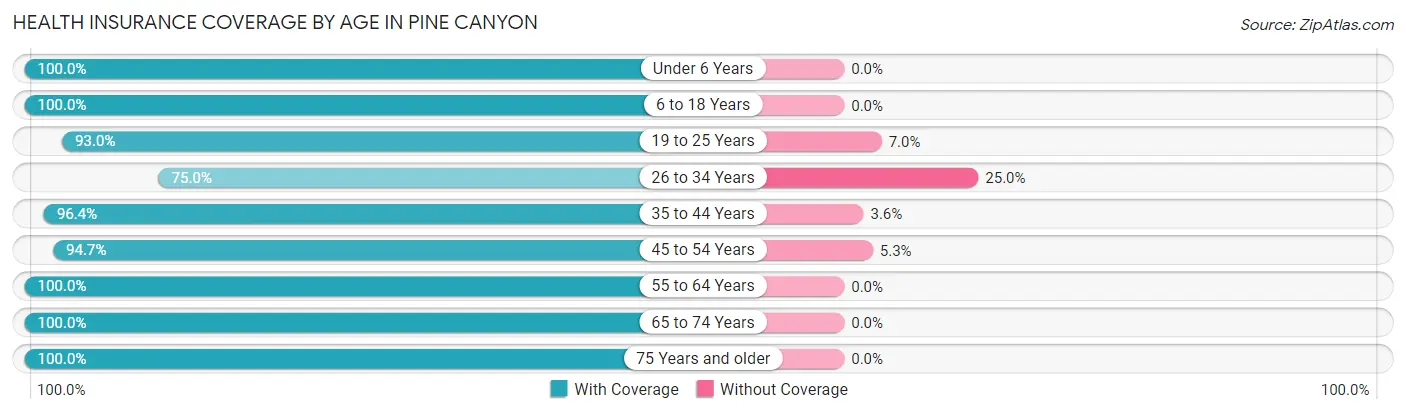
| Age Bracket | With Coverage | Without Coverage |
| Under 6 Years | 17 (100.0%) | 0 (0.0%) |
| 6 to 18 Years | 500 (100.0%) | 0 (0.0%) |
| 19 to 25 Years | 120 (93.0%) | 9 (7.0%) |
| 26 to 34 Years | 69 (75.0%) | 23 (25.0%) |
| 35 to 44 Years | 215 (96.4%) | 8 (3.6%) |
| 45 to 54 Years | 534 (94.7%) | 30 (5.3%) |
| 55 to 64 Years | 226 (100.0%) | 0 (0.0%) |
| 65 to 74 Years | 128 (100.0%) | 0 (0.0%) |
| 75 Years and older | 210 (100.0%) | 0 (0.0%) |
| Total | 2,019 (96.7%) | 70 (3.4%) |
Health Insurance Coverage by Citizenship Status in Pine Canyon
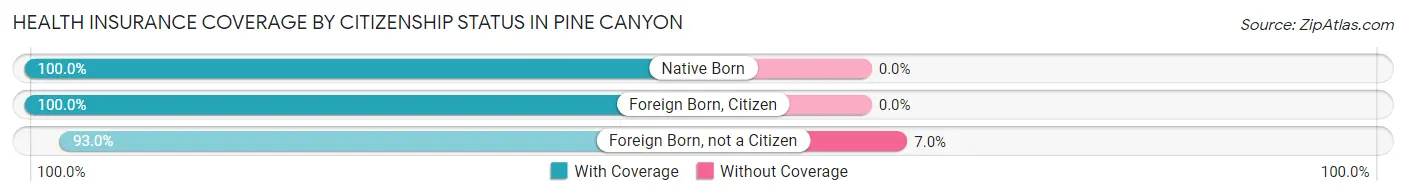
| Citizenship Status | With Coverage | Without Coverage |
| Native Born | 17 (100.0%) | 0 (0.0%) |
| Foreign Born, Citizen | 500 (100.0%) | 0 (0.0%) |
| Foreign Born, not a Citizen | 120 (93.0%) | 9 (7.0%) |
Health Insurance Coverage by Household Income in Pine Canyon
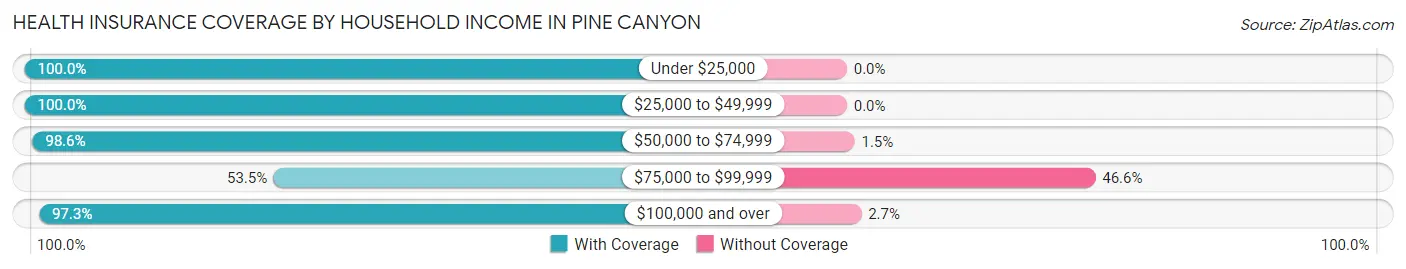
| Household Income | With Coverage | Without Coverage |
| Under $25,000 | 108 (100.0%) | 0 (0.0%) |
| $25,000 to $49,999 | 72 (100.0%) | 0 (0.0%) |
| $50,000 to $74,999 | 545 (98.6%) | 8 (1.5%) |
| $75,000 to $99,999 | 31 (53.4%) | 27 (46.6%) |
| $100,000 and over | 1,263 (97.3%) | 35 (2.7%) |
Public vs Private Health Insurance Coverage by Age in Pine Canyon
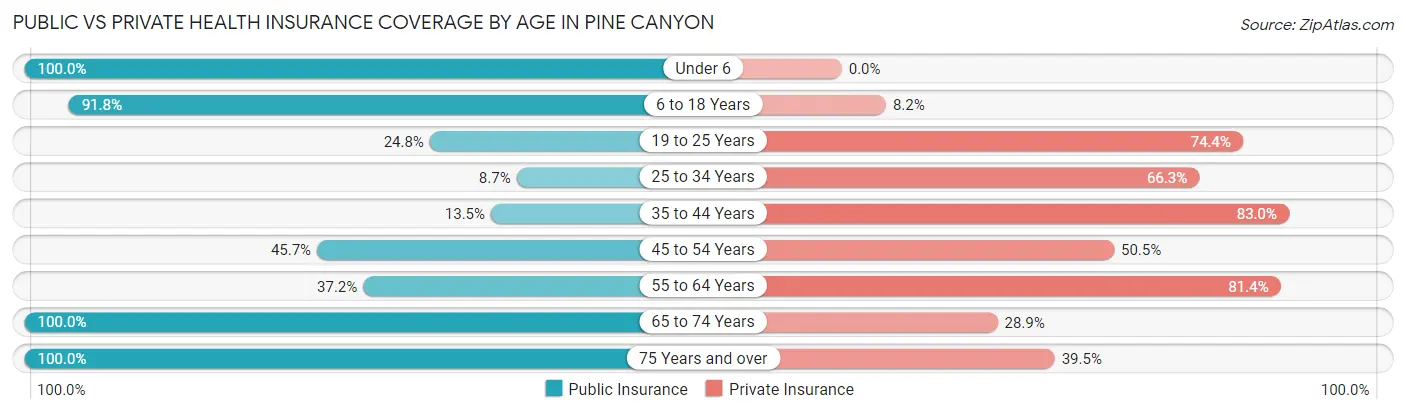
| Age Bracket | Public Insurance | Private Insurance |
| Under 6 | 17 (100.0%) | 0 (0.0%) |
| 6 to 18 Years | 459 (91.8%) | 41 (8.2%) |
| 19 to 25 Years | 32 (24.8%) | 96 (74.4%) |
| 25 to 34 Years | 8 (8.7%) | 61 (66.3%) |
| 35 to 44 Years | 30 (13.5%) | 185 (83.0%) |
| 45 to 54 Years | 258 (45.7%) | 285 (50.5%) |
| 55 to 64 Years | 84 (37.2%) | 184 (81.4%) |
| 65 to 74 Years | 128 (100.0%) | 37 (28.9%) |
| 75 Years and over | 210 (100.0%) | 83 (39.5%) |
| Total | 1,226 (58.7%) | 972 (46.5%) |
Disability Status by Sex by Age in Pine Canyon
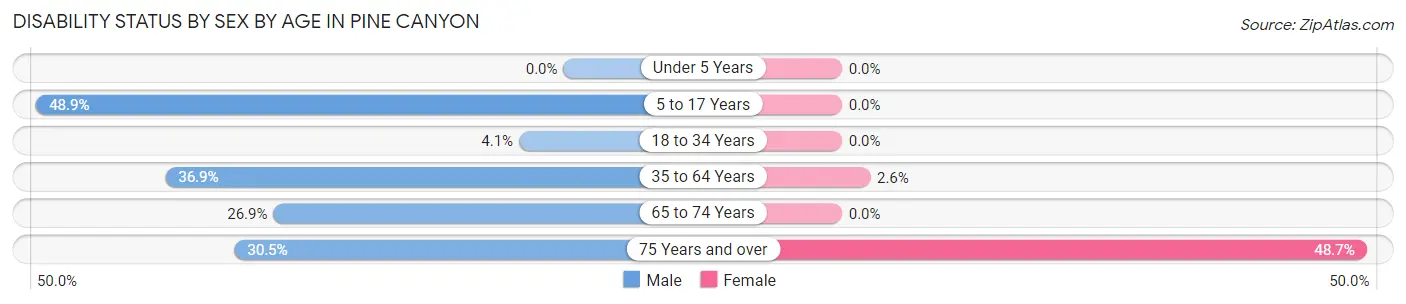
| Age Bracket | Male | Female |
| Under 5 Years | 0 (0.0%) | 0 (0.0%) |
| 5 to 17 Years | 182 (48.9%) | 0 (0.0%) |
| 18 to 34 Years | 8 (4.1%) | 0 (0.0%) |
| 35 to 64 Years | 205 (36.9%) | 12 (2.6%) |
| 65 to 74 Years | 21 (26.9%) | 0 (0.0%) |
| 75 Years and over | 29 (30.5%) | 56 (48.7%) |
Disability Class by Sex by Age in Pine Canyon
Disability Class: Hearing Difficulty
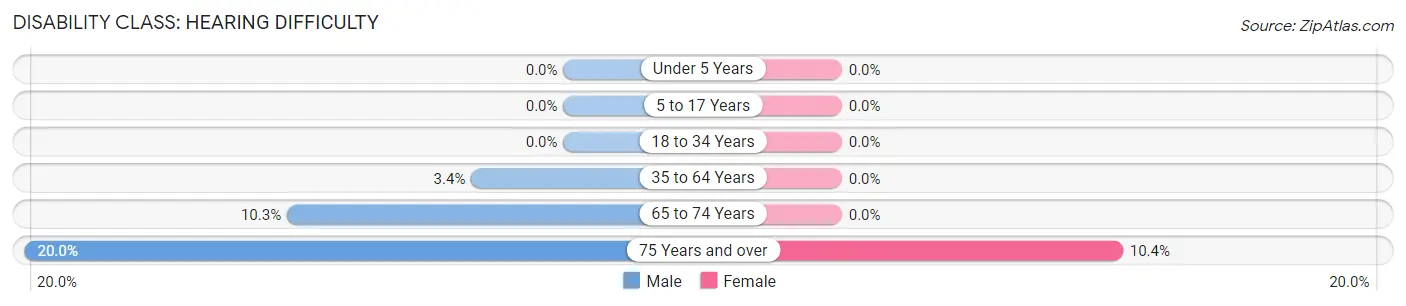
| Age Bracket | Male | Female |
| Under 5 Years | 0 (0.0%) | 0 (0.0%) |
| 5 to 17 Years | 0 (0.0%) | 0 (0.0%) |
| 18 to 34 Years | 0 (0.0%) | 0 (0.0%) |
| 35 to 64 Years | 19 (3.4%) | 0 (0.0%) |
| 65 to 74 Years | 8 (10.3%) | 0 (0.0%) |
| 75 Years and over | 19 (20.0%) | 12 (10.4%) |
Disability Class: Vision Difficulty
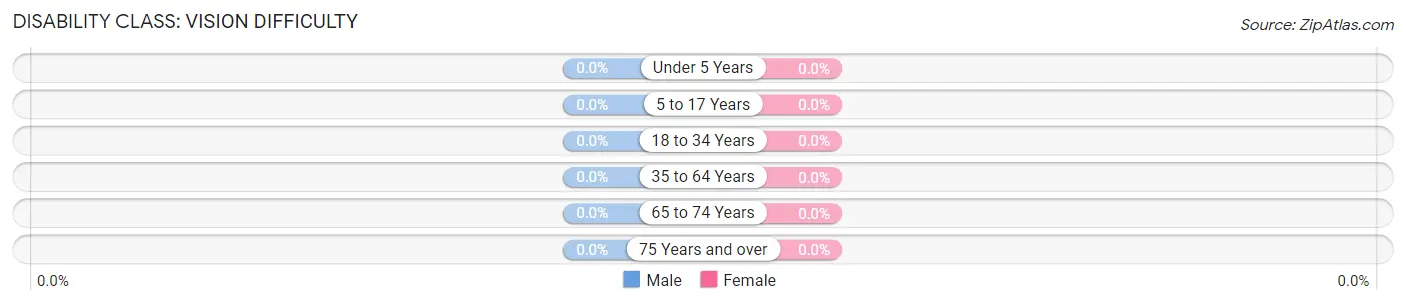
| Age Bracket | Male | Female |
| Under 5 Years | 0 (0.0%) | 0 (0.0%) |
| 5 to 17 Years | 0 (0.0%) | 0 (0.0%) |
| 18 to 34 Years | 0 (0.0%) | 0 (0.0%) |
| 35 to 64 Years | 0 (0.0%) | 0 (0.0%) |
| 65 to 74 Years | 0 (0.0%) | 0 (0.0%) |
| 75 Years and over | 0 (0.0%) | 0 (0.0%) |
Disability Class: Cognitive Difficulty
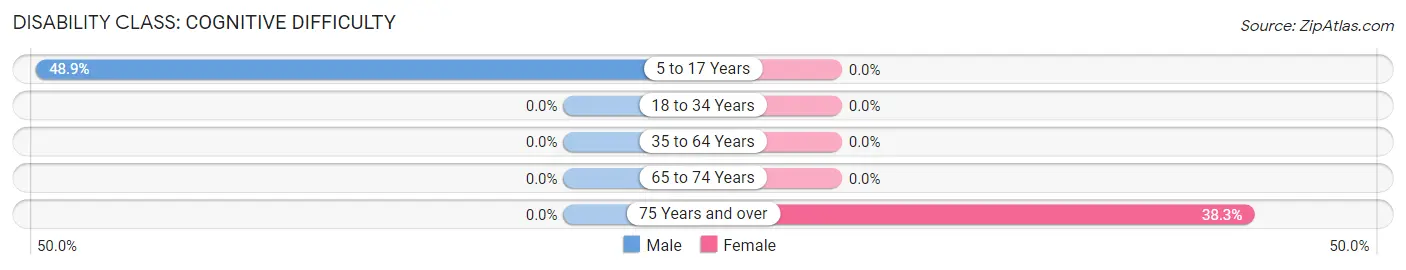
| Age Bracket | Male | Female |
| 5 to 17 Years | 182 (48.9%) | 0 (0.0%) |
| 18 to 34 Years | 0 (0.0%) | 0 (0.0%) |
| 35 to 64 Years | 0 (0.0%) | 0 (0.0%) |
| 65 to 74 Years | 0 (0.0%) | 0 (0.0%) |
| 75 Years and over | 0 (0.0%) | 44 (38.3%) |
Disability Class: Ambulatory Difficulty
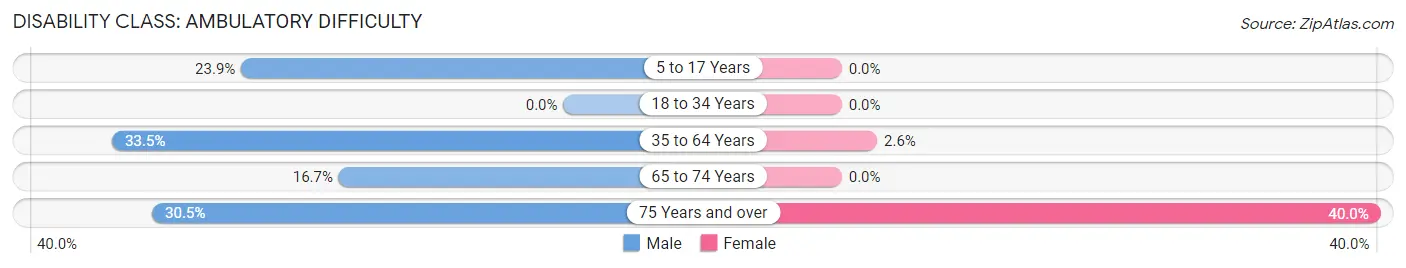
| Age Bracket | Male | Female |
| 5 to 17 Years | 89 (23.9%) | 0 (0.0%) |
| 18 to 34 Years | 0 (0.0%) | 0 (0.0%) |
| 35 to 64 Years | 186 (33.5%) | 12 (2.6%) |
| 65 to 74 Years | 13 (16.7%) | 0 (0.0%) |
| 75 Years and over | 29 (30.5%) | 46 (40.0%) |
Disability Class: Self-Care Difficulty
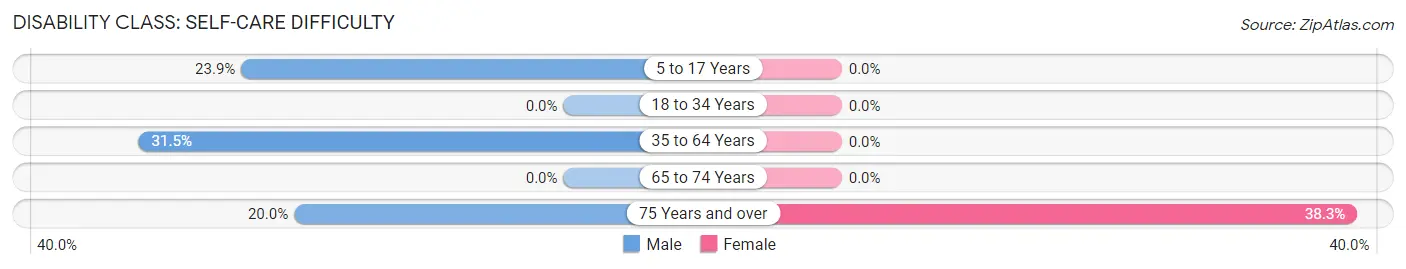
| Age Bracket | Male | Female |
| 5 to 17 Years | 89 (23.9%) | 0 (0.0%) |
| 18 to 34 Years | 0 (0.0%) | 0 (0.0%) |
| 35 to 64 Years | 175 (31.5%) | 0 (0.0%) |
| 65 to 74 Years | 0 (0.0%) | 0 (0.0%) |
| 75 Years and over | 19 (20.0%) | 44 (38.3%) |
Technology Access in Pine Canyon
Computing Device Access in Pine Canyon
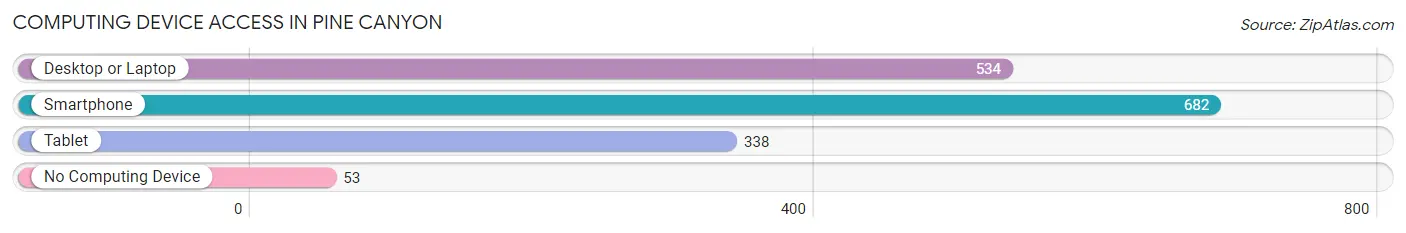
| Device Type | # Households | % Households |
| Desktop or Laptop | 534 | 71.2% |
| Smartphone | 682 | 90.9% |
| Tablet | 338 | 45.1% |
| No Computing Device | 53 | 7.1% |
| Total | 750 | 100.0% |
Internet Access in Pine Canyon
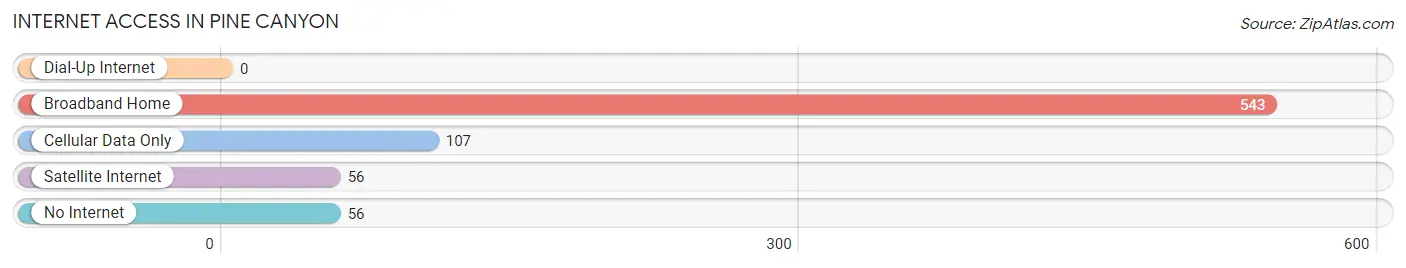
| Internet Type | # Households | % Households |
| Dial-Up Internet | 0 | 0.0% |
| Broadband Home | 543 | 72.4% |
| Cellular Data Only | 107 | 14.3% |
| Satellite Internet | 56 | 7.5% |
| No Internet | 56 | 7.5% |
| Total | 750 | 100.0% |
Pine Canyon Summary
Pine Canyon, California is a small unincorporated community located in the San Bernardino Mountains of Southern California. It is situated in the San Bernardino National Forest, approximately 25 miles northeast of San Bernardino. The community is located at an elevation of 5,000 feet and is surrounded by the San Bernardino National Forest.
History
Pine Canyon was first settled in the late 1800s by miners and loggers who were attracted to the area by the abundance of timber and minerals. The first post office was established in 1891 and the town was officially incorporated in 1895. The town was named after the nearby Pine Canyon, which was named for the abundance of pine trees in the area.
The town grew rapidly in the early 1900s, with the construction of a sawmill, a hotel, and a general store. The town also had a school, a church, and a post office. The town was a popular destination for tourists, who came to enjoy the scenic beauty of the area.
In the 1920s, the town began to decline as the timber industry declined and the population began to move away. The town was eventually abandoned in the 1940s.
Geography
Pine Canyon is located in the San Bernardino Mountains of Southern California. It is situated at an elevation of 5,000 feet and is surrounded by the San Bernardino National Forest. The town is located approximately 25 miles northeast of San Bernardino.
The area is characterized by steep terrain, with elevations ranging from 4,000 to 8,000 feet. The area is home to a variety of wildlife, including deer, bear, mountain lions, and a variety of birds.
Economy
The economy of Pine Canyon is largely based on tourism. The town is a popular destination for hikers, campers, and other outdoor enthusiasts. The area is also home to a variety of recreational activities, including fishing, hunting, and horseback riding.
The town is also home to a variety of businesses, including restaurants, lodging, and retail stores. The town is also home to a number of small businesses, including a sawmill, a general store, and a post office.
Demographics
As of the 2010 census, the population of Pine Canyon was 545. The population is predominantly white (90.2%), with a small percentage of African Americans (2.2%), Asians (1.8%), and Native Americans (0.9%). The median household income is $45,000, and the median age is 44.
Conclusion
Pine Canyon, California is a small unincorporated community located in the San Bernardino Mountains of Southern California. It is situated at an elevation of 5,000 feet and is surrounded by the San Bernardino National Forest. The town was first settled in the late 1800s and was a popular destination for tourists in the early 1900s. The economy of Pine Canyon is largely based on tourism, with a variety of businesses and recreational activities available. The population of Pine Canyon is predominantly white, with a median household income of $45,000 and a median age of 44.
Common Questions
What is Per Capita Income in Pine Canyon?
Per Capita income in Pine Canyon is $33,765.
What is the Median Family Income in Pine Canyon?
Median Family Income in Pine Canyon is $64,730.
What is the Median Household income in Pine Canyon?
Median Household Income in Pine Canyon is $115,210.
What is Income or Wage Gap in Pine Canyon?
Income or Wage Gap in Pine Canyon is 41.1%.
Women in Pine Canyon earn 58.9 cents for every dollar earned by a man.
What is Inequality or Gini Index in Pine Canyon?
Inequality or Gini Index in Pine Canyon is 0.26.
What is the Total Population of Pine Canyon?
Total Population of Pine Canyon is 2,092.
What is the Total Male Population of Pine Canyon?
Total Male Population of Pine Canyon is 1,297.
What is the Total Female Population of Pine Canyon?
Total Female Population of Pine Canyon is 795.
What is the Ratio of Males per 100 Females in Pine Canyon?
There are 163.14 Males per 100 Females in Pine Canyon.
What is the Ratio of Females per 100 Males in Pine Canyon?
There are 61.30 Females per 100 Males in Pine Canyon.
What is the Median Population Age in Pine Canyon?
Median Population Age in Pine Canyon is 47.3 Years.
What is the Average Family Size in Pine Canyon
Average Family Size in Pine Canyon is 3.1 People.
What is the Average Household Size in Pine Canyon
Average Household Size in Pine Canyon is 2.8 People.
How Large is the Labor Force in Pine Canyon?
There are 985 People in the Labor Forcein in Pine Canyon.
What is the Percentage of People in the Labor Force in Pine Canyon?
54.7% of People are in the Labor Force in Pine Canyon.
What is the Unemployment Rate in Pine Canyon?
Unemployment Rate in Pine Canyon is 2.6%.