Cities with the Lowest Percentage of Renter-Occupied Units in South Dakota
RELATED REPORTS & OPTIONS
Lowest Renter-Occupied
South Dakota
Compare Cities
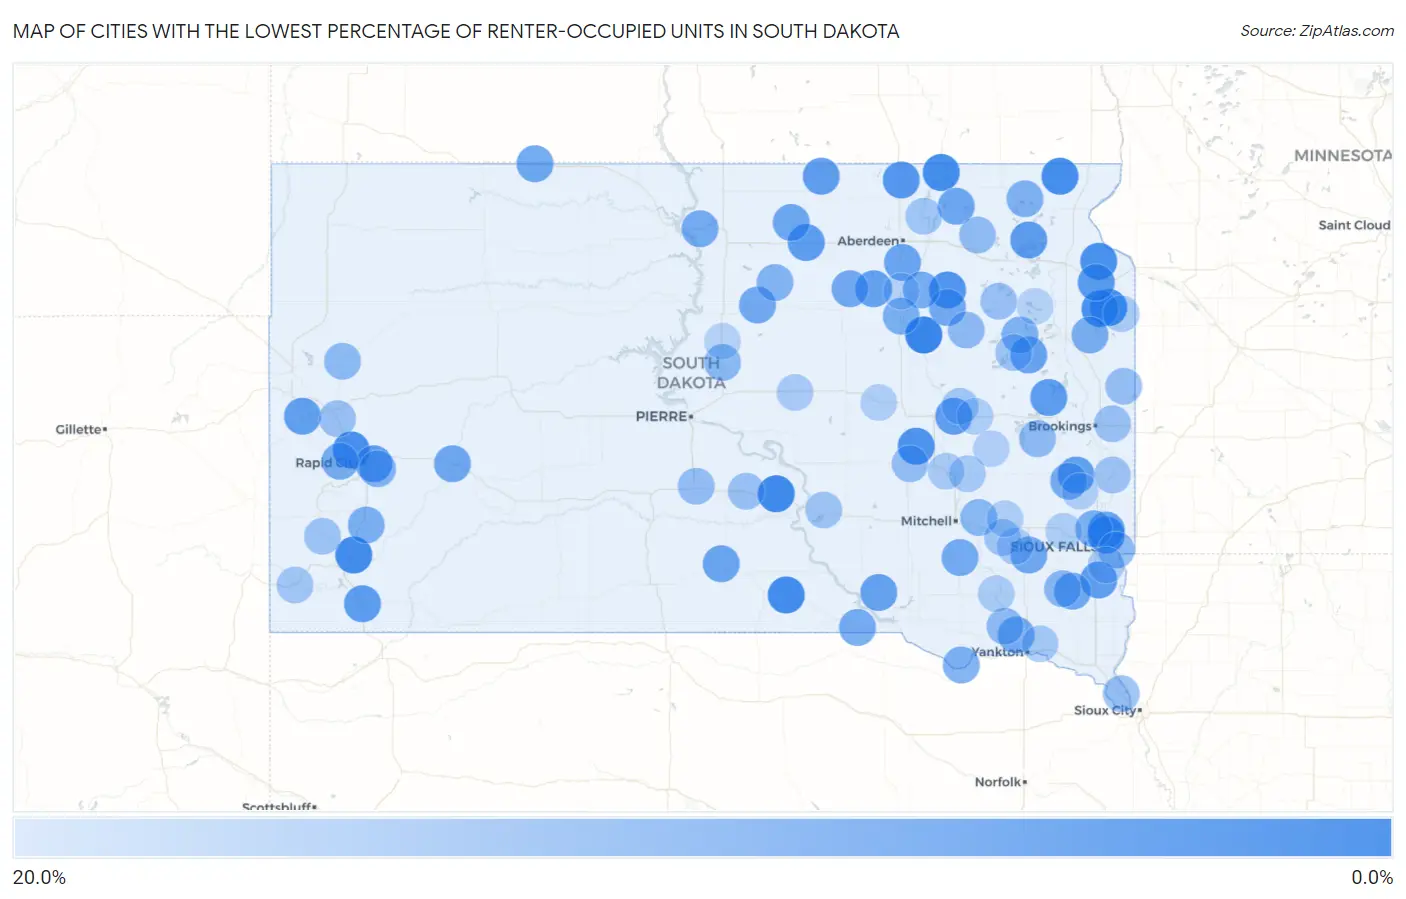
Map of Cities with the Lowest Percentage of Renter-Occupied Units in South Dakota
20.0%
0.0%
Cities with the Lowest Percentage of Renter-Occupied Units in South Dakota
| City | % Renter-Occupied | vs State | vs National | |
| 1. | Frankfort | 1.6% | 31.6%(-30.0)#1 | 35.2%(-33.6)#137 |
| 2. | Reliance | 2.5% | 31.6%(-29.1)#2 | 35.2%(-32.7)#354 |
| 3. | Buffalo Gap | 2.8% | 31.6%(-28.7)#3 | 35.2%(-32.4)#448 |
| 4. | Dallas | 2.9% | 31.6%(-28.7)#4 | 35.2%(-32.3)#462 |
| 5. | La Bolt | 2.9% | 31.6%(-28.7)#5 | 35.2%(-32.3)#463 |
| 6. | Hecla | 3.0% | 31.6%(-28.6)#6 | 35.2%(-32.2)#493 |
| 7. | Claire City | 3.0% | 31.6%(-28.5)#7 | 35.2%(-32.2)#521 |
| 8. | Blackhawk | 3.4% | 31.6%(-28.2)#8 | 35.2%(-31.8)#636 |
| 9. | Strandburg | 3.4% | 31.6%(-28.1)#9 | 35.2%(-31.7)#660 |
| 10. | Corona | 3.7% | 31.6%(-27.9)#10 | 35.2%(-31.5)#743 |
| 11. | Mina | 3.7% | 31.6%(-27.8)#11 | 35.2%(-31.5)#750 |
| 12. | Meadow View Addition | 3.9% | 31.6%(-27.7)#12 | 35.2%(-31.3)#812 |
| 13. | Alpena | 4.1% | 31.6%(-27.4)#13 | 35.2%(-31.1)#874 |
| 14. | Conde | 4.2% | 31.6%(-27.3)#14 | 35.2%(-31.0)#914 |
| 15. | Frederick | 5.0% | 31.6%(-26.6)#15 | 35.2%(-30.2)#1,206 |
| 16. | Twin Brooks | 5.6% | 31.6%(-26.0)#16 | 35.2%(-29.6)#1,475 |
| 17. | Roscoe | 5.7% | 31.6%(-25.9)#17 | 35.2%(-29.5)#1,519 |
| 18. | Oelrichs | 5.8% | 31.6%(-25.8)#18 | 35.2%(-29.4)#1,558 |
| 19. | Badger | 5.9% | 31.6%(-25.7)#19 | 35.2%(-29.3)#1,590 |
| 20. | Oahe Acres | 6.1% | 31.6%(-25.5)#20 | 35.2%(-29.1)#1,667 |
| 21. | Grenville | 6.1% | 31.6%(-25.5)#21 | 35.2%(-29.1)#1,675 |
| 22. | Cavour | 6.2% | 31.6%(-25.4)#22 | 35.2%(-29.0)#1,701 |
| 23. | Long Lake | 6.2% | 31.6%(-25.3)#23 | 35.2%(-28.9)#1,753 |
| 24. | Rapid Valley | 6.3% | 31.6%(-25.2)#24 | 35.2%(-28.9)#1,772 |
| 25. | Worthing | 6.4% | 31.6%(-25.2)#25 | 35.2%(-28.8)#1,786 |
| 26. | Wentworth | 6.5% | 31.6%(-25.1)#26 | 35.2%(-28.7)#1,845 |
| 27. | Central City | 6.6% | 31.6%(-25.0)#27 | 35.2%(-28.6)#1,878 |
| 28. | Chelsea | 6.7% | 31.6%(-24.9)#28 | 35.2%(-28.5)#1,922 |
| 29. | Geddes | 6.9% | 31.6%(-24.6)#29 | 35.2%(-28.2)#2,033 |
| 30. | Renner Corner | 7.2% | 31.6%(-24.4)#30 | 35.2%(-28.0)#2,164 |
| 31. | Hazel | 7.3% | 31.6%(-24.2)#31 | 35.2%(-27.9)#2,215 |
| 32. | Warner | 7.4% | 31.6%(-24.2)#32 | 35.2%(-27.8)#2,253 |
| 33. | New Witten | 7.5% | 31.6%(-24.0)#33 | 35.2%(-27.6)#2,324 |
| 34. | Hosmer | 7.7% | 31.6%(-23.9)#34 | 35.2%(-27.5)#2,384 |
| 35. | Claremont | 7.7% | 31.6%(-23.9)#35 | 35.2%(-27.5)#2,406 |
| 36. | Morristown | 7.7% | 31.6%(-23.9)#36 | 35.2%(-27.5)#2,409 |
| 37. | Davis | 7.8% | 31.6%(-23.7)#37 | 35.2%(-27.3)#2,473 |
| 38. | Wasta | 8.1% | 31.6%(-23.5)#38 | 35.2%(-27.1)#2,599 |
| 39. | Cresbard | 8.2% | 31.6%(-23.4)#39 | 35.2%(-27.0)#2,620 |
| 40. | Lebanon | 8.3% | 31.6%(-23.2)#40 | 35.2%(-26.9)#2,706 |
| 41. | Turton | 8.3% | 31.6%(-23.2)#41 | 35.2%(-26.9)#2,711 |
| 42. | Dolton | 8.3% | 31.6%(-23.2)#42 | 35.2%(-26.9)#2,713 |
| 43. | Dimock | 8.6% | 31.6%(-23.0)#43 | 35.2%(-26.6)#2,811 |
| 44. | Glenham | 8.6% | 31.6%(-22.9)#44 | 35.2%(-26.6)#2,833 |
| 45. | Fairfax | 8.8% | 31.6%(-22.7)#45 | 35.2%(-26.4)#2,949 |
| 46. | Brentford | 8.9% | 31.6%(-22.7)#46 | 35.2%(-26.3)#2,983 |
| 47. | Lake Madison | 9.0% | 31.6%(-22.5)#47 | 35.2%(-26.2)#3,068 |
| 48. | Johnson Siding | 9.1% | 31.6%(-22.5)#48 | 35.2%(-26.1)#3,083 |
| 49. | Utica | 9.1% | 31.6%(-22.5)#49 | 35.2%(-26.1)#3,125 |
| 50. | Goodwin | 9.2% | 31.6%(-22.3)#50 | 35.2%(-26.0)#3,184 |
| 51. | Running Water | 9.4% | 31.6%(-22.1)#51 | 35.2%(-25.7)#3,285 |
| 52. | Ashton | 9.5% | 31.6%(-22.0)#52 | 35.2%(-25.7)#3,335 |
| 53. | Fairburn | 9.5% | 31.6%(-22.0)#53 | 35.2%(-25.7)#3,347 |
| 54. | Crooks | 9.5% | 31.6%(-22.0)#54 | 35.2%(-25.6)#3,354 |
| 55. | Henry | 9.9% | 31.6%(-21.6)#55 | 35.2%(-25.3)#3,538 |
| 56. | Lake City | 10.0% | 31.6%(-21.6)#56 | 35.2%(-25.2)#3,596 |
| 57. | Green Valley | 10.2% | 31.6%(-21.3)#57 | 35.2%(-25.0)#3,706 |
| 58. | Tolstoy | 10.5% | 31.6%(-21.0)#58 | 35.2%(-24.7)#3,864 |
| 59. | Hurley | 11.0% | 31.6%(-20.6)#59 | 35.2%(-24.2)#4,100 |
| 60. | Fulton | 11.1% | 31.6%(-20.5)#60 | 35.2%(-24.1)#4,190 |
| 61. | Onida | 11.2% | 31.6%(-20.4)#61 | 35.2%(-24.0)#4,217 |
| 62. | Newell | 11.5% | 31.6%(-20.1)#62 | 35.2%(-23.7)#4,382 |
| 63. | Oldham | 11.6% | 31.6%(-20.0)#63 | 35.2%(-23.6)#4,440 |
| 64. | Lesterville | 11.7% | 31.6%(-19.9)#64 | 35.2%(-23.5)#4,489 |
| 65. | Anderson | 11.7% | 31.6%(-19.9)#65 | 35.2%(-23.5)#4,498 |
| 66. | Raymond | 11.8% | 31.6%(-19.8)#66 | 35.2%(-23.4)#4,554 |
| 67. | Pierpont | 12.3% | 31.6%(-19.3)#67 | 35.2%(-22.9)#4,839 |
| 68. | Vivian | 12.5% | 31.6%(-19.1)#68 | 35.2%(-22.7)#4,992 |
| 69. | Lane | 12.5% | 31.6%(-19.1)#69 | 35.2%(-22.7)#4,999 |
| 70. | Jefferson | 12.8% | 31.6%(-18.8)#70 | 35.2%(-22.4)#5,163 |
| 71. | Astoria | 12.8% | 31.6%(-18.7)#71 | 35.2%(-22.4)#5,170 |
| 72. | Blucksberg Mountain | 12.9% | 31.6%(-18.7)#72 | 35.2%(-22.3)#5,199 |
| 73. | Kennebec | 13.0% | 31.6%(-18.6)#73 | 35.2%(-22.2)#5,276 |
| 74. | Bradley | 13.0% | 31.6%(-18.5)#74 | 35.2%(-22.1)#5,329 |
| 75. | Bushnell | 13.0% | 31.6%(-18.5)#75 | 35.2%(-22.1)#5,335 |
| 76. | Pringle | 13.3% | 31.6%(-18.2)#76 | 35.2%(-21.9)#5,490 |
| 77. | Naples | 13.3% | 31.6%(-18.2)#77 | 35.2%(-21.9)#5,499 |
| 78. | Emery | 13.8% | 31.6%(-17.8)#78 | 35.2%(-21.4)#5,752 |
| 79. | Pukwana | 13.8% | 31.6%(-17.8)#79 | 35.2%(-21.4)#5,777 |
| 80. | Egan | 13.8% | 31.6%(-17.8)#80 | 35.2%(-21.4)#5,779 |
| 81. | Yale | 13.9% | 31.6%(-17.7)#81 | 35.2%(-21.3)#5,862 |
| 82. | Columbia | 13.9% | 31.6%(-17.6)#82 | 35.2%(-21.3)#5,871 |
| 83. | Edgemont | 14.0% | 31.6%(-17.6)#83 | 35.2%(-21.2)#5,926 |
| 84. | Mission Hill | 14.5% | 31.6%(-17.1)#84 | 35.2%(-20.7)#6,220 |
| 85. | Artesian | 14.7% | 31.6%(-16.9)#85 | 35.2%(-20.5)#6,365 |
| 86. | Highmore | 14.8% | 31.6%(-16.7)#86 | 35.2%(-20.4)#6,444 |
| 87. | Harrisburg | 14.9% | 31.6%(-16.7)#87 | 35.2%(-20.3)#6,478 |
| 88. | Bridgewater | 15.0% | 31.6%(-16.6)#88 | 35.2%(-20.2)#6,545 |
| 89. | Forestburg | 15.0% | 31.6%(-16.6)#89 | 35.2%(-20.2)#6,563 |
| 90. | Revillo | 15.1% | 31.6%(-16.5)#90 | 35.2%(-20.1)#6,593 |
| 91. | Olivet | 15.2% | 31.6%(-16.4)#91 | 35.2%(-20.0)#6,650 |
| 92. | Humboldt | 15.3% | 31.6%(-16.3)#92 | 35.2%(-19.9)#6,728 |
| 93. | Spencer | 15.4% | 31.6%(-16.2)#93 | 35.2%(-19.8)#6,784 |
| 94. | Iroquois | 15.5% | 31.6%(-16.1)#94 | 35.2%(-19.7)#6,840 |
| 95. | Wessington | 15.6% | 31.6%(-16.0)#95 | 35.2%(-19.6)#6,869 |
| 96. | Chester | 15.8% | 31.6%(-15.8)#96 | 35.2%(-19.4)#7,015 |
| 97. | Carthage | 15.9% | 31.6%(-15.6)#97 | 35.2%(-19.2)#7,096 |
| 98. | Florence | 16.1% | 31.6%(-15.5)#98 | 35.2%(-19.1)#7,213 |
| 99. | Agar | 16.4% | 31.6%(-15.2)#99 | 35.2%(-18.8)#7,400 |
| 100. | Mellette | 16.4% | 31.6%(-15.1)#100 | 35.2%(-18.8)#7,408 |
Common Questions
What are the Top 10 Cities with the Lowest Percentage of Renter-Occupied Units in South Dakota?
Top 10 Cities with the Lowest Percentage of Renter-Occupied Units in South Dakota are:
#1
1.6%
#2
2.5%
#3
2.8%
#4
2.9%
#5
2.9%
#6
3.0%
#7
3.0%
#8
3.4%
#9
3.4%
#10
3.7%
What city has the Lowest Percentage of Renter-Occupied Units in South Dakota?
Frankfort has the Lowest Percentage of Renter-Occupied Units in South Dakota with 1.6%.
What is the Percentage of Renter-Occupied Units in the State of South Dakota?
Percentage of Renter-Occupied Units in South Dakota is 31.6%.
What is the Percentage of Renter-Occupied Units in the United States?
Percentage of Renter-Occupied Units in the United States is 35.2%.