Zip Codes with the Lowest Percentage of Renter-Occupied Units in San Diego, CA
RELATED REPORTS & OPTIONS
Lowest Renter-Occupied
San Diego
Compare Zip Codes
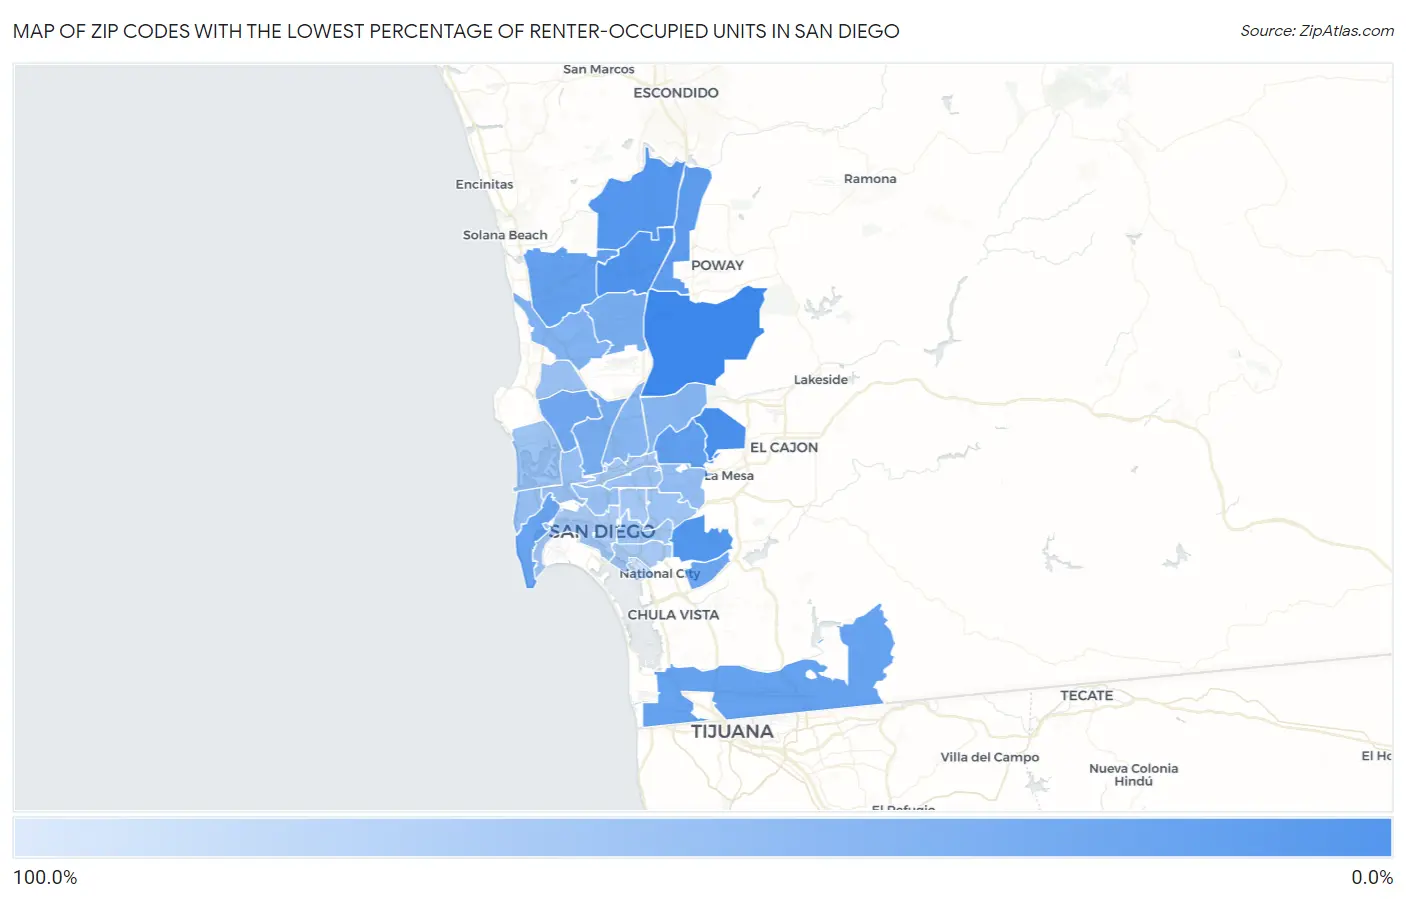
Map of Zip Codes with the Lowest Percentage of Renter-Occupied Units in San Diego
100.0%
19.9%
Zip Codes with the Lowest Percentage of Renter-Occupied Units in San Diego, CA
| Zip Code | % Renter-Occupied | vs State | vs National | |
| 1. | 92131 | 19.9% | 44.4%(-24.5)#252 | 35.2%(-15.3)#12,774 |
| 2. | 92119 | 25.8% | 44.4%(-18.5)#425 | 35.2%(-9.34)#18,158 |
| 3. | 92129 | 28.0% | 44.4%(-16.4)#493 | 35.2%(-7.21)#19,680 |
| 4. | 92114 | 29.4% | 44.4%(-15.0)#541 | 35.2%(-5.78)#20,654 |
| 5. | 92127 | 30.5% | 44.4%(-13.9)#579 | 35.2%(-4.69)#21,369 |
| 6. | 92128 | 34.6% | 44.4%(-9.82)#738 | 35.2%(-0.633)#23,515 |
| 7. | 92120 | 36.2% | 44.4%(-8.19)#802 | 35.2%(+0.997)#24,256 |
| 8. | 92130 | 37.0% | 44.4%(-7.41)#825 | 35.2%(+1.77)#24,601 |
| 9. | 92154 | 37.9% | 44.4%(-6.46)#857 | 35.2%(+2.73)#24,978 |
| 10. | 92106 | 39.2% | 44.4%(-5.16)#904 | 35.2%(+4.02)#25,449 |
| 11. | 92139 | 40.9% | 44.4%(-3.48)#962 | 35.2%(+5.71)#25,954 |
| 12. | 92117 | 44.2% | 44.4%(-0.218)#1,059 | 35.2%(+8.97)#26,829 |
| 13. | 92111 | 47.1% | 44.4%(+2.74)#1,141 | 35.2%(+11.9)#27,473 |
| 14. | 92126 | 47.3% | 44.4%(+2.92)#1,150 | 35.2%(+12.1)#27,515 |
| 15. | 92121 | 51.6% | 44.4%(+7.20)#1,243 | 35.2%(+16.4)#28,269 |
| 16. | 92123 | 55.0% | 44.4%(+10.7)#1,316 | 35.2%(+19.9)#28,775 |
| 17. | 92124 | 55.8% | 44.4%(+11.4)#1,334 | 35.2%(+20.6)#28,866 |
| 18. | 92115 | 61.9% | 44.4%(+17.5)#1,423 | 35.2%(+26.7)#29,461 |
| 19. | 92110 | 63.7% | 44.4%(+19.3)#1,451 | 35.2%(+28.5)#29,612 |
| 20. | 92103 | 63.9% | 44.4%(+19.5)#1,456 | 35.2%(+28.7)#29,629 |
| 21. | 92107 | 64.2% | 44.4%(+19.8)#1,463 | 35.2%(+29.0)#29,666 |
| 22. | 92122 | 66.2% | 44.4%(+21.8)#1,488 | 35.2%(+31.0)#29,810 |
| 23. | 92116 | 66.3% | 44.4%(+21.9)#1,491 | 35.2%(+31.1)#29,815 |
| 24. | 92105 | 67.8% | 44.4%(+23.4)#1,506 | 35.2%(+32.6)#29,910 |
| 25. | 92102 | 68.1% | 44.4%(+23.7)#1,510 | 35.2%(+32.9)#29,927 |
| 26. | 92109 | 68.1% | 44.4%(+23.7)#1,513 | 35.2%(+32.9)#29,930 |
| 27. | 92108 | 70.2% | 44.4%(+25.8)#1,532 | 35.2%(+35.0)#30,053 |
| 28. | 92104 | 71.7% | 44.4%(+27.3)#1,545 | 35.2%(+36.5)#30,126 |
| 29. | 92113 | 72.5% | 44.4%(+28.2)#1,548 | 35.2%(+37.4)#30,167 |
| 30. | 92101 | 74.9% | 44.4%(+30.5)#1,564 | 35.2%(+39.7)#30,261 |
| 31. | 92136 | 100.0% | 44.4%(+55.6)#1,652 | 35.2%(+64.8)#30,812 |
1
Common Questions
What are the Top 10 Zip Codes with the Lowest Percentage of Renter-Occupied Units in San Diego, CA?
Top 10 Zip Codes with the Lowest Percentage of Renter-Occupied Units in San Diego, CA are:
What zip code has the Lowest Percentage of Renter-Occupied Units in San Diego, CA?
92131 has the Lowest Percentage of Renter-Occupied Units in San Diego, CA with 19.9%.
What is the Percentage of Renter-Occupied Units in San Diego, CA?
Percentage of Renter-Occupied Units in San Diego is 52.4%.
What is the Percentage of Renter-Occupied Units in California?
Percentage of Renter-Occupied Units in California is 44.4%.
What is the Percentage of Renter-Occupied Units in the United States?
Percentage of Renter-Occupied Units in the United States is 35.2%.