Cities with the Lowest Percentage of Renter-Occupied Units in New York
RELATED REPORTS & OPTIONS
Lowest Renter-Occupied
New York
Compare Cities
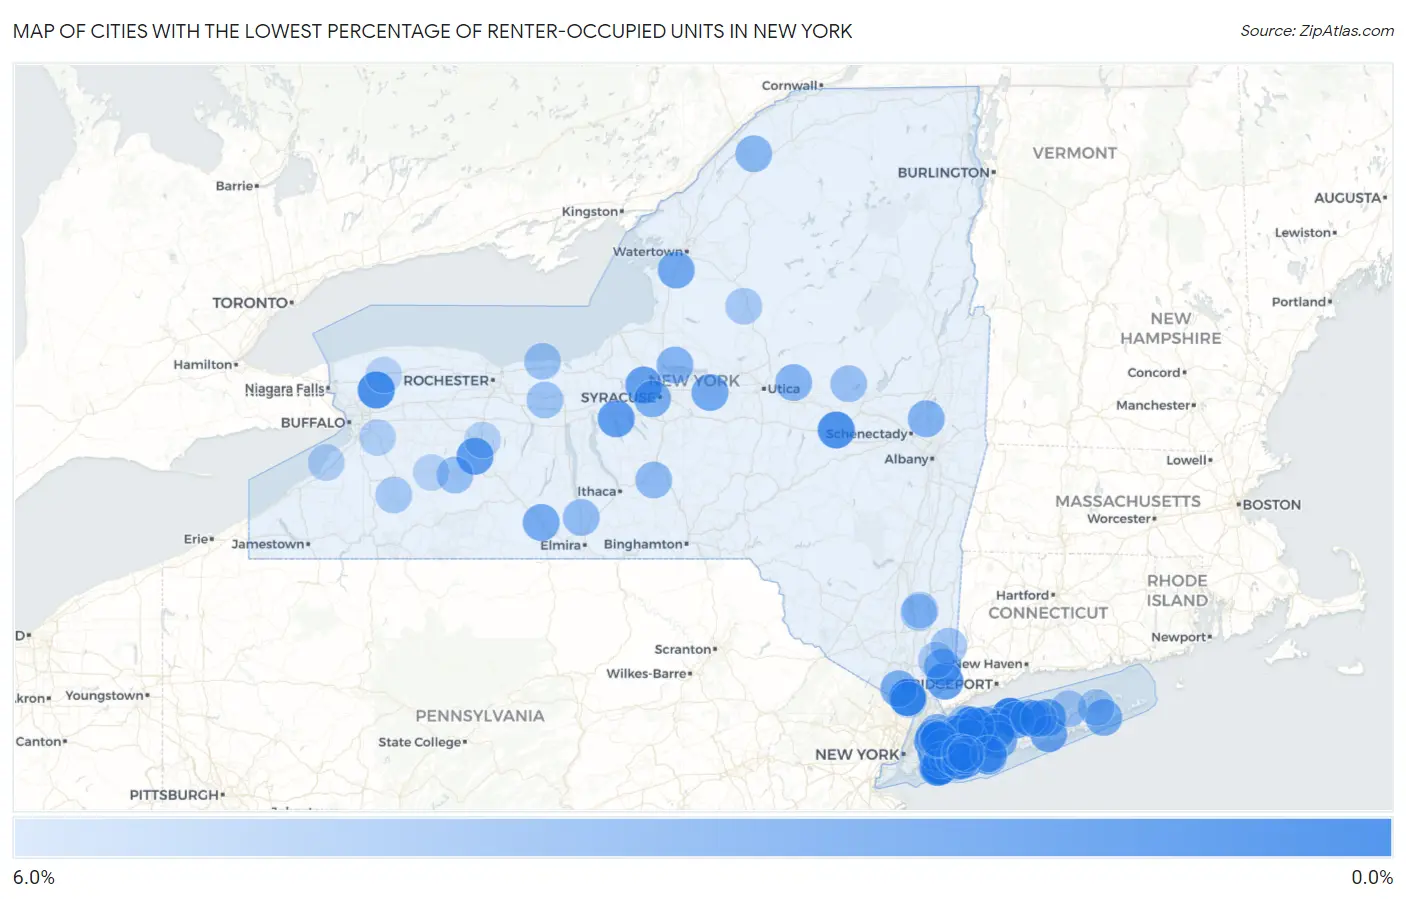
Map of Cities with the Lowest Percentage of Renter-Occupied Units in New York
6.0%
0.0%
Cities with the Lowest Percentage of Renter-Occupied Units in New York
| City | % Renter-Occupied | vs State | vs National | |
| 1. | Belle Terre | 0.67% | 45.7%(-45.0)#1 | 35.2%(-34.5)#24 |
| 2. | Roslyn Estates | 0.69% | 45.7%(-45.0)#2 | 35.2%(-34.5)#29 |
| 3. | West Nyack | 0.89% | 45.7%(-44.8)#3 | 35.2%(-34.3)#48 |
| 4. | Roslyn Harbor | 0.97% | 45.7%(-44.7)#4 | 35.2%(-34.2)#54 |
| 5. | East Williston | 1.1% | 45.7%(-44.7)#5 | 35.2%(-34.1)#65 |
| 6. | Huntington Bay | 1.1% | 45.7%(-44.6)#6 | 35.2%(-34.1)#75 |
| 7. | Willsboro Point | 1.4% | 45.7%(-44.4)#7 | 35.2%(-33.8)#99 |
| 8. | Rapids | 1.5% | 45.7%(-44.2)#8 | 35.2%(-33.6)#132 |
| 9. | Ames | 1.6% | 45.7%(-44.1)#9 | 35.2%(-33.6)#140 |
| 10. | Saddle Rock | 1.8% | 45.7%(-43.9)#10 | 35.2%(-33.3)#181 |
| 11. | Massapequa Park | 1.9% | 45.7%(-43.8)#11 | 35.2%(-33.3)#189 |
| 12. | Hewlett Bay Park | 1.9% | 45.7%(-43.8)#12 | 35.2%(-33.3)#205 |
| 13. | Woodsburgh | 1.9% | 45.7%(-43.8)#13 | 35.2%(-33.2)#208 |
| 14. | Cold Spring Harbor | 2.0% | 45.7%(-43.8)#14 | 35.2%(-33.2)#213 |
| 15. | Hewlett Harbor | 2.0% | 45.7%(-43.7)#15 | 35.2%(-33.1)#228 |
| 16. | Munsey Park | 2.1% | 45.7%(-43.6)#16 | 35.2%(-33.1)#233 |
| 17. | Bellerose | 2.2% | 45.7%(-43.5)#17 | 35.2%(-33.0)#258 |
| 18. | Melrose Park | 2.3% | 45.7%(-43.4)#18 | 35.2%(-32.9)#283 |
| 19. | Crest View Heights | 2.3% | 45.7%(-43.4)#19 | 35.2%(-32.9)#284 |
| 20. | Groveland Station | 2.3% | 45.7%(-43.4)#20 | 35.2%(-32.9)#288 |
| 21. | Kensington | 2.4% | 45.7%(-43.3)#21 | 35.2%(-32.8)#317 |
| 22. | East Shoreham | 2.4% | 45.7%(-43.3)#22 | 35.2%(-32.7)#328 |
| 23. | Bedford | 2.5% | 45.7%(-43.3)#23 | 35.2%(-32.7)#338 |
| 24. | Seneca Knolls | 2.6% | 45.7%(-43.2)#24 | 35.2%(-32.6)#380 |
| 25. | Baiting Hollow | 2.6% | 45.7%(-43.2)#25 | 35.2%(-32.6)#381 |
| 26. | Elwood | 2.8% | 45.7%(-43.0)#26 | 35.2%(-32.4)#429 |
| 27. | Searingtown | 2.8% | 45.7%(-42.9)#27 | 35.2%(-32.4)#444 |
| 28. | Plandome | 2.8% | 45.7%(-42.9)#28 | 35.2%(-32.4)#449 |
| 29. | Eastport | 2.9% | 45.7%(-42.8)#29 | 35.2%(-32.3)#466 |
| 30. | Tioga Terrace | 3.0% | 45.7%(-42.7)#30 | 35.2%(-32.2)#506 |
| 31. | Head Of The Harbor | 3.1% | 45.7%(-42.7)#31 | 35.2%(-32.1)#528 |
| 32. | Fort Salonga | 3.1% | 45.7%(-42.6)#32 | 35.2%(-32.1)#533 |
| 33. | Adams Center | 3.1% | 45.7%(-42.6)#33 | 35.2%(-32.1)#535 |
| 34. | Mount Sinai | 3.1% | 45.7%(-42.6)#34 | 35.2%(-32.0)#552 |
| 35. | East Norwich | 3.2% | 45.7%(-42.6)#35 | 35.2%(-32.0)#558 |
| 36. | Wampsville | 3.2% | 45.7%(-42.6)#36 | 35.2%(-32.0)#560 |
| 37. | West Islip | 3.2% | 45.7%(-42.5)#37 | 35.2%(-32.0)#575 |
| 38. | Conesus | 3.2% | 45.7%(-42.5)#38 | 35.2%(-32.0)#584 |
| 39. | Islandia | 3.2% | 45.7%(-42.5)#39 | 35.2%(-31.9)#590 |
| 40. | Campbell | 3.2% | 45.7%(-42.5)#40 | 35.2%(-31.9)#592 |
| 41. | North New Hyde Park | 3.3% | 45.7%(-42.4)#41 | 35.2%(-31.9)#611 |
| 42. | Wainscott | 3.4% | 45.7%(-42.3)#42 | 35.2%(-31.8)#637 |
| 43. | South Hempstead | 3.4% | 45.7%(-42.3)#43 | 35.2%(-31.8)#651 |
| 44. | Westvale | 3.4% | 45.7%(-42.3)#44 | 35.2%(-31.8)#652 |
| 45. | New Hempstead | 3.5% | 45.7%(-42.2)#45 | 35.2%(-31.7)#681 |
| 46. | Dix Hills | 3.5% | 45.7%(-42.2)#46 | 35.2%(-31.7)#682 |
| 47. | Sands Point | 3.5% | 45.7%(-42.2)#47 | 35.2%(-31.6)#687 |
| 48. | West Bay Shore | 3.7% | 45.7%(-42.0)#48 | 35.2%(-31.5)#730 |
| 49. | Golden S Bridge | 3.7% | 45.7%(-42.0)#49 | 35.2%(-31.4)#759 |
| 50. | Massapequa | 3.7% | 45.7%(-42.0)#50 | 35.2%(-31.4)#760 |
| 51. | Country Knolls | 3.8% | 45.7%(-41.9)#51 | 35.2%(-31.4)#785 |
| 52. | Constantia | 3.9% | 45.7%(-41.8)#52 | 35.2%(-31.3)#813 |
| 53. | Middleville | 3.9% | 45.7%(-41.8)#53 | 35.2%(-31.2)#826 |
| 54. | Rensselaer Falls | 4.0% | 45.7%(-41.7)#54 | 35.2%(-31.2)#852 |
| 55. | Sleepy Hollow Lake | 4.1% | 45.7%(-41.7)#55 | 35.2%(-31.1)#857 |
| 56. | Virgil | 4.3% | 45.7%(-41.4)#56 | 35.2%(-30.9)#933 |
| 57. | Kings Point | 4.3% | 45.7%(-41.4)#57 | 35.2%(-30.9)#934 |
| 58. | Millport | 4.4% | 45.7%(-41.3)#58 | 35.2%(-30.8)#969 |
| 59. | Laurel Hollow | 4.4% | 45.7%(-41.3)#59 | 35.2%(-30.8)#970 |
| 60. | Village Of The Branch | 4.4% | 45.7%(-41.3)#60 | 35.2%(-30.8)#971 |
| 61. | Merrick | 4.4% | 45.7%(-41.3)#61 | 35.2%(-30.7)#980 |
| 62. | Caroga Lake | 4.6% | 45.7%(-41.1)#62 | 35.2%(-30.6)#1,053 |
| 63. | Muttontown | 4.6% | 45.7%(-41.1)#63 | 35.2%(-30.6)#1,056 |
| 64. | Dalton | 4.6% | 45.7%(-41.1)#64 | 35.2%(-30.6)#1,063 |
| 65. | West Hills | 4.7% | 45.7%(-41.0)#65 | 35.2%(-30.5)#1,098 |
| 66. | North Wantagh | 4.7% | 45.7%(-41.0)#66 | 35.2%(-30.5)#1,106 |
| 67. | Pultneyville | 4.7% | 45.7%(-41.0)#67 | 35.2%(-30.5)#1,111 |
| 68. | Herricks | 4.7% | 45.7%(-41.0)#68 | 35.2%(-30.4)#1,114 |
| 69. | Seaford | 4.7% | 45.7%(-41.0)#69 | 35.2%(-30.4)#1,115 |
| 70. | Port Gibson | 4.8% | 45.7%(-40.9)#70 | 35.2%(-30.4)#1,135 |
| 71. | Lloyd Harbor | 4.8% | 45.7%(-40.9)#71 | 35.2%(-30.4)#1,138 |
| 72. | Brewster Hill | 4.9% | 45.7%(-40.9)#72 | 35.2%(-30.3)#1,165 |
| 73. | Centerport | 4.9% | 45.7%(-40.8)#73 | 35.2%(-30.3)#1,171 |
| 74. | North Haven | 4.9% | 45.7%(-40.8)#74 | 35.2%(-30.2)#1,200 |
| 75. | Malverne | 5.0% | 45.7%(-40.8)#75 | 35.2%(-30.2)#1,207 |
| 76. | Hewlett Neck | 5.0% | 45.7%(-40.7)#76 | 35.2%(-30.2)#1,235 |
| 77. | Mattituck | 5.0% | 45.7%(-40.7)#77 | 35.2%(-30.1)#1,243 |
| 78. | Cadyville | 5.1% | 45.7%(-40.6)#78 | 35.2%(-30.1)#1,251 |
| 79. | Red Oaks Mill | 5.1% | 45.7%(-40.6)#79 | 35.2%(-30.1)#1,252 |
| 80. | Shoreham | 5.1% | 45.7%(-40.6)#80 | 35.2%(-30.1)#1,253 |
| 81. | North Merrick | 5.1% | 45.7%(-40.6)#81 | 35.2%(-30.1)#1,258 |
| 82. | Plandome Heights | 5.2% | 45.7%(-40.5)#82 | 35.2%(-30.0)#1,292 |
| 83. | Wantagh | 5.2% | 45.7%(-40.5)#83 | 35.2%(-30.0)#1,294 |
| 84. | Machias | 5.2% | 45.7%(-40.5)#84 | 35.2%(-30.0)#1,300 |
| 85. | Wading River | 5.2% | 45.7%(-40.5)#85 | 35.2%(-30.0)#1,309 |
| 86. | Plandome Manor | 5.2% | 45.7%(-40.5)#86 | 35.2%(-29.9)#1,313 |
| 87. | Turin | 5.3% | 45.7%(-40.5)#87 | 35.2%(-29.9)#1,322 |
| 88. | North Massapequa | 5.3% | 45.7%(-40.4)#88 | 35.2%(-29.9)#1,347 |
| 89. | Lincolndale | 5.3% | 45.7%(-40.4)#89 | 35.2%(-29.9)#1,352 |
| 90. | Clifton Knolls-Mill Creek | 5.4% | 45.7%(-40.3)#90 | 35.2%(-29.7)#1,403 |
| 91. | Titusville | 5.5% | 45.7%(-40.2)#91 | 35.2%(-29.7)#1,418 |
| 92. | Lake Erie Beach | 5.5% | 45.7%(-40.2)#92 | 35.2%(-29.7)#1,420 |
| 93. | Brightwaters | 5.5% | 45.7%(-40.2)#93 | 35.2%(-29.7)#1,426 |
| 94. | Levittown | 5.5% | 45.7%(-40.2)#94 | 35.2%(-29.6)#1,449 |
| 95. | Billington Heights | 5.6% | 45.7%(-40.1)#95 | 35.2%(-29.6)#1,488 |
| 96. | South Farmingdale | 5.6% | 45.7%(-40.1)#96 | 35.2%(-29.6)#1,491 |
| 97. | Conesus Lake | 5.7% | 45.7%(-40.0)#97 | 35.2%(-29.5)#1,523 |
| 98. | Blauvelt | 5.8% | 45.7%(-39.9)#98 | 35.2%(-29.4)#1,553 |
| 99. | Gasport | 5.8% | 45.7%(-39.9)#99 | 35.2%(-29.4)#1,566 |
| 100. | Pike | 5.8% | 45.7%(-39.9)#100 | 35.2%(-29.4)#1,568 |
Common Questions
What are the Top 10 Cities with the Lowest Percentage of Renter-Occupied Units in New York?
Top 10 Cities with the Lowest Percentage of Renter-Occupied Units in New York are:
#1
0.67%
#2
0.69%
#3
0.89%
#4
0.97%
#5
1.1%
#6
1.1%
#7
1.5%
#8
1.6%
#9
1.8%
#10
1.9%
What city has the Lowest Percentage of Renter-Occupied Units in New York?
Belle Terre has the Lowest Percentage of Renter-Occupied Units in New York with 0.67%.
What is the Percentage of Renter-Occupied Units in the State of New York?
Percentage of Renter-Occupied Units in New York is 45.7%.
What is the Percentage of Renter-Occupied Units in the United States?
Percentage of Renter-Occupied Units in the United States is 35.2%.