Cities with the Lowest Percentage of Renter-Occupied Units in Montana
RELATED REPORTS & OPTIONS
Lowest Renter-Occupied
Montana
Compare Cities
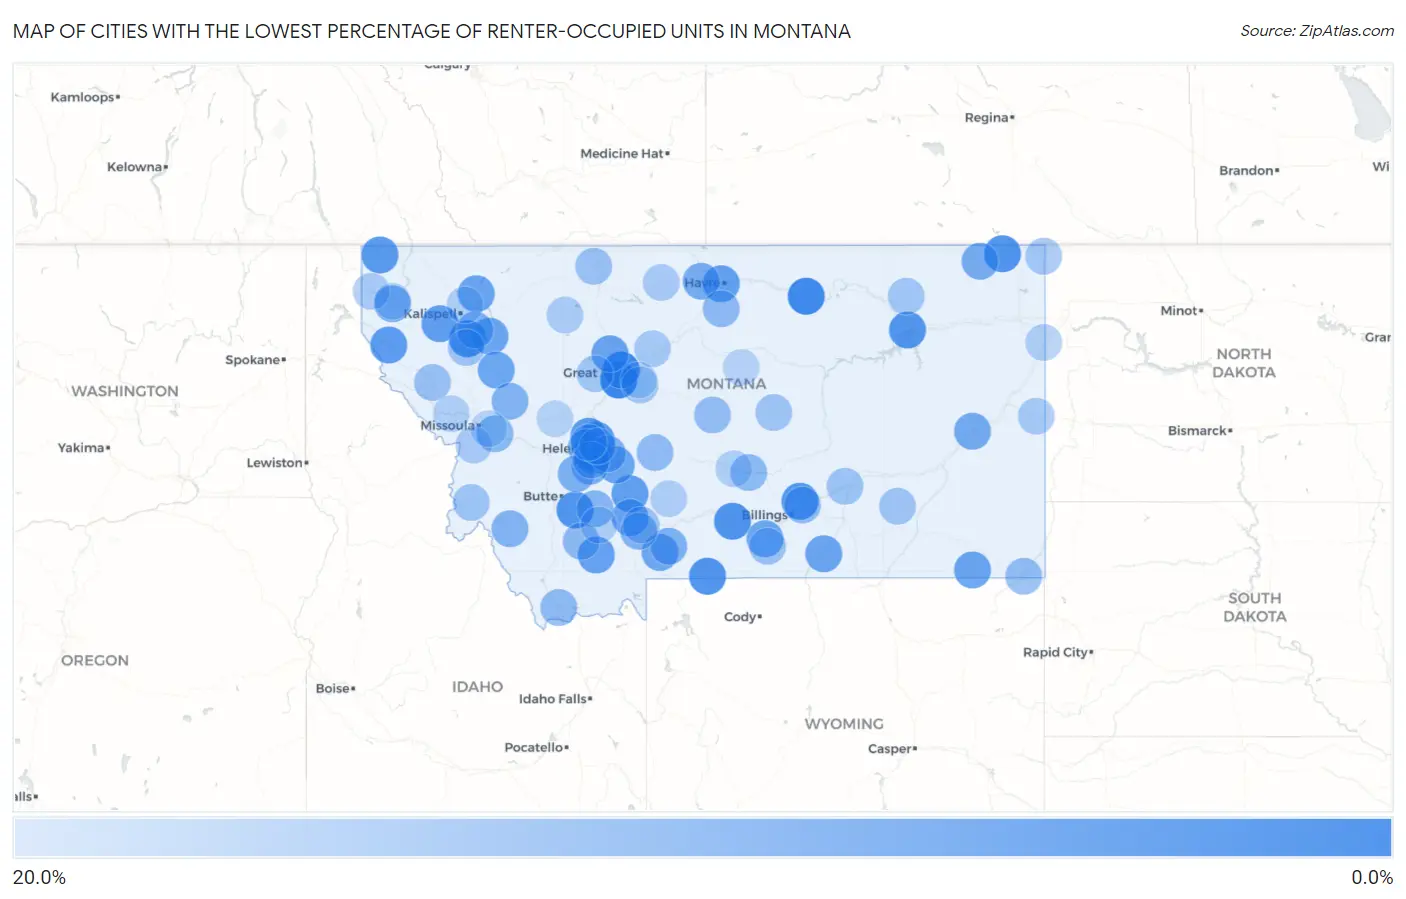
Map of Cities with the Lowest Percentage of Renter-Occupied Units in Montana
20.0%
0.0%
Cities with the Lowest Percentage of Renter-Occupied Units in Montana
| City | % Renter-Occupied | vs State | vs National | |
| 1. | Ulm | 0.33% | 31.0%(-30.6)#1 | 35.2%(-34.9)#5 |
| 2. | Sun Prairie | 1.5% | 31.0%(-29.4)#2 | 35.2%(-33.7)#129 |
| 3. | Dodson | 1.6% | 31.0%(-29.3)#3 | 35.2%(-33.5)#152 |
| 4. | South Hills | 1.9% | 31.0%(-29.1)#4 | 35.2%(-33.3)#190 |
| 5. | Rollins | 3.7% | 31.0%(-27.3)#5 | 35.2%(-31.5)#741 |
| 6. | Silver Gate | 3.8% | 31.0%(-27.2)#6 | 35.2%(-31.4)#773 |
| 7. | Reed Point | 3.8% | 31.0%(-27.1)#7 | 35.2%(-31.3)#796 |
| 8. | Outlook | 3.8% | 31.0%(-27.1)#8 | 35.2%(-31.3)#798 |
| 9. | Rader Creek | 4.2% | 31.0%(-26.8)#9 | 35.2%(-31.0)#906 |
| 10. | Shepherd | 4.4% | 31.0%(-26.6)#10 | 35.2%(-30.8)#958 |
| 11. | Fort Peck | 4.4% | 31.0%(-26.6)#11 | 35.2%(-30.8)#967 |
| 12. | Helena Valley Northeast | 4.7% | 31.0%(-26.3)#12 | 35.2%(-30.5)#1,104 |
| 13. | Tracy | 5.4% | 31.0%(-25.6)#13 | 35.2%(-29.8)#1,371 |
| 14. | Yaak | 5.4% | 31.0%(-25.5)#14 | 35.2%(-29.7)#1,405 |
| 15. | Helena Valley Northwest | 5.5% | 31.0%(-25.5)#15 | 35.2%(-29.7)#1,419 |
| 16. | Trout Creek | 6.0% | 31.0%(-25.0)#16 | 35.2%(-29.2)#1,640 |
| 17. | Marion | 6.4% | 31.0%(-24.6)#17 | 35.2%(-28.8)#1,808 |
| 18. | Gilman | 6.7% | 31.0%(-24.3)#18 | 35.2%(-28.5)#1,925 |
| 19. | West Havre | 6.8% | 31.0%(-24.1)#19 | 35.2%(-28.3)#1,986 |
| 20. | Montana City | 6.9% | 31.0%(-24.0)#20 | 35.2%(-28.2)#2,025 |
| 21. | Ponderosa Pines | 7.0% | 31.0%(-24.0)#21 | 35.2%(-28.2)#2,043 |
| 22. | Virginia City | 7.1% | 31.0%(-23.8)#22 | 35.2%(-28.0)#2,134 |
| 23. | Maverick Mountain | 7.1% | 31.0%(-23.8)#23 | 35.2%(-28.0)#2,144 |
| 24. | Power | 7.7% | 31.0%(-23.3)#24 | 35.2%(-27.5)#2,389 |
| 25. | Amsterdam | 7.7% | 31.0%(-23.3)#25 | 35.2%(-27.5)#2,397 |
| 26. | Biddle | 7.7% | 31.0%(-23.3)#26 | 35.2%(-27.5)#2,414 |
| 27. | Fort Smith | 8.0% | 31.0%(-23.0)#27 | 35.2%(-27.2)#2,543 |
| 28. | Nye | 8.0% | 31.0%(-23.0)#28 | 35.2%(-27.2)#2,548 |
| 29. | The Silos | 8.2% | 31.0%(-22.8)#29 | 35.2%(-27.0)#2,614 |
| 30. | Coram | 8.2% | 31.0%(-22.8)#30 | 35.2%(-27.0)#2,643 |
| 31. | Swan Lake | 8.3% | 31.0%(-22.6)#31 | 35.2%(-26.9)#2,693 |
| 32. | Joliet | 8.5% | 31.0%(-22.4)#32 | 35.2%(-26.6)#2,788 |
| 33. | Condon | 8.6% | 31.0%(-22.4)#33 | 35.2%(-26.6)#2,819 |
| 34. | South Glastonbury | 8.7% | 31.0%(-22.3)#34 | 35.2%(-26.5)#2,854 |
| 35. | Terry | 9.5% | 31.0%(-21.5)#35 | 35.2%(-25.7)#3,298 |
| 36. | Flaxville | 10.0% | 31.0%(-21.0)#36 | 35.2%(-25.2)#3,594 |
| 37. | Kremlin | 10.0% | 31.0%(-21.0)#37 | 35.2%(-25.2)#3,598 |
| 38. | Jackson | 10.0% | 31.0%(-21.0)#38 | 35.2%(-25.2)#3,601 |
| 39. | Helena West Side | 10.1% | 31.0%(-20.9)#39 | 35.2%(-25.1)#3,660 |
| 40. | Pioneer Junction | 10.4% | 31.0%(-20.5)#40 | 35.2%(-24.7)#3,818 |
| 41. | Brandon | 10.8% | 31.0%(-20.2)#41 | 35.2%(-24.4)#4,015 |
| 42. | Jefferson City | 10.9% | 31.0%(-20.1)#42 | 35.2%(-24.3)#4,039 |
| 43. | Woods Bay | 10.9% | 31.0%(-20.1)#43 | 35.2%(-24.3)#4,043 |
| 44. | Basin | 11.0% | 31.0%(-20.0)#44 | 35.2%(-24.2)#4,110 |
| 45. | Spokane Creek | 11.0% | 31.0%(-19.9)#45 | 35.2%(-24.1)#4,137 |
| 46. | Pray | 11.5% | 31.0%(-19.4)#46 | 35.2%(-23.7)#4,406 |
| 47. | Wisdom | 11.6% | 31.0%(-19.4)#47 | 35.2%(-23.6)#4,441 |
| 48. | Gallatin Gateway | 11.8% | 31.0%(-19.1)#48 | 35.2%(-23.3)#4,578 |
| 49. | Seeley Lake | 12.2% | 31.0%(-18.8)#49 | 35.2%(-23.0)#4,779 |
| 50. | Cardwell | 12.5% | 31.0%(-18.5)#50 | 35.2%(-22.7)#4,993 |
| 51. | Dewey | 12.5% | 31.0%(-18.5)#51 | 35.2%(-22.7)#5,007 |
| 52. | Clinton | 13.0% | 31.0%(-17.9)#52 | 35.2%(-22.1)#5,319 |
| 53. | Ryegate | 13.2% | 31.0%(-17.8)#53 | 35.2%(-22.0)#5,389 |
| 54. | Montaqua | 13.5% | 31.0%(-17.5)#54 | 35.2%(-21.7)#5,609 |
| 55. | Sheridan | 13.6% | 31.0%(-17.4)#55 | 35.2%(-21.6)#5,628 |
| 56. | Parker School | 13.6% | 31.0%(-17.4)#56 | 35.2%(-21.6)#5,633 |
| 57. | Lima | 13.7% | 31.0%(-17.3)#57 | 35.2%(-21.5)#5,701 |
| 58. | Huntley | 13.8% | 31.0%(-17.1)#58 | 35.2%(-21.3)#5,808 |
| 59. | White Sulphur Springs | 14.0% | 31.0%(-16.9)#59 | 35.2%(-21.2)#5,934 |
| 60. | Alzada | 14.3% | 31.0%(-16.7)#60 | 35.2%(-20.9)#6,131 |
| 61. | Clancy | 14.4% | 31.0%(-16.6)#61 | 35.2%(-20.8)#6,189 |
| 62. | Helena Valley Southeast | 14.7% | 31.0%(-16.3)#62 | 35.2%(-20.5)#6,374 |
| 63. | Hobson | 14.7% | 31.0%(-16.2)#63 | 35.2%(-20.4)#6,388 |
| 64. | Silver Star | 15.0% | 31.0%(-16.0)#64 | 35.2%(-20.2)#6,558 |
| 65. | Kevin | 15.2% | 31.0%(-15.8)#65 | 35.2%(-20.0)#6,644 |
| 66. | Paradise | 15.4% | 31.0%(-15.6)#66 | 35.2%(-19.8)#6,783 |
| 67. | Fromberg | 15.7% | 31.0%(-15.3)#67 | 35.2%(-19.5)#6,951 |
| 68. | Hall | 15.8% | 31.0%(-15.2)#68 | 35.2%(-19.4)#7,025 |
| 69. | Lindisfarne | 16.0% | 31.0%(-15.0)#69 | 35.2%(-19.2)#7,125 |
| 70. | Custer | 16.0% | 31.0%(-15.0)#70 | 35.2%(-19.2)#7,143 |
| 71. | Conner | 16.0% | 31.0%(-15.0)#71 | 35.2%(-19.2)#7,144 |
| 72. | King Arthur Park | 16.1% | 31.0%(-14.8)#72 | 35.2%(-19.1)#7,223 |
| 73. | Grass Range | 16.2% | 31.0%(-14.8)#73 | 35.2%(-19.0)#7,290 |
| 74. | Colstrip | 16.4% | 31.0%(-14.6)#74 | 35.2%(-18.8)#7,385 |
| 75. | Westby | 16.5% | 31.0%(-14.5)#75 | 35.2%(-18.7)#7,428 |
| 76. | St Marie | 16.6% | 31.0%(-14.4)#76 | 35.2%(-18.6)#7,483 |
| 77. | Wise River | 16.7% | 31.0%(-14.3)#77 | 35.2%(-18.5)#7,589 |
| 78. | Simms | 16.8% | 31.0%(-14.2)#78 | 35.2%(-18.4)#7,665 |
| 79. | Stockett | 17.0% | 31.0%(-14.0)#79 | 35.2%(-18.2)#7,776 |
| 80. | Carter | 17.4% | 31.0%(-13.6)#80 | 35.2%(-17.8)#8,058 |
| 81. | Wibaux | 17.6% | 31.0%(-13.4)#81 | 35.2%(-17.6)#8,178 |
| 82. | Joplin | 17.8% | 31.0%(-13.2)#82 | 35.2%(-17.4)#8,343 |
| 83. | Florence | 17.8% | 31.0%(-13.1)#83 | 35.2%(-17.3)#8,379 |
| 84. | Troy | 17.9% | 31.0%(-13.0)#84 | 35.2%(-17.2)#8,451 |
| 85. | Dupuyer | 18.2% | 31.0%(-12.8)#85 | 35.2%(-17.0)#8,613 |
| 86. | Helmville | 18.2% | 31.0%(-12.8)#86 | 35.2%(-17.0)#8,622 |
| 87. | Wilsall | 18.5% | 31.0%(-12.4)#87 | 35.2%(-16.6)#8,835 |
| 88. | Fairview | 18.6% | 31.0%(-12.4)#88 | 35.2%(-16.6)#8,864 |
| 89. | Pony | 18.6% | 31.0%(-12.4)#89 | 35.2%(-16.6)#8,869 |
| 90. | Helena Flats | 18.7% | 31.0%(-12.3)#90 | 35.2%(-16.5)#8,913 |
| 91. | Alberton | 18.8% | 31.0%(-12.2)#91 | 35.2%(-16.4)#8,956 |
| 92. | Monarch | 18.8% | 31.0%(-12.2)#92 | 35.2%(-16.4)#8,983 |
| 93. | Shawmut | 18.8% | 31.0%(-12.2)#93 | 35.2%(-16.4)#8,984 |
| 94. | Sapphire Ridge | 18.8% | 31.0%(-12.2)#94 | 35.2%(-16.4)#8,987 |
| 95. | Helena Valley West Central | 18.8% | 31.0%(-12.2)#95 | 35.2%(-16.4)#8,988 |
| 96. | White Haven | 19.4% | 31.0%(-11.6)#96 | 35.2%(-15.8)#9,396 |
| 97. | Lincoln | 19.5% | 31.0%(-11.5)#97 | 35.2%(-15.7)#9,438 |
| 98. | Turah | 19.5% | 31.0%(-11.5)#98 | 35.2%(-15.7)#9,460 |
| 99. | Sand Coulee | 19.6% | 31.0%(-11.4)#99 | 35.2%(-15.6)#9,496 |
| 100. | Winifred | 19.8% | 31.0%(-11.2)#100 | 35.2%(-15.4)#9,664 |
Common Questions
What are the Top 10 Cities with the Lowest Percentage of Renter-Occupied Units in Montana?
Top 10 Cities with the Lowest Percentage of Renter-Occupied Units in Montana are:
#1
0.33%
#2
1.5%
#3
1.6%
#4
1.9%
#5
3.7%
#6
3.8%
#7
3.8%
#8
3.8%
#9
4.2%
#10
4.4%
What city has the Lowest Percentage of Renter-Occupied Units in Montana?
Ulm has the Lowest Percentage of Renter-Occupied Units in Montana with 0.33%.
What is the Percentage of Renter-Occupied Units in the State of Montana?
Percentage of Renter-Occupied Units in Montana is 31.0%.
What is the Percentage of Renter-Occupied Units in the United States?
Percentage of Renter-Occupied Units in the United States is 35.2%.