Cities with the Lowest Percentage of Renter-Occupied Units in Illinois
RELATED REPORTS & OPTIONS
Lowest Renter-Occupied
Illinois
Compare Cities
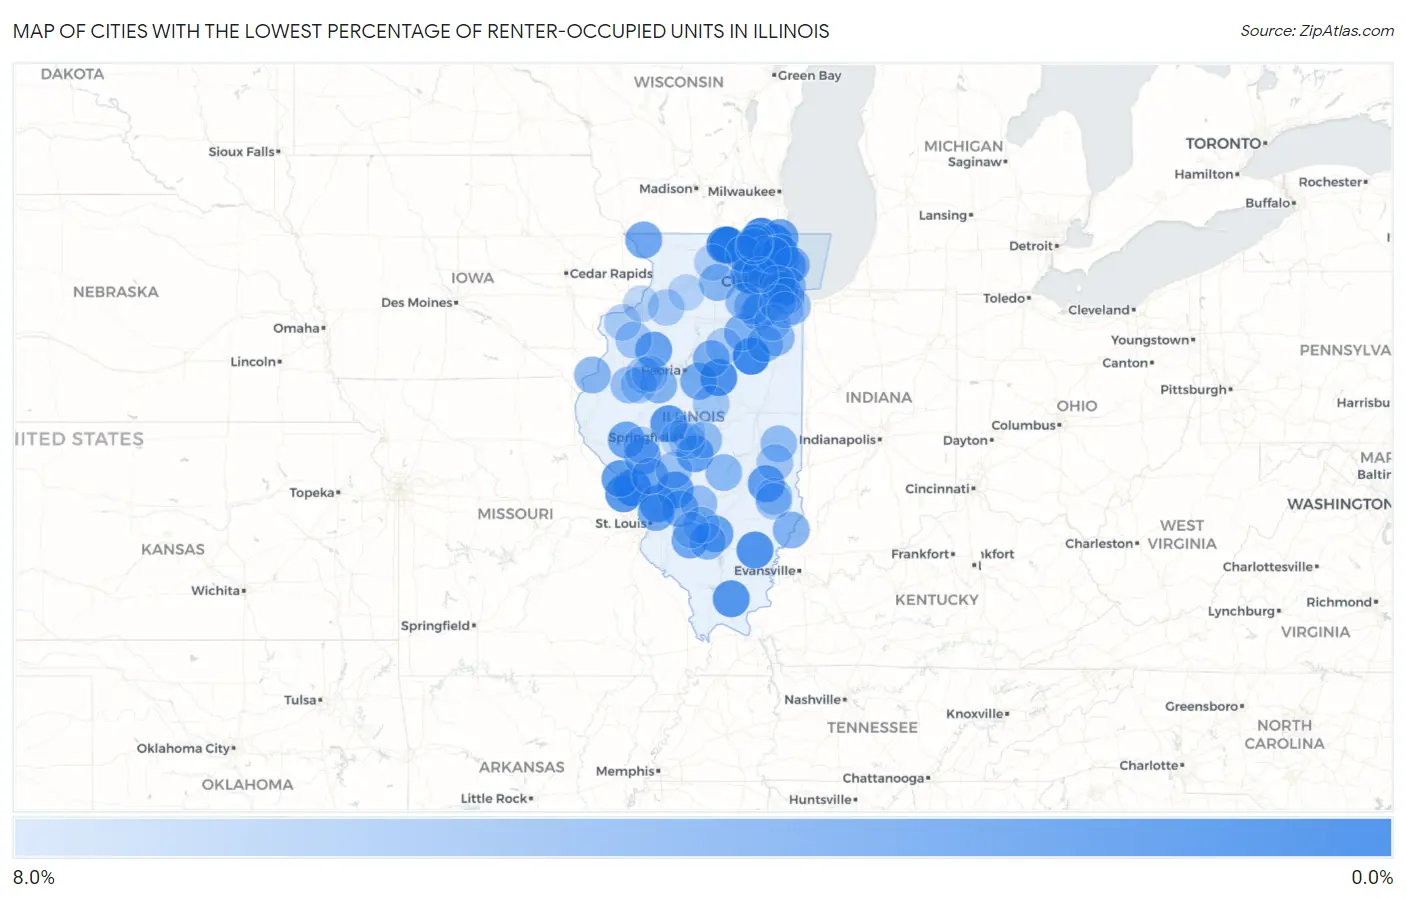
Map of Cities with the Lowest Percentage of Renter-Occupied Units in Illinois
8.0%
0.0%
Cities with the Lowest Percentage of Renter-Occupied Units in Illinois
| City | % Renter-Occupied | vs State | vs National | |
| 1. | Spring Grove | 0.38% | 33.3%(-32.9)#1 | 35.2%(-34.8)#7 |
| 2. | South Barrington | 0.56% | 33.3%(-32.8)#2 | 35.2%(-34.6)#16 |
| 3. | Third Lake | 0.65% | 33.3%(-32.7)#3 | 35.2%(-34.5)#22 |
| 4. | Saunemin | 0.68% | 33.3%(-32.6)#4 | 35.2%(-34.5)#27 |
| 5. | Timberlane | 0.70% | 33.3%(-32.6)#5 | 35.2%(-34.5)#30 |
| 6. | Trout Valley | 0.85% | 33.3%(-32.5)#6 | 35.2%(-34.3)#46 |
| 7. | Lake Carroll | 0.98% | 33.3%(-32.4)#7 | 35.2%(-34.2)#56 |
| 8. | Kildeer | 1.0% | 33.3%(-32.3)#8 | 35.2%(-34.1)#63 |
| 9. | Fieldon | 1.3% | 33.3%(-32.1)#9 | 35.2%(-33.9)#87 |
| 10. | Poplar Grove | 1.3% | 33.3%(-32.0)#10 | 35.2%(-33.9)#90 |
| 11. | Hudson | 1.4% | 33.3%(-31.9)#11 | 35.2%(-33.8)#104 |
| 12. | Mill Shoals | 1.5% | 33.3%(-31.9)#12 | 35.2%(-33.7)#121 |
| 13. | Inverness | 1.7% | 33.3%(-31.6)#13 | 35.2%(-33.5)#163 |
| 14. | Batchtown | 1.8% | 33.3%(-31.5)#14 | 35.2%(-33.4)#178 |
| 15. | New Burnside | 1.8% | 33.3%(-31.5)#15 | 35.2%(-33.4)#179 |
| 16. | Lake Petersburg | 1.9% | 33.3%(-31.4)#16 | 35.2%(-33.3)#199 |
| 17. | Campton Hills | 1.9% | 33.3%(-31.4)#17 | 35.2%(-33.3)#203 |
| 18. | Rosewood Heights | 1.9% | 33.3%(-31.4)#18 | 35.2%(-33.2)#209 |
| 19. | White City | 2.0% | 33.3%(-31.4)#19 | 35.2%(-33.2)#211 |
| 20. | Hamburg | 2.2% | 33.3%(-31.1)#20 | 35.2%(-33.0)#267 |
| 21. | North Barrington | 2.3% | 33.3%(-31.0)#21 | 35.2%(-32.9)#289 |
| 22. | Hidalgo | 2.3% | 33.3%(-31.0)#22 | 35.2%(-32.9)#295 |
| 23. | Hawthorn Woods | 2.4% | 33.3%(-30.9)#23 | 35.2%(-32.8)#326 |
| 24. | Jeisyville | 2.4% | 33.3%(-30.9)#24 | 35.2%(-32.7)#334 |
| 25. | Lily Lake | 2.5% | 33.3%(-30.8)#25 | 35.2%(-32.7)#366 |
| 26. | Manchester | 2.5% | 33.3%(-30.8)#26 | 35.2%(-32.7)#370 |
| 27. | Walnut Hill | 2.6% | 33.3%(-30.7)#27 | 35.2%(-32.6)#402 |
| 28. | Oak Run | 2.7% | 33.3%(-30.6)#28 | 35.2%(-32.5)#415 |
| 29. | Riverwoods | 2.8% | 33.3%(-30.6)#29 | 35.2%(-32.4)#432 |
| 30. | Wadsworth | 2.8% | 33.3%(-30.5)#30 | 35.2%(-32.4)#446 |
| 31. | Naples | 2.9% | 33.3%(-30.4)#31 | 35.2%(-32.3)#474 |
| 32. | Rockbridge | 2.9% | 33.3%(-30.4)#32 | 35.2%(-32.2)#485 |
| 33. | Ringwood | 3.0% | 33.3%(-30.4)#33 | 35.2%(-32.2)#491 |
| 34. | Tower Lakes | 3.1% | 33.3%(-30.3)#34 | 35.2%(-32.1)#525 |
| 35. | Addieville | 3.1% | 33.3%(-30.3)#35 | 35.2%(-32.1)#529 |
| 36. | The Galena Territory | 3.1% | 33.3%(-30.3)#36 | 35.2%(-32.1)#534 |
| 37. | Golf | 3.1% | 33.3%(-30.2)#37 | 35.2%(-32.1)#540 |
| 38. | Union | 3.1% | 33.3%(-30.2)#38 | 35.2%(-32.0)#553 |
| 39. | Heritage Lake | 3.2% | 33.3%(-30.1)#39 | 35.2%(-32.0)#588 |
| 40. | Grantfork | 3.3% | 33.3%(-30.0)#40 | 35.2%(-31.9)#614 |
| 41. | Mitchell | 3.3% | 33.3%(-30.0)#41 | 35.2%(-31.8)#625 |
| 42. | Western Springs | 3.4% | 33.3%(-29.9)#42 | 35.2%(-31.8)#638 |
| 43. | Benson | 3.5% | 33.3%(-29.8)#43 | 35.2%(-31.7)#676 |
| 44. | Kinsman | 3.6% | 33.3%(-29.8)#44 | 35.2%(-31.6)#707 |
| 45. | Long Grove | 3.6% | 33.3%(-29.7)#45 | 35.2%(-31.6)#715 |
| 46. | Mettawa | 3.7% | 33.3%(-29.6)#46 | 35.2%(-31.5)#751 |
| 47. | Kenilworth | 3.8% | 33.3%(-29.5)#47 | 35.2%(-31.4)#783 |
| 48. | Allendale | 3.9% | 33.3%(-29.4)#48 | 35.2%(-31.3)#815 |
| 49. | Richview | 4.0% | 33.3%(-29.3)#49 | 35.2%(-31.2)#842 |
| 50. | St David | 4.1% | 33.3%(-29.2)#50 | 35.2%(-31.1)#873 |
| 51. | Pontoosuc | 4.2% | 33.3%(-29.2)#51 | 35.2%(-31.0)#889 |
| 52. | Steward | 4.2% | 33.3%(-29.1)#52 | 35.2%(-31.0)#907 |
| 53. | Limestone | 4.2% | 33.3%(-29.1)#53 | 35.2%(-31.0)#909 |
| 54. | Forest View | 4.2% | 33.3%(-29.1)#54 | 35.2%(-31.0)#911 |
| 55. | Shorewood | 4.3% | 33.3%(-29.0)#55 | 35.2%(-30.9)#942 |
| 56. | Lakewood | 4.4% | 33.3%(-29.0)#56 | 35.2%(-30.8)#960 |
| 57. | Forest Lake | 4.4% | 33.3%(-28.9)#57 | 35.2%(-30.8)#974 |
| 58. | East Lynn | 4.5% | 33.3%(-28.8)#58 | 35.2%(-30.7)#997 |
| 59. | Flossmoor | 4.5% | 33.3%(-28.8)#59 | 35.2%(-30.6)#1,018 |
| 60. | Minooka | 4.6% | 33.3%(-28.7)#60 | 35.2%(-30.6)#1,052 |
| 61. | Burr Ridge | 4.6% | 33.3%(-28.7)#61 | 35.2%(-30.6)#1,066 |
| 62. | Oak Brook | 4.6% | 33.3%(-28.7)#62 | 35.2%(-30.6)#1,069 |
| 63. | Brocton | 4.7% | 33.3%(-28.6)#63 | 35.2%(-30.5)#1,092 |
| 64. | Plattville | 4.7% | 33.3%(-28.6)#64 | 35.2%(-30.5)#1,093 |
| 65. | Buckingham | 4.7% | 33.3%(-28.6)#65 | 35.2%(-30.5)#1,100 |
| 66. | Mount Auburn | 4.7% | 33.3%(-28.6)#66 | 35.2%(-30.5)#1,105 |
| 67. | Millbrook | 4.7% | 33.3%(-28.6)#67 | 35.2%(-30.5)#1,107 |
| 68. | Smithboro | 4.8% | 33.3%(-28.5)#68 | 35.2%(-30.4)#1,143 |
| 69. | Bardolph | 4.8% | 33.3%(-28.5)#69 | 35.2%(-30.3)#1,154 |
| 70. | Willow Hill | 4.9% | 33.3%(-28.4)#70 | 35.2%(-30.3)#1,172 |
| 71. | Palos Heights | 4.9% | 33.3%(-28.4)#71 | 35.2%(-30.2)#1,202 |
| 72. | Standard City | 5.0% | 33.3%(-28.3)#72 | 35.2%(-30.2)#1,222 |
| 73. | North Henderson | 5.1% | 33.3%(-28.2)#73 | 35.2%(-30.1)#1,268 |
| 74. | Westfield | 5.2% | 33.3%(-28.1)#74 | 35.2%(-29.9)#1,314 |
| 75. | Waynesville | 5.4% | 33.3%(-27.9)#75 | 35.2%(-29.8)#1,388 |
| 76. | Ellisville | 5.4% | 33.3%(-27.9)#76 | 35.2%(-29.8)#1,393 |
| 77. | Argyle | 5.5% | 33.3%(-27.8)#77 | 35.2%(-29.7)#1,447 |
| 78. | Lowpoint | 5.6% | 33.3%(-27.8)#78 | 35.2%(-29.6)#1,462 |
| 79. | Huey | 5.6% | 33.3%(-27.8)#79 | 35.2%(-29.6)#1,466 |
| 80. | Marietta | 5.6% | 33.3%(-27.8)#80 | 35.2%(-29.6)#1,470 |
| 81. | Symerton | 5.6% | 33.3%(-27.8)#81 | 35.2%(-29.6)#1,471 |
| 82. | Bartelso | 5.6% | 33.3%(-27.7)#82 | 35.2%(-29.6)#1,495 |
| 83. | Ste Marie | 5.6% | 33.3%(-27.7)#83 | 35.2%(-29.6)#1,496 |
| 84. | Long Point | 5.6% | 33.3%(-27.7)#84 | 35.2%(-29.5)#1,502 |
| 85. | Lynnville | 5.7% | 33.3%(-27.7)#85 | 35.2%(-29.5)#1,509 |
| 86. | Hooppole | 5.7% | 33.3%(-27.6)#86 | 35.2%(-29.5)#1,526 |
| 87. | Reynolds | 5.8% | 33.3%(-27.6)#87 | 35.2%(-29.4)#1,542 |
| 88. | Homer Glen | 5.8% | 33.3%(-27.6)#88 | 35.2%(-29.4)#1,546 |
| 89. | Davis Junction | 5.9% | 33.3%(-27.4)#89 | 35.2%(-29.3)#1,615 |
| 90. | Frankfort | 5.9% | 33.3%(-27.4)#90 | 35.2%(-29.3)#1,619 |
| 91. | Rochester | 6.0% | 33.3%(-27.4)#91 | 35.2%(-29.2)#1,636 |
| 92. | Fairview | 6.0% | 33.3%(-27.3)#92 | 35.2%(-29.2)#1,639 |
| 93. | Wayne | 6.0% | 33.3%(-27.3)#93 | 35.2%(-29.2)#1,653 |
| 94. | Willow Lake | 6.2% | 33.3%(-27.2)#94 | 35.2%(-29.0)#1,705 |
| 95. | Rapids City | 6.2% | 33.3%(-27.1)#95 | 35.2%(-29.0)#1,708 |
| 96. | Leland Grove | 6.2% | 33.3%(-27.1)#96 | 35.2%(-28.9)#1,732 |
| 97. | Harmon | 6.2% | 33.3%(-27.1)#97 | 35.2%(-28.9)#1,745 |
| 98. | Spaulding | 6.3% | 33.3%(-27.0)#98 | 35.2%(-28.9)#1,764 |
| 99. | Bull Valley | 6.3% | 33.3%(-27.0)#99 | 35.2%(-28.8)#1,781 |
| 100. | Wonder Lake | 6.4% | 33.3%(-27.0)#100 | 35.2%(-28.8)#1,792 |
Common Questions
What are the Top 10 Cities with the Lowest Percentage of Renter-Occupied Units in Illinois?
Top 10 Cities with the Lowest Percentage of Renter-Occupied Units in Illinois are:
#1
0.38%
#2
0.56%
#3
0.65%
#4
0.68%
#5
0.70%
#6
0.85%
#7
1.0%
#8
1.3%
#9
1.3%
#10
1.4%
What city has the Lowest Percentage of Renter-Occupied Units in Illinois?
Spring Grove has the Lowest Percentage of Renter-Occupied Units in Illinois with 0.38%.
What is the Percentage of Renter-Occupied Units in the State of Illinois?
Percentage of Renter-Occupied Units in Illinois is 33.3%.
What is the Percentage of Renter-Occupied Units in the United States?
Percentage of Renter-Occupied Units in the United States is 35.2%.