Cities with the Lowest Percentage of Renter-Occupied Units in Connecticut
RELATED REPORTS & OPTIONS
Lowest Renter-Occupied
Connecticut
Compare Cities
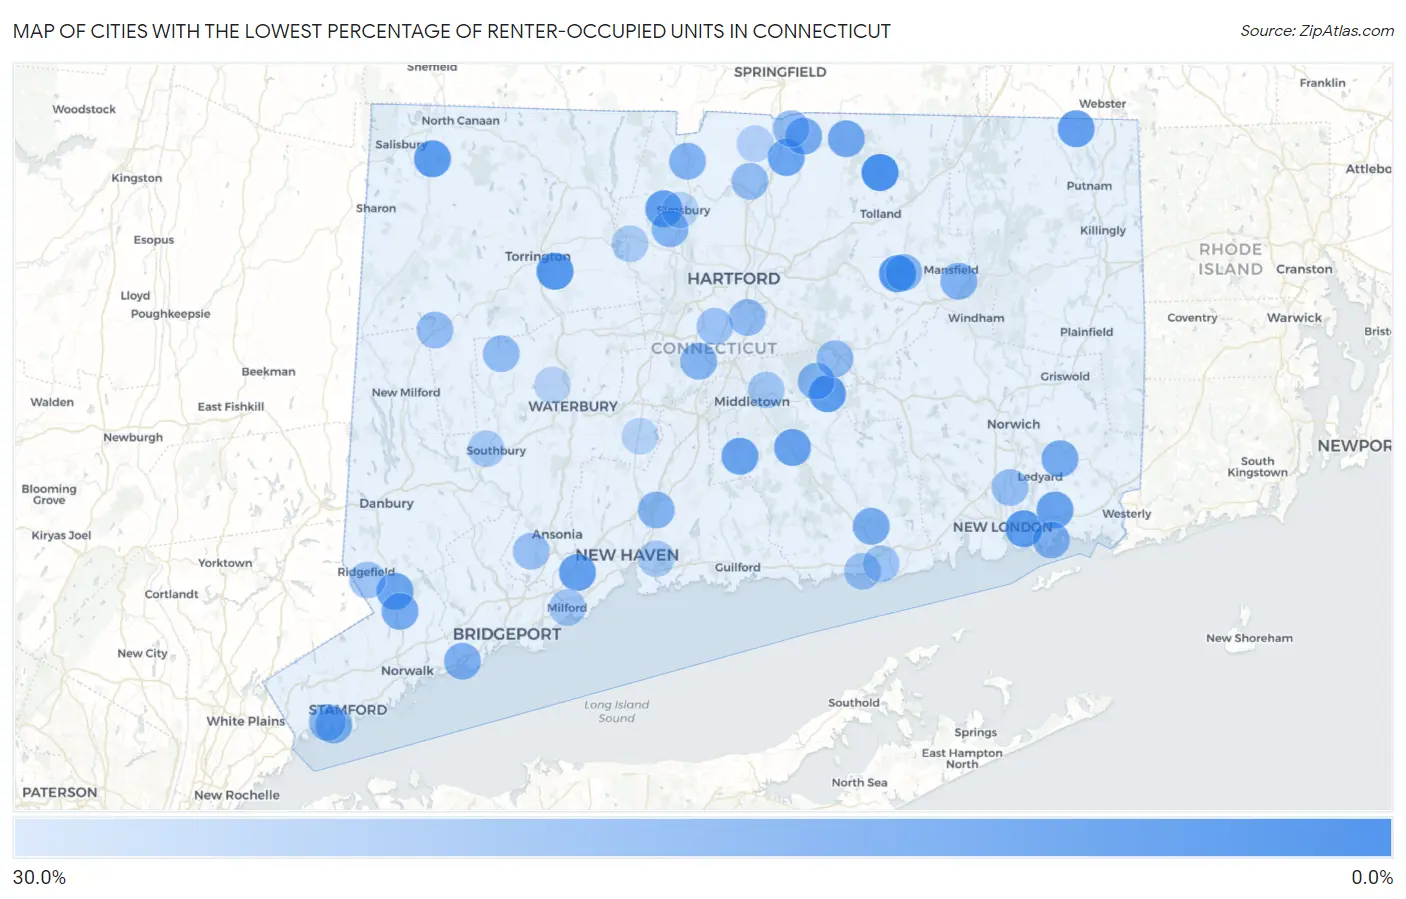
Map of Cities with the Lowest Percentage of Renter-Occupied Units in Connecticut
30.0%
0.0%
Cities with the Lowest Percentage of Renter-Occupied Units in Connecticut
| City | % Renter-Occupied | vs State | vs National | |
| 1. | Lakes East | 1.5% | 33.8%(-32.4)#1 | 35.2%(-33.7)#116 |
| 2. | Poplar Plains | 1.7% | 33.8%(-32.1)#2 | 35.2%(-33.5)#164 |
| 3. | Plattsville | 2.1% | 33.8%(-31.7)#3 | 35.2%(-33.0)#252 |
| 4. | Inglenook | 2.4% | 33.8%(-31.5)#4 | 35.2%(-32.8)#315 |
| 5. | Coleytown | 3.3% | 33.8%(-30.6)#5 | 35.2%(-31.9)#604 |
| 6. | Bridgewater | 3.6% | 33.8%(-30.2)#6 | 35.2%(-31.5)#719 |
| 7. | Fenwick Borough | 4.2% | 33.8%(-29.7)#7 | 35.2%(-31.0)#894 |
| 8. | Tashua | 4.3% | 33.8%(-29.6)#8 | 35.2%(-30.9)#927 |
| 9. | Indian Field | 4.5% | 33.8%(-29.3)#9 | 35.2%(-30.6)#1,023 |
| 10. | East | 4.9% | 33.8%(-29.0)#10 | 35.2%(-30.3)#1,168 |
| 11. | Sandy Hook | 5.3% | 33.8%(-28.5)#11 | 35.2%(-29.9)#1,355 |
| 12. | Crystal Lake | 5.5% | 33.8%(-28.4)#12 | 35.2%(-29.7)#1,417 |
| 13. | Mill Plain | 5.9% | 33.8%(-28.0)#13 | 35.2%(-29.3)#1,583 |
| 14. | Tokeneke | 6.0% | 33.8%(-27.8)#14 | 35.2%(-29.2)#1,644 |
| 15. | Candlewood Isle | 6.1% | 33.8%(-27.7)#15 | 35.2%(-29.0)#1,697 |
| 16. | Candlewood Orchards | 6.2% | 33.8%(-27.6)#16 | 35.2%(-29.0)#1,715 |
| 17. | Lake Bungee | 6.6% | 33.8%(-27.3)#17 | 35.2%(-28.6)#1,876 |
| 18. | Mamanasco Lake | 6.6% | 33.8%(-27.2)#18 | 35.2%(-28.6)#1,897 |
| 19. | Coventry Lake | 7.3% | 33.8%(-26.5)#19 | 35.2%(-27.9)#2,204 |
| 20. | Staples | 7.8% | 33.8%(-26.1)#20 | 35.2%(-27.4)#2,431 |
| 21. | Northwest Harwinton | 7.8% | 33.8%(-26.1)#21 | 35.2%(-27.4)#2,434 |
| 22. | Daniels Farm | 8.0% | 33.8%(-25.9)#22 | 35.2%(-27.2)#2,523 |
| 23. | Redding Center | 8.1% | 33.8%(-25.7)#23 | 35.2%(-27.1)#2,589 |
| 24. | Stepney | 8.3% | 33.8%(-25.6)#24 | 35.2%(-26.9)#2,671 |
| 25. | Long Hill | 8.7% | 33.8%(-25.2)#25 | 35.2%(-26.5)#2,846 |
| 26. | Falls Village | 8.9% | 33.8%(-24.9)#26 | 35.2%(-26.2)#3,011 |
| 27. | Ridgebury | 9.0% | 33.8%(-24.8)#27 | 35.2%(-26.1)#3,074 |
| 28. | East Hampton | 9.2% | 33.8%(-24.7)#28 | 35.2%(-26.0)#3,156 |
| 29. | Northford | 9.4% | 33.8%(-24.5)#29 | 35.2%(-25.8)#3,260 |
| 30. | Greens Farms | 9.5% | 33.8%(-24.4)#30 | 35.2%(-25.7)#3,314 |
| 31. | Quinebaug | 10.4% | 33.8%(-23.5)#31 | 35.2%(-24.8)#3,779 |
| 32. | West Simsbury | 10.4% | 33.8%(-23.4)#32 | 35.2%(-24.8)#3,794 |
| 33. | Newtown Borough | 10.8% | 33.8%(-23.1)#33 | 35.2%(-24.4)#3,988 |
| 34. | Old Hill | 10.9% | 33.8%(-23.0)#34 | 35.2%(-24.3)#4,042 |
| 35. | Orange | 11.0% | 33.8%(-22.8)#35 | 35.2%(-24.2)#4,132 |
| 36. | Higganum | 11.5% | 33.8%(-22.3)#36 | 35.2%(-23.7)#4,391 |
| 37. | Durham | 11.5% | 33.8%(-22.3)#37 | 35.2%(-23.7)#4,400 |
| 38. | Old Mystic | 11.5% | 33.8%(-22.3)#38 | 35.2%(-23.7)#4,403 |
| 39. | Candlewood Shores | 12.3% | 33.8%(-21.5)#39 | 35.2%(-22.9)#4,869 |
| 40. | Georgetown | 12.4% | 33.8%(-21.5)#40 | 35.2%(-22.8)#4,899 |
| 41. | Southwood Acres | 12.5% | 33.8%(-21.4)#41 | 35.2%(-22.7)#4,947 |
| 42. | Knollcrest | 12.5% | 33.8%(-21.3)#42 | 35.2%(-22.7)#4,959 |
| 43. | Somers | 13.0% | 33.8%(-20.8)#43 | 35.2%(-22.2)#5,305 |
| 44. | Quasset Lake | 13.1% | 33.8%(-20.8)#44 | 35.2%(-22.1)#5,355 |
| 45. | Ball Pond | 13.3% | 33.8%(-20.6)#45 | 35.2%(-21.9)#5,448 |
| 46. | Oronoque | 13.4% | 33.8%(-20.5)#46 | 35.2%(-21.8)#5,520 |
| 47. | Rock Ridge | 13.4% | 33.8%(-20.5)#47 | 35.2%(-21.8)#5,523 |
| 48. | Lordship | 13.5% | 33.8%(-20.4)#48 | 35.2%(-21.7)#5,590 |
| 49. | Lakeside Woods | 13.8% | 33.8%(-20.1)#49 | 35.2%(-21.4)#5,765 |
| 50. | Hazardville | 14.3% | 33.8%(-19.6)#50 | 35.2%(-20.9)#6,070 |
| 51. | Mashantucket | 14.3% | 33.8%(-19.6)#51 | 35.2%(-20.9)#6,107 |
| 52. | Taylor Corners | 14.5% | 33.8%(-19.3)#52 | 35.2%(-20.7)#6,241 |
| 53. | Cannondale | 14.5% | 33.8%(-19.3)#53 | 35.2%(-20.6)#6,263 |
| 54. | Westport | 14.9% | 33.8%(-19.0)#54 | 35.2%(-20.3)#6,464 |
| 55. | Essex Village | 15.1% | 33.8%(-18.7)#55 | 35.2%(-20.1)#6,616 |
| 56. | Compo | 15.3% | 33.8%(-18.5)#56 | 35.2%(-19.8)#6,744 |
| 57. | Southport | 16.3% | 33.8%(-17.6)#57 | 35.2%(-18.9)#7,326 |
| 58. | Old Greenwich | 16.6% | 33.8%(-17.2)#58 | 35.2%(-18.6)#7,512 |
| 59. | Noank | 16.7% | 33.8%(-17.2)#59 | 35.2%(-18.5)#7,523 |
| 60. | Lake Pocotopaug | 16.9% | 33.8%(-17.0)#60 | 35.2%(-18.3)#7,696 |
| 61. | Mansfield Center | 17.0% | 33.8%(-16.8)#61 | 35.2%(-18.2)#7,809 |
| 62. | Salmon Brook | 17.1% | 33.8%(-16.8)#62 | 35.2%(-18.1)#7,845 |
| 63. | Kensington | 17.4% | 33.8%(-16.4)#63 | 35.2%(-17.8)#8,075 |
| 64. | Candlewood Knolls | 17.5% | 33.8%(-16.4)#64 | 35.2%(-17.7)#8,105 |
| 65. | North Haven | 17.5% | 33.8%(-16.4)#65 | 35.2%(-17.7)#8,125 |
| 66. | Weatogue | 17.6% | 33.8%(-16.2)#66 | 35.2%(-17.5)#8,237 |
| 67. | Groton Long Point Borough | 18.3% | 33.8%(-15.5)#67 | 35.2%(-16.9)#8,691 |
| 68. | Riverside | 18.4% | 33.8%(-15.4)#68 | 35.2%(-16.8)#8,732 |
| 69. | South Coventry | 18.5% | 33.8%(-15.3)#69 | 35.2%(-16.7)#8,804 |
| 70. | Woodmont Borough | 18.8% | 33.8%(-15.1)#70 | 35.2%(-16.4)#9,002 |
| 71. | Sherwood Manor | 19.5% | 33.8%(-14.3)#71 | 35.2%(-15.7)#9,472 |
| 72. | Terramuggus | 19.7% | 33.8%(-14.2)#72 | 35.2%(-15.5)#9,579 |
| 73. | Wethersfield | 19.8% | 33.8%(-14.1)#73 | 35.2%(-15.4)#9,648 |
| 74. | Trumbull Center | 19.8% | 33.8%(-14.0)#74 | 35.2%(-15.3)#9,683 |
| 75. | Windsor Locks | 20.1% | 33.8%(-13.7)#75 | 35.2%(-15.1)#9,913 |
| 76. | Bethlehem Village | 20.3% | 33.8%(-13.6)#76 | 35.2%(-14.9)#10,013 |
| 77. | New Preston | 20.5% | 33.8%(-13.4)#77 | 35.2%(-14.7)#10,122 |
| 78. | Gales Ferry | 20.7% | 33.8%(-13.1)#78 | 35.2%(-14.4)#10,282 |
| 79. | Gaylordsville | 21.0% | 33.8%(-12.9)#79 | 35.2%(-14.2)#10,415 |
| 80. | Shelton | 21.5% | 33.8%(-12.3)#80 | 35.2%(-13.7)#10,800 |
| 81. | Saybrook Manor | 21.8% | 33.8%(-12.1)#81 | 35.2%(-13.4)#11,002 |
| 82. | Noroton Heights | 21.9% | 33.8%(-11.9)#82 | 35.2%(-13.3)#11,084 |
| 83. | Old Saybrook Center | 22.3% | 33.8%(-11.6)#83 | 35.2%(-12.9)#11,316 |
| 84. | Newington | 22.4% | 33.8%(-11.5)#84 | 35.2%(-12.8)#11,391 |
| 85. | Ridgefield | 23.0% | 33.8%(-10.9)#85 | 35.2%(-12.2)#11,774 |
| 86. | Portland | 23.2% | 33.8%(-10.6)#86 | 35.2%(-12.0)#11,948 |
| 87. | Milford City Balance | 23.3% | 33.8%(-10.5)#87 | 35.2%(-11.9)#12,008 |
| 88. | East Haven | 24.5% | 33.8%(-9.32)#88 | 35.2%(-10.7)#12,858 |
| 89. | Heritage Village | 24.6% | 33.8%(-9.26)#89 | 35.2%(-10.6)#12,881 |
| 90. | Darien Downtown | 24.6% | 33.8%(-9.23)#90 | 35.2%(-10.6)#12,898 |
| 91. | Litchfield Borough | 24.9% | 33.8%(-8.95)#91 | 35.2%(-10.3)#13,110 |
| 92. | Collinsville | 25.3% | 33.8%(-8.52)#92 | 35.2%(-9.85)#13,391 |
| 93. | Saugatuck | 25.9% | 33.8%(-7.92)#93 | 35.2%(-9.25)#13,765 |
| 94. | Topstone | 26.3% | 33.8%(-7.53)#94 | 35.2%(-8.87)#14,039 |
| 95. | Noroton | 26.3% | 33.8%(-7.52)#95 | 35.2%(-8.85)#14,049 |
| 96. | Suffield Depot | 26.5% | 33.8%(-7.35)#96 | 35.2%(-8.68)#14,154 |
| 97. | South Wilton | 26.6% | 33.8%(-7.27)#97 | 35.2%(-8.61)#14,203 |
| 98. | Cheshire Village | 27.0% | 33.8%(-6.86)#98 | 35.2%(-8.19)#14,488 |
| 99. | Simsbury Center | 27.0% | 33.8%(-6.81)#99 | 35.2%(-8.14)#14,529 |
| 100. | Oakville | 27.5% | 33.8%(-6.33)#100 | 35.2%(-7.67)#14,855 |
Common Questions
What are the Top 10 Cities with the Lowest Percentage of Renter-Occupied Units in Connecticut?
Top 10 Cities with the Lowest Percentage of Renter-Occupied Units in Connecticut are:
#1
5.5%
#2
7.3%
#3
7.8%
#4
8.7%
#5
8.9%
#6
9.2%
#7
10.4%
#8
10.4%
#9
11.0%
#10
11.5%
What city has the Lowest Percentage of Renter-Occupied Units in Connecticut?
Crystal Lake has the Lowest Percentage of Renter-Occupied Units in Connecticut with 5.5%.
What is the Percentage of Renter-Occupied Units in the State of Connecticut?
Percentage of Renter-Occupied Units in Connecticut is 33.8%.
What is the Percentage of Renter-Occupied Units in the United States?
Percentage of Renter-Occupied Units in the United States is 35.2%.