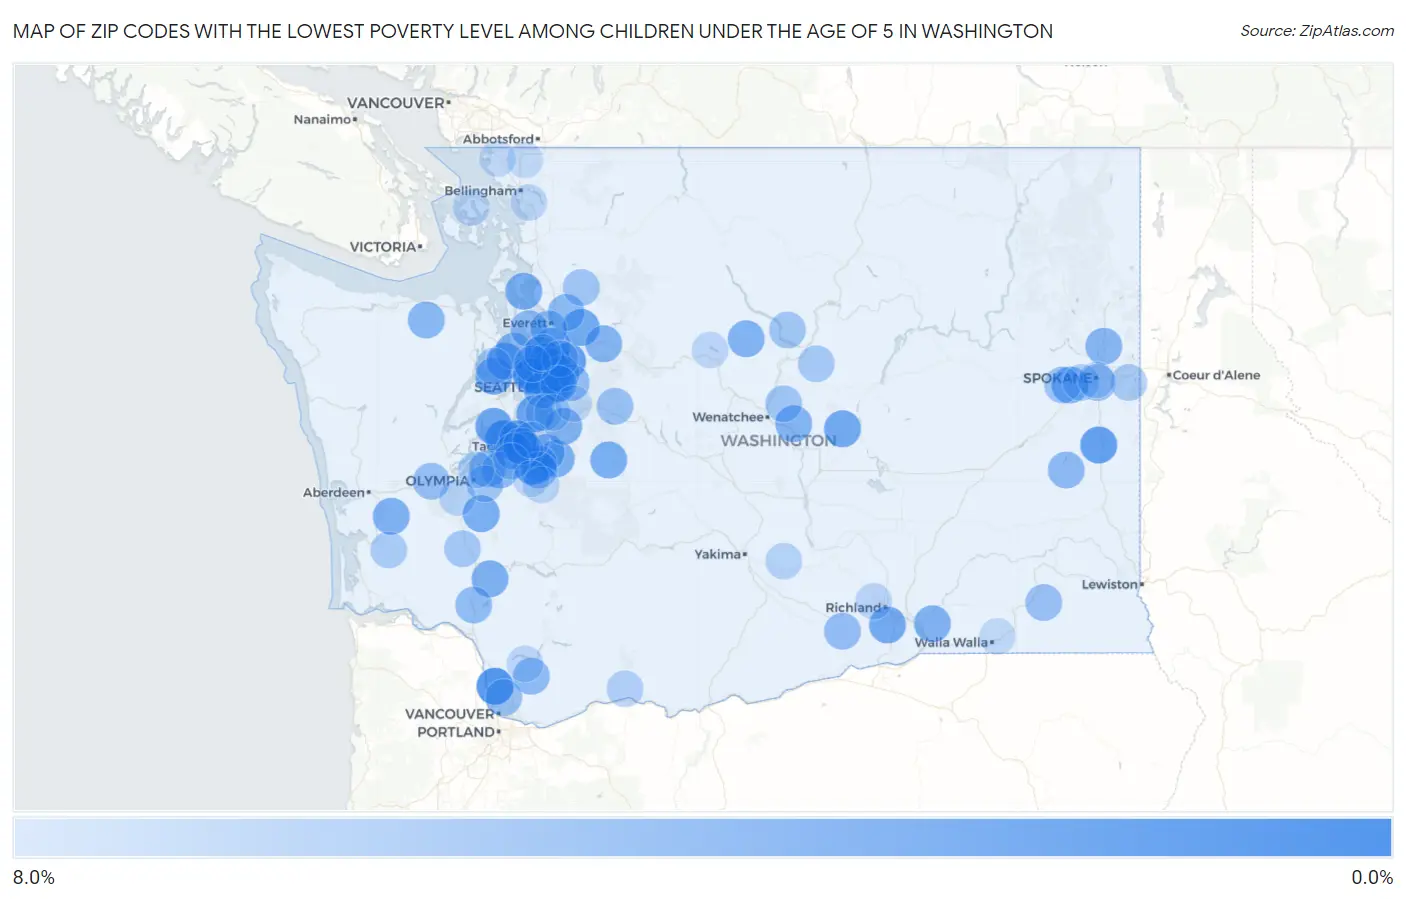
Zip Codes with the Lowest Poverty Level Among Children Under the Age of 5 in Washington
RELATED REPORTS & OPTIONS
Lowest Poverty | Child 0-5
Washington
Compare Zip Codes
Map of Zip Codes with the Lowest Poverty Level Among Children Under the Age of 5 in Washington
8.0%
0.0%
Zip Codes with the Lowest Poverty Level Among Children Under the Age of 5 in Washington
| Zip Code | Child Poverty | vs State | vs National | |
| 1. | 98642 | 0.16% | 12.6%(-12.5)#1 | 18.1%(-17.9)#4 |
| 2. | 98335 | 0.47% | 12.6%(-12.1)#2 | 18.1%(-17.6)#51 |
| 3. | 98103 | 0.55% | 12.6%(-12.1)#3 | 18.1%(-17.5)#76 |
| 4. | 98446 | 0.84% | 12.6%(-11.8)#4 | 18.1%(-17.2)#195 |
| 5. | 98077 | 1.0% | 12.6%(-11.6)#5 | 18.1%(-17.0)#295 |
| 6. | 99170 | 1.2% | 12.6%(-11.4)#6 | 18.1%(-16.8)#395 |
| 7. | 98011 | 1.5% | 12.6%(-11.1)#7 | 18.1%(-16.6)#531 |
| 8. | 98166 | 1.6% | 12.6%(-11.0)#8 | 18.1%(-16.5)#579 |
| 9. | 98406 | 1.8% | 12.6%(-10.9)#9 | 18.1%(-16.3)#685 |
| 10. | 98329 | 1.8% | 12.6%(-10.8)#10 | 18.1%(-16.3)#707 |
| 11. | 98407 | 2.0% | 12.6%(-10.7)#11 | 18.1%(-16.1)#808 |
| 12. | 98290 | 2.0% | 12.6%(-10.6)#12 | 18.1%(-16.0)#846 |
| 13. | 98823 | 2.1% | 12.6%(-10.5)#13 | 18.1%(-16.0)#881 |
| 14. | 98115 | 2.1% | 12.6%(-10.5)#14 | 18.1%(-15.9)#930 |
| 15. | 99338 | 2.3% | 12.6%(-10.4)#15 | 18.1%(-15.8)#1,014 |
| 16. | 98383 | 2.3% | 12.6%(-10.3)#16 | 18.1%(-15.8)#1,015 |
| 17. | 98370 | 2.3% | 12.6%(-10.3)#17 | 18.1%(-15.8)#1,031 |
| 18. | 98012 | 2.3% | 12.6%(-10.3)#18 | 18.1%(-15.7)#1,049 |
| 19. | 98155 | 2.3% | 12.6%(-10.3)#19 | 18.1%(-15.7)#1,053 |
| 20. | 98589 | 2.7% | 12.6%(-9.93)#20 | 18.1%(-15.4)#1,283 |
| 21. | 98282 | 2.7% | 12.6%(-9.93)#21 | 18.1%(-15.4)#1,284 |
| 22. | 98022 | 2.7% | 12.6%(-9.92)#22 | 18.1%(-15.4)#1,289 |
| 23. | 98033 | 2.7% | 12.6%(-9.87)#23 | 18.1%(-15.3)#1,324 |
| 24. | 98391 | 2.8% | 12.6%(-9.85)#24 | 18.1%(-15.3)#1,342 |
| 25. | 99011 | 2.9% | 12.6%(-9.71)#25 | 18.1%(-15.2)#1,448 |
| 26. | 98537 | 3.0% | 12.6%(-9.59)#26 | 18.1%(-15.0)#1,516 |
| 27. | 98591 | 3.0% | 12.6%(-9.58)#27 | 18.1%(-15.0)#1,536 |
| 28. | 98004 | 3.0% | 12.6%(-9.57)#28 | 18.1%(-15.0)#1,537 |
| 29. | 98372 | 3.1% | 12.6%(-9.54)#29 | 18.1%(-15.0)#1,560 |
| 30. | 98042 | 3.2% | 12.6%(-9.43)#30 | 18.1%(-14.9)#1,633 |
| 31. | 99323 | 3.2% | 12.6%(-9.39)#31 | 18.1%(-14.8)#1,649 |
| 32. | 98822 | 3.2% | 12.6%(-9.39)#32 | 18.1%(-14.8)#1,654 |
| 33. | 98850 | 3.2% | 12.6%(-9.39)#33 | 18.1%(-14.8)#1,655 |
| 34. | 98117 | 3.4% | 12.6%(-9.24)#34 | 18.1%(-14.7)#1,742 |
| 35. | 98346 | 3.4% | 12.6%(-9.23)#35 | 18.1%(-14.7)#1,751 |
| 36. | 98005 | 3.4% | 12.6%(-9.23)#36 | 18.1%(-14.7)#1,756 |
| 37. | 98294 | 3.5% | 12.6%(-9.14)#37 | 18.1%(-14.6)#1,817 |
| 38. | 99005 | 3.6% | 12.6%(-9.01)#38 | 18.1%(-14.5)#1,881 |
| 39. | 98028 | 3.8% | 12.6%(-8.85)#39 | 18.1%(-14.3)#2,002 |
| 40. | 98362 | 3.8% | 12.6%(-8.83)#40 | 18.1%(-14.3)#2,016 |
| 41. | 98373 | 3.9% | 12.6%(-8.75)#41 | 18.1%(-14.2)#2,075 |
| 42. | 98258 | 3.9% | 12.6%(-8.70)#42 | 18.1%(-14.1)#2,103 |
| 43. | 98516 | 4.0% | 12.6%(-8.64)#43 | 18.1%(-14.1)#2,153 |
| 44. | 99171 | 4.0% | 12.6%(-8.62)#44 | 18.1%(-14.1)#2,176 |
| 45. | 98327 | 4.0% | 12.6%(-8.61)#45 | 18.1%(-14.1)#2,184 |
| 46. | 98107 | 4.0% | 12.6%(-8.60)#46 | 18.1%(-14.0)#2,190 |
| 47. | 98034 | 4.0% | 12.6%(-8.58)#47 | 18.1%(-14.0)#2,203 |
| 48. | 98675 | 4.0% | 12.6%(-8.57)#48 | 18.1%(-14.0)#2,204 |
| 49. | 98236 | 4.1% | 12.6%(-8.52)#49 | 18.1%(-14.0)#2,244 |
| 50. | 98611 | 4.3% | 12.6%(-8.36)#50 | 18.1%(-13.8)#2,381 |
| 51. | 98074 | 4.3% | 12.6%(-8.35)#51 | 18.1%(-13.8)#2,385 |
| 52. | 98144 | 4.3% | 12.6%(-8.29)#52 | 18.1%(-13.7)#2,430 |
| 53. | 98418 | 4.4% | 12.6%(-8.19)#53 | 18.1%(-13.6)#2,493 |
| 54. | 99350 | 4.5% | 12.6%(-8.11)#54 | 18.1%(-13.6)#2,565 |
| 55. | 98466 | 4.5% | 12.6%(-8.10)#55 | 18.1%(-13.5)#2,572 |
| 56. | 98043 | 4.6% | 12.6%(-8.06)#56 | 18.1%(-13.5)#2,603 |
| 57. | 98052 | 4.6% | 12.6%(-8.03)#57 | 18.1%(-13.5)#2,629 |
| 58. | 98375 | 4.6% | 12.6%(-8.01)#58 | 18.1%(-13.5)#2,645 |
| 59. | 99328 | 4.7% | 12.6%(-7.91)#59 | 18.1%(-13.4)#2,699 |
| 60. | 99203 | 4.8% | 12.6%(-7.84)#60 | 18.1%(-13.3)#2,749 |
| 61. | 98557 | 4.8% | 12.6%(-7.82)#61 | 18.1%(-13.3)#2,764 |
| 62. | 98686 | 4.9% | 12.6%(-7.77)#62 | 18.1%(-13.2)#2,794 |
| 63. | 98045 | 4.9% | 12.6%(-7.76)#63 | 18.1%(-13.2)#2,805 |
| 64. | 98203 | 4.9% | 12.6%(-7.70)#64 | 18.1%(-13.1)#2,838 |
| 65. | 98072 | 5.2% | 12.6%(-7.44)#65 | 18.1%(-12.9)#3,030 |
| 66. | 99022 | 5.2% | 12.6%(-7.42)#66 | 18.1%(-12.9)#3,039 |
| 67. | 98223 | 5.4% | 12.6%(-7.23)#67 | 18.1%(-12.7)#3,155 |
| 68. | 98802 | 5.4% | 12.6%(-7.21)#68 | 18.1%(-12.7)#3,172 |
| 69. | 98007 | 5.4% | 12.6%(-7.18)#69 | 18.1%(-12.6)#3,194 |
| 70. | 98503 | 5.5% | 12.6%(-7.13)#70 | 18.1%(-12.6)#3,231 |
| 71. | 98831 | 5.5% | 12.6%(-7.11)#71 | 18.1%(-12.6)#3,241 |
| 72. | 98532 | 5.7% | 12.6%(-6.96)#72 | 18.1%(-12.4)#3,354 |
| 73. | 98177 | 5.8% | 12.6%(-6.82)#73 | 18.1%(-12.3)#3,455 |
| 74. | 98858 | 5.8% | 12.6%(-6.80)#74 | 18.1%(-12.2)#3,462 |
| 75. | 98405 | 5.9% | 12.6%(-6.68)#75 | 18.1%(-12.1)#3,556 |
| 76. | 98315 | 6.0% | 12.6%(-6.65)#76 | 18.1%(-12.1)#3,579 |
| 77. | 99016 | 6.0% | 12.6%(-6.59)#77 | 18.1%(-12.0)#3,614 |
| 78. | 98577 | 6.1% | 12.6%(-6.54)#78 | 18.1%(-12.0)#3,649 |
| 79. | 98498 | 6.3% | 12.6%(-6.36)#79 | 18.1%(-11.8)#3,793 |
| 80. | 99224 | 6.5% | 12.6%(-6.15)#80 | 18.1%(-11.6)#3,917 |
| 81. | 98605 | 6.5% | 12.6%(-6.12)#81 | 18.1%(-11.6)#3,930 |
| 82. | 98188 | 6.5% | 12.6%(-6.09)#82 | 18.1%(-11.5)#3,954 |
| 83. | 98506 | 6.6% | 12.6%(-5.97)#83 | 18.1%(-11.4)#4,019 |
| 84. | 98936 | 6.7% | 12.6%(-5.96)#84 | 18.1%(-11.4)#4,022 |
| 85. | 98055 | 6.7% | 12.6%(-5.91)#85 | 18.1%(-11.4)#4,077 |
| 86. | 98512 | 6.8% | 12.6%(-5.83)#86 | 18.1%(-11.3)#4,135 |
| 87. | 99353 | 7.2% | 12.6%(-5.42)#87 | 18.1%(-10.9)#4,417 |
| 88. | 98338 | 7.2% | 12.6%(-5.42)#88 | 18.1%(-10.9)#4,418 |
| 89. | 98229 | 7.3% | 12.6%(-5.36)#89 | 18.1%(-10.8)#4,458 |
| 90. | 98826 | 7.3% | 12.6%(-5.31)#90 | 18.1%(-10.8)#4,480 |
| 91. | 99204 | 7.3% | 12.6%(-5.30)#91 | 18.1%(-10.7)#4,484 |
| 92. | 98027 | 7.3% | 12.6%(-5.30)#92 | 18.1%(-10.7)#4,489 |
| 93. | 98422 | 7.4% | 12.6%(-5.23)#93 | 18.1%(-10.7)#4,534 |
| 94. | 98245 | 7.4% | 12.6%(-5.21)#94 | 18.1%(-10.7)#4,543 |
| 95. | 98036 | 7.4% | 12.6%(-5.21)#95 | 18.1%(-10.7)#4,554 |
| 96. | 98387 | 7.4% | 12.6%(-5.19)#96 | 18.1%(-10.6)#4,561 |
| 97. | 98601 | 7.5% | 12.6%(-5.10)#97 | 18.1%(-10.5)#4,611 |
| 98. | 98264 | 7.5% | 12.6%(-5.07)#98 | 18.1%(-10.5)#4,625 |
| 99. | 98230 | 7.5% | 12.6%(-5.07)#99 | 18.1%(-10.5)#4,629 |
| 100. | 99362 | 7.6% | 12.6%(-5.03)#100 | 18.1%(-10.5)#4,663 |
Common Questions
What are the Top 10 Zip Codes with the Lowest Poverty Level Among Children Under the Age of 5 in Washington?
Top 10 Zip Codes with the Lowest Poverty Level Among Children Under the Age of 5 in Washington are:
What zip code has the Lowest Poverty Level Among Children Under the Age of 5 in Washington?
98642 has the Lowest Poverty Level Among Children Under the Age of 5 in Washington with 0.16%.
What is the Poverty Level Among Children Under the Age of 5 in the State of Washington?
Poverty Level Among Children Under the Age of 5 in Washington is 12.6%.
What is the Poverty Level Among Children Under the Age of 5 in the United States?
Poverty Level Among Children Under the Age of 5 in the United States is 18.1%.