Cities with the Lowest Poverty Level Among Children Under the Age of 5 in West Virginia
RELATED REPORTS & OPTIONS
Lowest Poverty | Child 0-5
West Virginia
Compare Cities
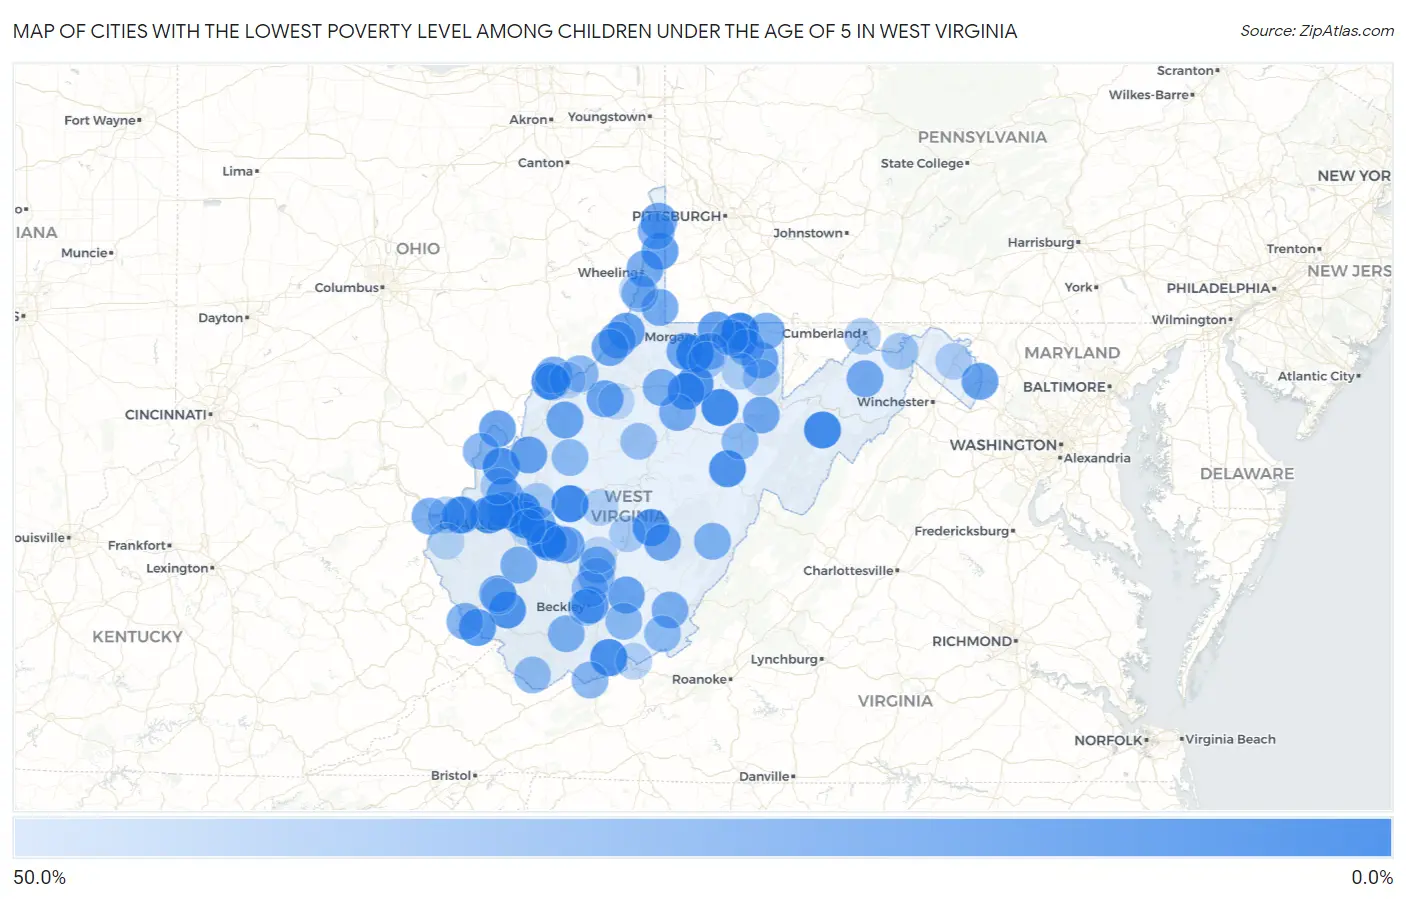
Map of Cities with the Lowest Poverty Level Among Children Under the Age of 5 in West Virginia
50.0%
0.0%
Cities with the Lowest Poverty Level Among Children Under the Age of 5 in West Virginia
| City | Child Poverty | vs State | vs National | |
| 1. | Marmet | 1.5% | 25.5%(-23.9)#1 | 18.1%(-16.5)#212 |
| 2. | Nitro | 1.6% | 25.5%(-23.9)#2 | 18.1%(-16.4)#232 |
| 3. | Farmington | 2.0% | 25.5%(-23.4)#3 | 18.1%(-16.0)#358 |
| 4. | Cheat Lake | 2.5% | 25.5%(-23.0)#4 | 18.1%(-15.5)#518 |
| 5. | Clendenin | 4.4% | 25.5%(-21.1)#5 | 18.1%(-13.6)#1,306 |
| 6. | Petersburg | 4.8% | 25.5%(-20.7)#6 | 18.1%(-13.2)#1,494 |
| 7. | Philippi | 5.3% | 25.5%(-20.2)#7 | 18.1%(-12.8)#1,678 |
| 8. | Vienna | 5.4% | 25.5%(-20.0)#8 | 18.1%(-12.6)#1,762 |
| 9. | Brookhaven | 5.9% | 25.5%(-19.6)#9 | 18.1%(-12.2)#1,930 |
| 10. | Cross Lanes | 6.8% | 25.5%(-18.6)#10 | 18.1%(-11.2)#2,345 |
| 11. | Athens | 7.1% | 25.5%(-18.3)#11 | 18.1%(-10.9)#2,484 |
| 12. | Culloden | 7.6% | 25.5%(-17.9)#12 | 18.1%(-10.5)#2,666 |
| 13. | Dunbar | 8.0% | 25.5%(-17.5)#13 | 18.1%(-10.1)#2,812 |
| 14. | Bridgeport | 8.5% | 25.5%(-17.0)#14 | 18.1%(-9.56)#3,036 |
| 15. | Leon | 8.6% | 25.5%(-16.9)#15 | 18.1%(-9.49)#3,076 |
| 16. | Mill Creek | 9.1% | 25.5%(-16.4)#16 | 18.1%(-8.97)#3,287 |
| 17. | Craigsville | 9.9% | 25.5%(-15.6)#17 | 18.1%(-8.15)#3,610 |
| 18. | Man | 10.1% | 25.5%(-15.4)#18 | 18.1%(-7.94)#3,713 |
| 19. | Nutter Fort | 11.1% | 25.5%(-14.4)#19 | 18.1%(-6.95)#4,074 |
| 20. | Beckley | 12.6% | 25.5%(-12.9)#20 | 18.1%(-5.45)#4,695 |
| 21. | Matewan | 13.8% | 25.5%(-11.7)#21 | 18.1%(-4.27)#5,133 |
| 22. | Barboursville | 14.0% | 25.5%(-11.5)#22 | 18.1%(-4.07)#5,213 |
| 23. | Bethany | 15.6% | 25.5%(-9.86)#23 | 18.1%(-2.44)#5,809 |
| 24. | Cassville | 16.3% | 25.5%(-9.23)#24 | 18.1%(-1.80)#6,015 |
| 25. | New Martinsville | 16.5% | 25.5%(-8.96)#25 | 18.1%(-1.53)#6,103 |
| 26. | Eleanor | 16.7% | 25.5%(-8.82)#26 | 18.1%(-1.40)#6,140 |
| 27. | Teays Valley | 16.7% | 25.5%(-8.79)#27 | 18.1%(-1.37)#6,209 |
| 28. | Bolivar | 17.1% | 25.5%(-8.41)#28 | 18.1%(-0.990)#6,306 |
| 29. | Ripley | 17.2% | 25.5%(-8.31)#29 | 18.1%(-0.885)#6,330 |
| 30. | Pratt | 17.2% | 25.5%(-8.24)#30 | 18.1%(-0.821)#6,355 |
| 31. | Hartford City | 17.4% | 25.5%(-8.09)#31 | 18.1%(-0.671)#6,408 |
| 32. | Kingwood | 17.5% | 25.5%(-7.98)#32 | 18.1%(-0.553)#6,453 |
| 33. | Paden City | 17.8% | 25.5%(-7.64)#33 | 18.1%(-0.220)#6,559 |
| 34. | Meadow Bridge | 17.9% | 25.5%(-7.63)#34 | 18.1%(-0.206)#6,573 |
| 35. | Harrisville | 17.9% | 25.5%(-7.54)#35 | 18.1%(-0.114)#6,595 |
| 36. | Elizabeth | 18.3% | 25.5%(-7.15)#36 | 18.1%(+0.271)#6,730 |
| 37. | Mannington | 19.0% | 25.5%(-6.44)#37 | 18.1%(+0.985)#6,946 |
| 38. | Hurricane | 19.5% | 25.5%(-6.04)#38 | 18.1%(+1.39)#7,088 |
| 39. | Weirton | 19.5% | 25.5%(-5.96)#39 | 18.1%(+1.46)#7,110 |
| 40. | Sistersville | 20.0% | 25.5%(-5.49)#40 | 18.1%(+1.94)#7,238 |
| 41. | Belle | 20.3% | 25.5%(-5.15)#41 | 18.1%(+2.28)#7,369 |
| 42. | Richwood | 20.4% | 25.5%(-5.08)#42 | 18.1%(+2.35)#7,388 |
| 43. | Parsons | 20.7% | 25.5%(-4.80)#43 | 18.1%(+2.63)#7,478 |
| 44. | Romney | 20.9% | 25.5%(-4.56)#44 | 18.1%(+2.87)#7,538 |
| 45. | West Logan | 21.2% | 25.5%(-4.27)#45 | 18.1%(+3.15)#7,635 |
| 46. | Kenova | 21.7% | 25.5%(-3.83)#46 | 18.1%(+3.59)#7,784 |
| 47. | Wheeling | 21.7% | 25.5%(-3.76)#47 | 18.1%(+3.67)#7,804 |
| 48. | Jane Lew | 21.9% | 25.5%(-3.61)#48 | 18.1%(+3.81)#7,860 |
| 49. | Cameron | 22.2% | 25.5%(-3.26)#49 | 18.1%(+4.16)#7,962 |
| 50. | Salem | 23.1% | 25.5%(-2.41)#50 | 18.1%(+5.01)#8,205 |
| 51. | Ronceverte | 23.2% | 25.5%(-2.30)#51 | 18.1%(+5.13)#8,260 |
| 52. | Fayetteville | 23.2% | 25.5%(-2.27)#52 | 18.1%(+5.15)#8,266 |
| 53. | Chesapeake | 23.2% | 25.5%(-2.27)#53 | 18.1%(+5.15)#8,269 |
| 54. | Charleston | 23.5% | 25.5%(-1.96)#54 | 18.1%(+5.46)#8,335 |
| 55. | Boaz | 23.7% | 25.5%(-1.76)#55 | 18.1%(+5.67)#8,407 |
| 56. | Madison | 23.9% | 25.5%(-1.63)#56 | 18.1%(+5.80)#8,452 |
| 57. | Mullens | 24.5% | 25.5%(-0.996)#57 | 18.1%(+6.43)#8,603 |
| 58. | Williamson | 24.8% | 25.5%(-0.733)#58 | 18.1%(+6.69)#8,671 |
| 59. | Marlinton | 25.0% | 25.5%(-0.486)#59 | 18.1%(+6.94)#8,736 |
| 60. | Brandonville | 25.0% | 25.5%(-0.486)#60 | 18.1%(+6.94)#8,802 |
| 61. | Follansbee | 25.5% | 25.5%(+0.004)#61 | 18.1%(+7.43)#8,908 |
| 62. | Rivesville | 26.3% | 25.5%(+0.830)#62 | 18.1%(+8.25)#9,099 |
| 63. | Ranson Corporation | 26.6% | 25.5%(+1.10)#63 | 18.1%(+8.52)#9,152 |
| 64. | Point Pleasant | 27.3% | 25.5%(+1.79)#64 | 18.1%(+9.21)#9,311 |
| 65. | Bluefield | 27.4% | 25.5%(+1.92)#65 | 18.1%(+9.34)#9,379 |
| 66. | Belmont | 28.0% | 25.5%(+2.51)#66 | 18.1%(+9.94)#9,517 |
| 67. | Pea Ridge | 28.4% | 25.5%(+2.96)#67 | 18.1%(+10.4)#9,615 |
| 68. | Hinton | 28.8% | 25.5%(+3.33)#68 | 18.1%(+10.8)#9,742 |
| 69. | Moundsville | 29.0% | 25.5%(+3.53)#69 | 18.1%(+11.0)#9,792 |
| 70. | Elkins | 29.4% | 25.5%(+3.88)#70 | 18.1%(+11.3)#9,862 |
| 71. | Union | 29.4% | 25.5%(+3.93)#71 | 18.1%(+11.3)#9,873 |
| 72. | Spencer | 29.6% | 25.5%(+4.14)#72 | 18.1%(+11.6)#9,924 |
| 73. | Oak Hill | 30.5% | 25.5%(+5.04)#73 | 18.1%(+12.5)#10,141 |
| 74. | War | 30.8% | 25.5%(+5.28)#74 | 18.1%(+12.7)#10,190 |
| 75. | Masontown | 30.8% | 25.5%(+5.28)#75 | 18.1%(+12.7)#10,194 |
| 76. | Mount Hope | 31.2% | 25.5%(+5.76)#76 | 18.1%(+13.2)#10,292 |
| 77. | Sand Fork | 33.3% | 25.5%(+7.85)#77 | 18.1%(+15.3)#10,784 |
| 78. | Paw Paw | 35.3% | 25.5%(+9.81)#78 | 18.1%(+17.2)#11,101 |
| 79. | Fairmont | 35.8% | 25.5%(+10.3)#79 | 18.1%(+17.8)#11,221 |
| 80. | Rowlesburg | 36.4% | 25.5%(+10.9)#80 | 18.1%(+18.3)#11,315 |
| 81. | Mabscott | 36.9% | 25.5%(+11.4)#81 | 18.1%(+18.8)#11,412 |
| 82. | Sissonville | 37.3% | 25.5%(+11.8)#82 | 18.1%(+19.3)#11,483 |
| 83. | Carpendale | 38.5% | 25.5%(+13.0)#83 | 18.1%(+20.4)#11,676 |
| 84. | Buffalo | 38.7% | 25.5%(+13.2)#84 | 18.1%(+20.6)#11,713 |
| 85. | Summersville | 38.9% | 25.5%(+13.4)#85 | 18.1%(+20.8)#11,741 |
| 86. | Martinsburg | 39.4% | 25.5%(+13.9)#86 | 18.1%(+21.3)#11,822 |
| 87. | Huntington | 39.9% | 25.5%(+14.4)#87 | 18.1%(+21.8)#11,900 |
| 88. | Newburg | 40.0% | 25.5%(+14.5)#88 | 18.1%(+21.9)#11,966 |
| 89. | Peterstown | 40.5% | 25.5%(+15.1)#89 | 18.1%(+22.5)#12,041 |
| 90. | East Bank | 40.7% | 25.5%(+15.3)#90 | 18.1%(+22.7)#12,071 |
| 91. | Clay | 40.7% | 25.5%(+15.3)#91 | 18.1%(+22.7)#12,072 |
| 92. | Morgantown | 41.2% | 25.5%(+15.7)#92 | 18.1%(+23.1)#12,117 |
| 93. | Glen Dale | 41.3% | 25.5%(+15.8)#93 | 18.1%(+23.2)#12,143 |
| 94. | Waverly | 42.4% | 25.5%(+16.9)#94 | 18.1%(+24.4)#12,307 |
| 95. | Logan | 42.6% | 25.5%(+17.1)#95 | 18.1%(+24.5)#12,320 |
| 96. | Wayne | 42.9% | 25.5%(+17.4)#96 | 18.1%(+24.8)#12,348 |
| 97. | Pullman | 42.9% | 25.5%(+17.4)#97 | 18.1%(+24.8)#12,377 |
| 98. | South Charleston | 42.9% | 25.5%(+17.4)#98 | 18.1%(+24.8)#12,392 |
| 99. | Ansted | 43.3% | 25.5%(+17.8)#99 | 18.1%(+25.3)#12,445 |
| 100. | North Hills | 43.6% | 25.5%(+18.2)#100 | 18.1%(+25.6)#12,486 |
Common Questions
What are the Top 10 Cities with the Lowest Poverty Level Among Children Under the Age of 5 in West Virginia?
Top 10 Cities with the Lowest Poverty Level Among Children Under the Age of 5 in West Virginia are:
#1
1.5%
#2
1.6%
#3
2.0%
#4
2.5%
#5
4.4%
#6
4.8%
#7
5.3%
#8
5.4%
#9
5.9%
#10
6.8%
What city has the Lowest Poverty Level Among Children Under the Age of 5 in West Virginia?
Marmet has the Lowest Poverty Level Among Children Under the Age of 5 in West Virginia with 1.5%.
What is the Poverty Level Among Children Under the Age of 5 in the State of West Virginia?
Poverty Level Among Children Under the Age of 5 in West Virginia is 25.5%.
What is the Poverty Level Among Children Under the Age of 5 in the United States?
Poverty Level Among Children Under the Age of 5 in the United States is 18.1%.