Artondale, WA Map & Demographics
Artondale Map
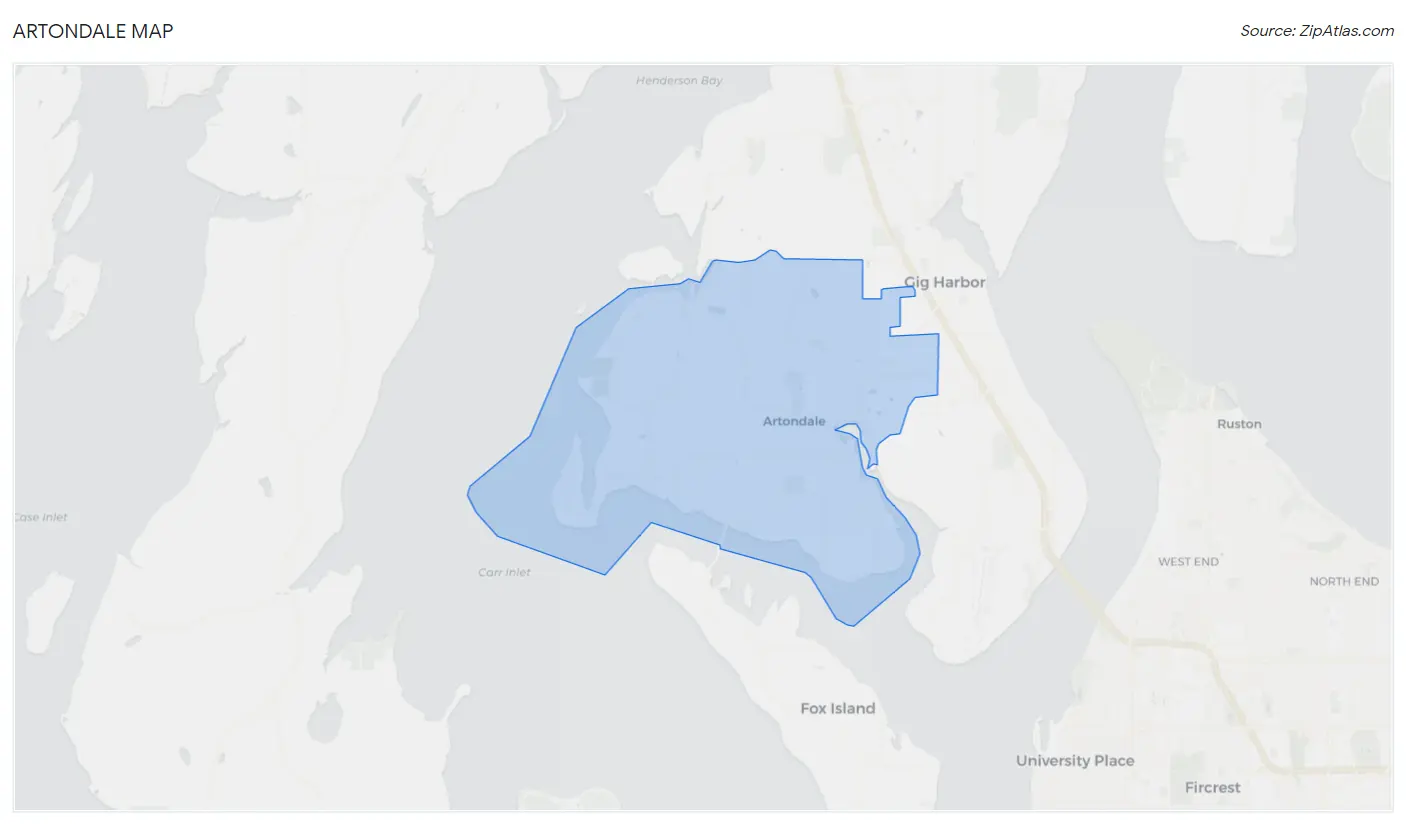
Artondale Overview
$65,599
PER CAPITA INCOME
$156,554
AVG FAMILY INCOME
$148,125
AVG HOUSEHOLD INCOME
35.1%
WAGE / INCOME GAP [ % ]
64.9¢/ $1
WAGE / INCOME GAP [ $ ]
0.40
INEQUALITY / GINI INDEX
13,862
TOTAL POPULATION
6,994
MALE POPULATION
6,868
FEMALE POPULATION
101.83
MALES / 100 FEMALES
98.20
FEMALES / 100 MALES
42.2
MEDIAN AGE
3.0
AVG FAMILY SIZE
2.7
AVG HOUSEHOLD SIZE
6,635
LABOR FORCE [ PEOPLE ]
61.4%
PERCENT IN LABOR FORCE
2.4%
UNEMPLOYMENT RATE
Income in Artondale
Income Overview in Artondale
Per Capita Income in Artondale is $65,599, while median incomes of families and households are $156,554 and $148,125 respectively.
| Characteristic | Number | Measure |
| Per Capita Income | 13,862 | $65,599 |
| Median Family Income | 4,224 | $156,554 |
| Mean Family Income | 4,224 | $193,306 |
| Median Household Income | 5,098 | $148,125 |
| Mean Household Income | 5,098 | $179,101 |
| Income Deficit | 4,224 | $0 |
| Wage / Income Gap (%) | 13,862 | 35.06% |
| Wage / Income Gap ($) | 13,862 | 64.94¢ per $1 |
| Gini / Inequality Index | 13,862 | 0.40 |
Earnings by Sex in Artondale
Average Earnings in Artondale are $76,864, $89,950 for men and $58,417 for women, a difference of 35.1%.
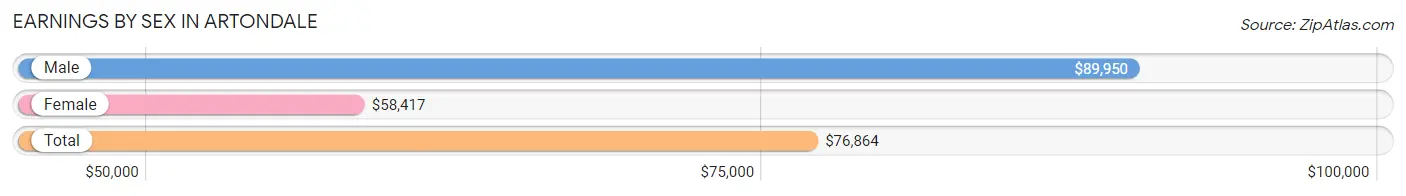
| Sex | Number | Average Earnings |
| Male | 3,712 (53.1%) | $89,950 |
| Female | 3,272 (46.9%) | $58,417 |
| Total | 6,984 (100.0%) | $76,864 |
Earnings by Sex by Income Bracket in Artondale
The most common earnings brackets in Artondale are $100,000+ for men (1,723 | 46.4%) and $100,000+ for women (1,030 | 31.5%).
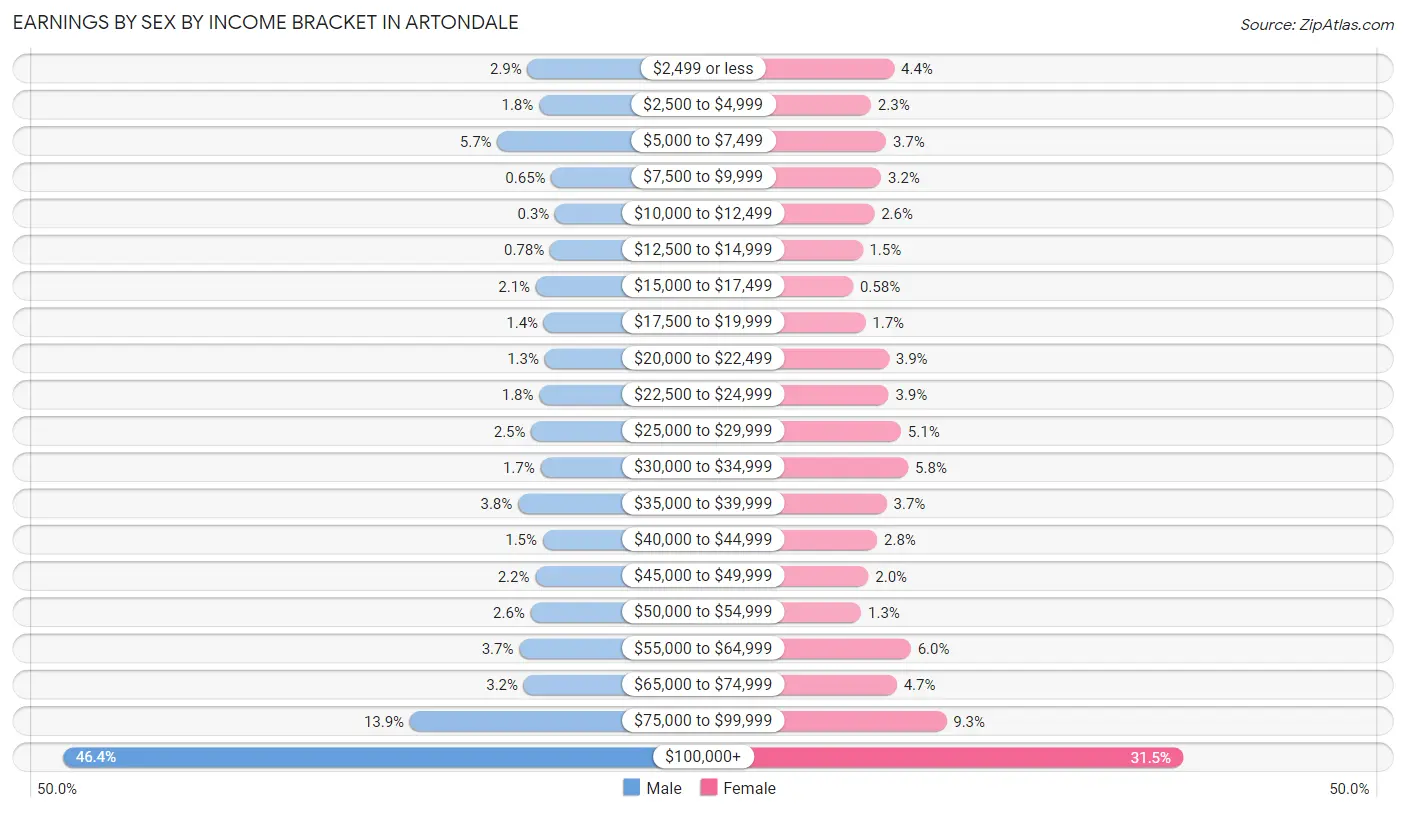
| Income | Male | Female |
| $2,499 or less | 107 (2.9%) | 145 (4.4%) |
| $2,500 to $4,999 | 67 (1.8%) | 74 (2.3%) |
| $5,000 to $7,499 | 212 (5.7%) | 120 (3.7%) |
| $7,500 to $9,999 | 24 (0.6%) | 105 (3.2%) |
| $10,000 to $12,499 | 11 (0.3%) | 84 (2.6%) |
| $12,500 to $14,999 | 29 (0.8%) | 48 (1.5%) |
| $15,000 to $17,499 | 78 (2.1%) | 19 (0.6%) |
| $17,500 to $19,999 | 50 (1.3%) | 57 (1.7%) |
| $20,000 to $22,499 | 47 (1.3%) | 129 (3.9%) |
| $22,500 to $24,999 | 66 (1.8%) | 128 (3.9%) |
| $25,000 to $29,999 | 94 (2.5%) | 166 (5.1%) |
| $30,000 to $34,999 | 62 (1.7%) | 188 (5.8%) |
| $35,000 to $39,999 | 140 (3.8%) | 122 (3.7%) |
| $40,000 to $44,999 | 54 (1.5%) | 93 (2.8%) |
| $45,000 to $49,999 | 80 (2.2%) | 66 (2.0%) |
| $50,000 to $54,999 | 96 (2.6%) | 44 (1.3%) |
| $55,000 to $64,999 | 136 (3.7%) | 196 (6.0%) |
| $65,000 to $74,999 | 120 (3.2%) | 153 (4.7%) |
| $75,000 to $99,999 | 516 (13.9%) | 305 (9.3%) |
| $100,000+ | 1,723 (46.4%) | 1,030 (31.5%) |
| Total | 3,712 (100.0%) | 3,272 (100.0%) |
Earnings by Sex by Educational Attainment in Artondale
Average earnings in Artondale are $103,013 for men and $68,204 for women, a difference of 33.8%. Men with an educational attainment of graduate degree enjoy the highest average annual earnings of $159,190, while those with high school diploma education earn the least with $78,456. Women with an educational attainment of bachelor's degree earn the most with the average annual earnings of $94,219, while those with high school diploma education have the smallest earnings of $25,568.
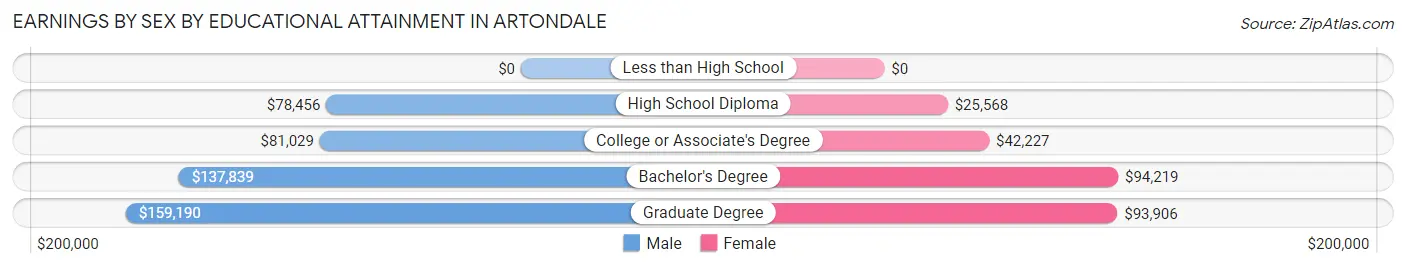
| Educational Attainment | Male Income | Female Income |
| Less than High School | - | - |
| High School Diploma | $78,456 | $25,568 |
| College or Associate's Degree | $81,029 | $42,227 |
| Bachelor's Degree | $137,839 | $94,219 |
| Graduate Degree | $159,190 | $93,906 |
| Total | $103,013 | $68,204 |
Family Income in Artondale
Family Income Brackets in Artondale
According to the Artondale family income data, there are 1,453 families falling into the $200,000+ income range, which is the most common income bracket and makes up 34.4% of all families.
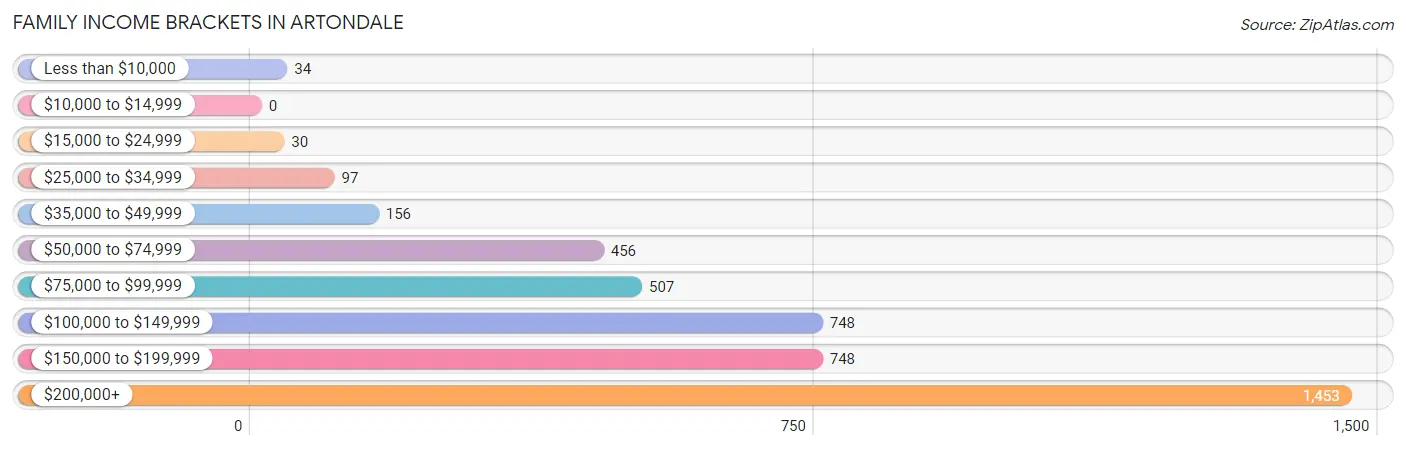
| Income Bracket | # Families | % Families |
| Less than $10,000 | 34 | 0.8% |
| $10,000 to $14,999 | 0 | 0.0% |
| $15,000 to $24,999 | 30 | 0.7% |
| $25,000 to $34,999 | 97 | 2.3% |
| $35,000 to $49,999 | 156 | 3.7% |
| $50,000 to $74,999 | 456 | 10.8% |
| $75,000 to $99,999 | 507 | 12.0% |
| $100,000 to $149,999 | 748 | 17.7% |
| $150,000 to $199,999 | 748 | 17.7% |
| $200,000+ | 1,453 | 34.4% |
Family Income by Famaliy Size in Artondale
6-person families (75 | 1.8%) account for the highest median family income in Artondale with $228,359 per family, while 2-person families (2,003 | 47.4%) have the highest median income of $59,056 per family member.
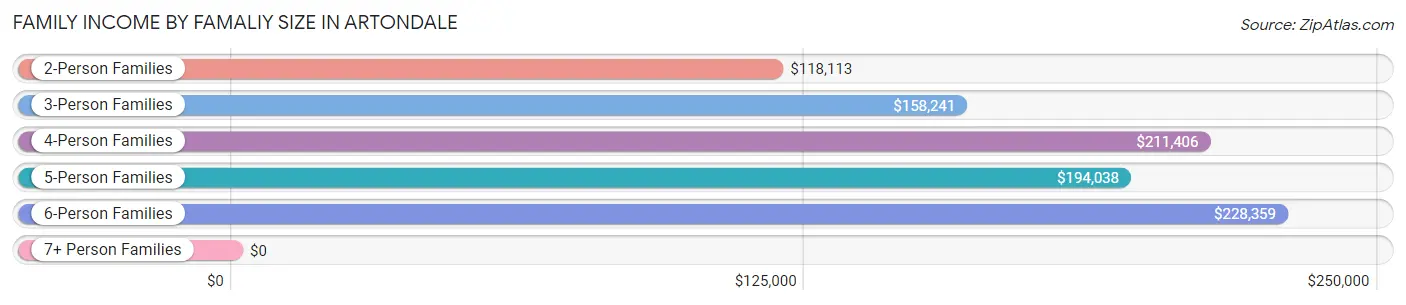
| Income Bracket | # Families | Median Income |
| 2-Person Families | 2,003 (47.4%) | $118,113 |
| 3-Person Families | 1,058 (25.1%) | $158,241 |
| 4-Person Families | 715 (16.9%) | $211,406 |
| 5-Person Families | 262 (6.2%) | $194,038 |
| 6-Person Families | 75 (1.8%) | $228,359 |
| 7+ Person Families | 111 (2.6%) | $0 |
| Total | 4,224 (100.0%) | $156,554 |
Family Income by Number of Earners in Artondale
The median family income in Artondale is $156,554, with families comprising 3+ earners (330) having the highest median family income of $224,091, while families with no earners (639) have the lowest median family income of $95,139, accounting for 7.8% and 15.1% of families, respectively.
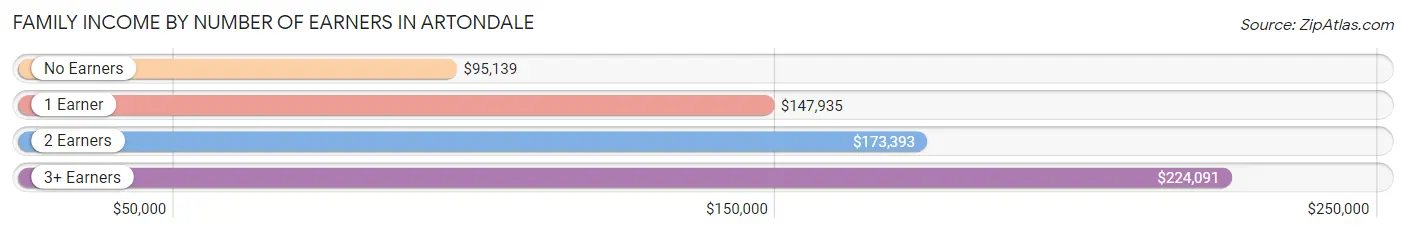
| Number of Earners | # Families | Median Income |
| No Earners | 639 (15.1%) | $95,139 |
| 1 Earner | 1,318 (31.2%) | $147,935 |
| 2 Earners | 1,937 (45.9%) | $173,393 |
| 3+ Earners | 330 (7.8%) | $224,091 |
| Total | 4,224 (100.0%) | $156,554 |
Household Income in Artondale
Household Income Brackets in Artondale
With 1,499 households falling in the category, the $200,000+ income range is the most frequent in Artondale, accounting for 29.4% of all households. In contrast, only 10 households (0.2%) fall into the $10,000 to $14,999 income bracket, making it the least populous group.
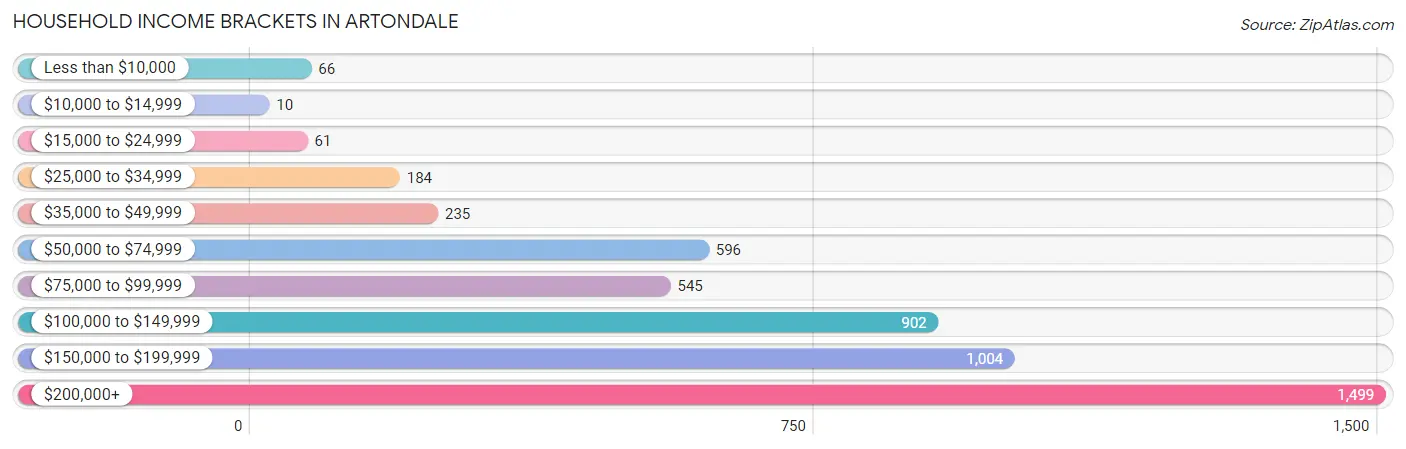
| Income Bracket | # Households | % Households |
| Less than $10,000 | 66 | 1.3% |
| $10,000 to $14,999 | 10 | 0.2% |
| $15,000 to $24,999 | 61 | 1.2% |
| $25,000 to $34,999 | 184 | 3.6% |
| $35,000 to $49,999 | 235 | 4.6% |
| $50,000 to $74,999 | 596 | 11.7% |
| $75,000 to $99,999 | 545 | 10.7% |
| $100,000 to $149,999 | 902 | 17.7% |
| $150,000 to $199,999 | 1,004 | 19.7% |
| $200,000+ | 1,499 | 29.4% |
Household Income by Householder Age in Artondale
The median household income in Artondale is $148,125, with the highest median household income of $159,738 found in the 45 to 64 years age bracket for the primary householder. A total of 2,037 households (40.0%) fall into this category. Meanwhile, the 65+ years age bracket for the primary householder has the lowest median household income of $100,156, with 1,559 households (30.6%) in this group.
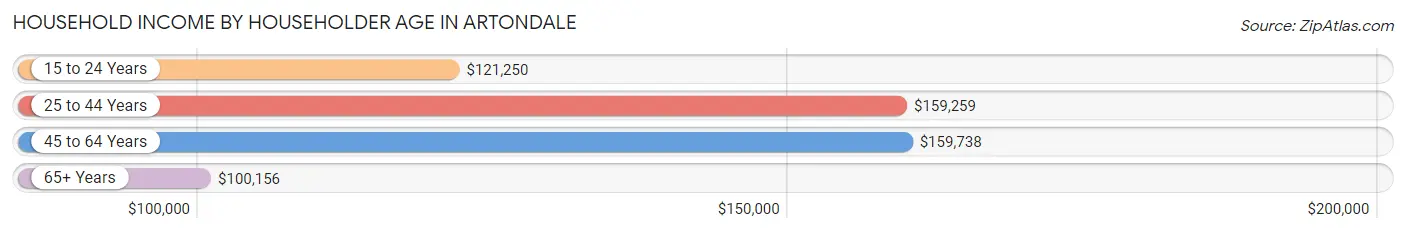
| Income Bracket | # Households | Median Income |
| 15 to 24 Years | 50 (1.0%) | $121,250 |
| 25 to 44 Years | 1,452 (28.5%) | $159,259 |
| 45 to 64 Years | 2,037 (40.0%) | $159,738 |
| 65+ Years | 1,559 (30.6%) | $100,156 |
| Total | 5,098 (100.0%) | $148,125 |
Poverty in Artondale
Income Below Poverty by Sex and Age in Artondale
With 2.0% poverty level for males and 1.9% for females among the residents of Artondale, 16 and 17 year old males and 15 year old females are the most vulnerable to poverty, with 13 males (5.4%) and 21 females (13.2%) in their respective age groups living below the poverty level.
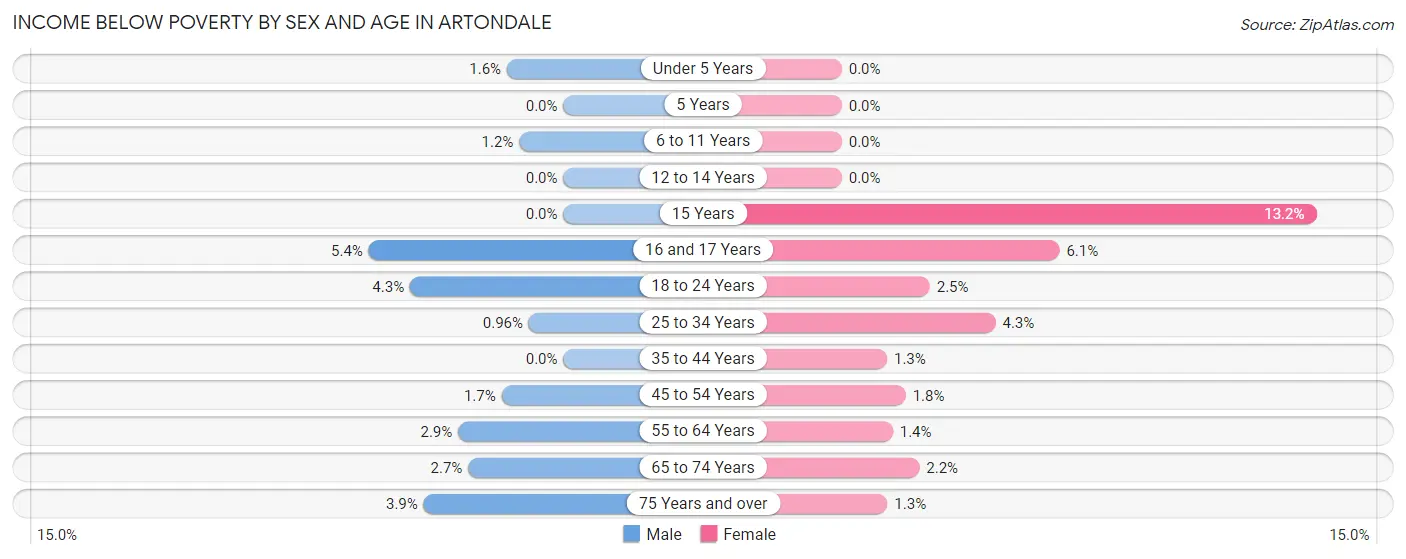
| Age Bracket | Male | Female |
| Under 5 Years | 8 (1.6%) | 0 (0.0%) |
| 5 Years | 0 (0.0%) | 0 (0.0%) |
| 6 to 11 Years | 9 (1.2%) | 0 (0.0%) |
| 12 to 14 Years | 0 (0.0%) | 0 (0.0%) |
| 15 Years | 0 (0.0%) | 21 (13.2%) |
| 16 and 17 Years | 13 (5.4%) | 10 (6.1%) |
| 18 to 24 Years | 18 (4.3%) | 9 (2.5%) |
| 25 to 34 Years | 6 (1.0%) | 22 (4.3%) |
| 35 to 44 Years | 0 (0.0%) | 14 (1.3%) |
| 45 to 54 Years | 18 (1.7%) | 17 (1.8%) |
| 55 to 64 Years | 27 (2.9%) | 14 (1.4%) |
| 65 to 74 Years | 23 (2.6%) | 18 (2.2%) |
| 75 Years and over | 16 (3.9%) | 6 (1.3%) |
| Total | 138 (2.0%) | 131 (1.9%) |
Income Above Poverty by Sex and Age in Artondale
According to the poverty statistics in Artondale, males aged 5 years and females aged under 5 years are the age groups that are most secure financially, with 100.0% of males and 100.0% of females in these age groups living above the poverty line.
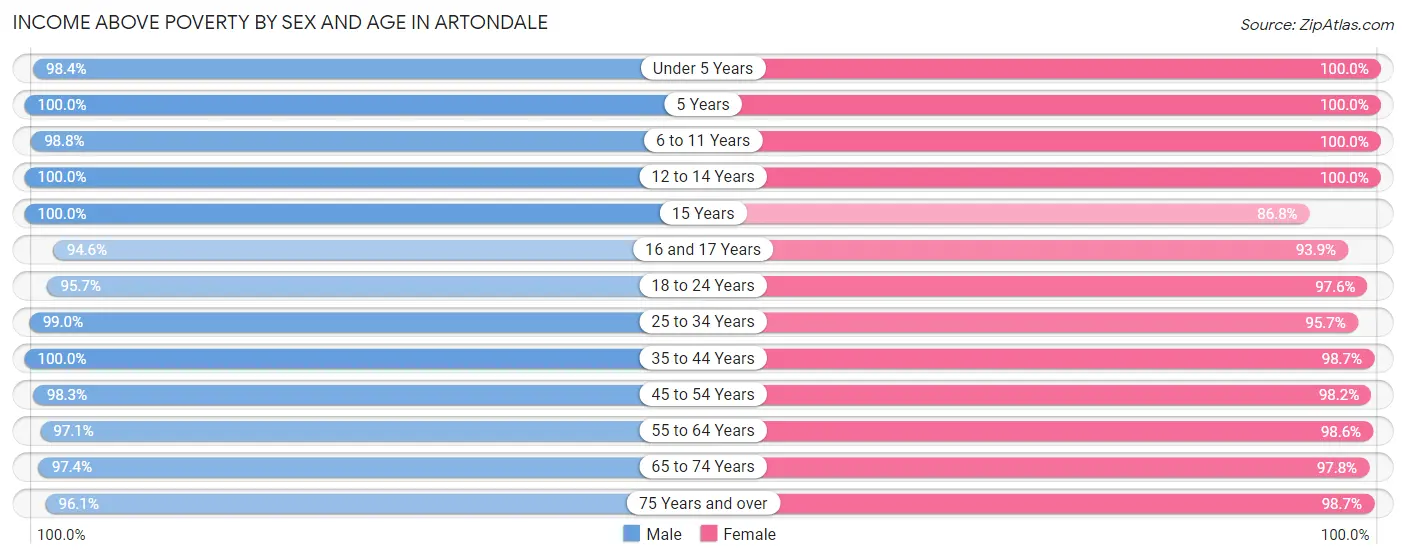
| Age Bracket | Male | Female |
| Under 5 Years | 501 (98.4%) | 350 (100.0%) |
| 5 Years | 68 (100.0%) | 197 (100.0%) |
| 6 to 11 Years | 720 (98.8%) | 579 (100.0%) |
| 12 to 14 Years | 185 (100.0%) | 161 (100.0%) |
| 15 Years | 101 (100.0%) | 138 (86.8%) |
| 16 and 17 Years | 227 (94.6%) | 155 (93.9%) |
| 18 to 24 Years | 404 (95.7%) | 358 (97.6%) |
| 25 to 34 Years | 620 (99.0%) | 492 (95.7%) |
| 35 to 44 Years | 869 (100.0%) | 1,099 (98.7%) |
| 45 to 54 Years | 1,029 (98.3%) | 939 (98.2%) |
| 55 to 64 Years | 893 (97.1%) | 969 (98.6%) |
| 65 to 74 Years | 844 (97.4%) | 815 (97.8%) |
| 75 Years and over | 395 (96.1%) | 466 (98.7%) |
| Total | 6,856 (98.0%) | 6,718 (98.1%) |
Income Below Poverty Among Married-Couple Families in Artondale
The poverty statistics for married-couple families in Artondale show that 0.2% or 9 of the total 3,780 families live below the poverty line. Families with 1 or 2 children have the highest poverty rate of 0.7%, comprising of 9 families. On the other hand, families with no children have the lowest poverty rate of 0.0%, which includes 0 families.
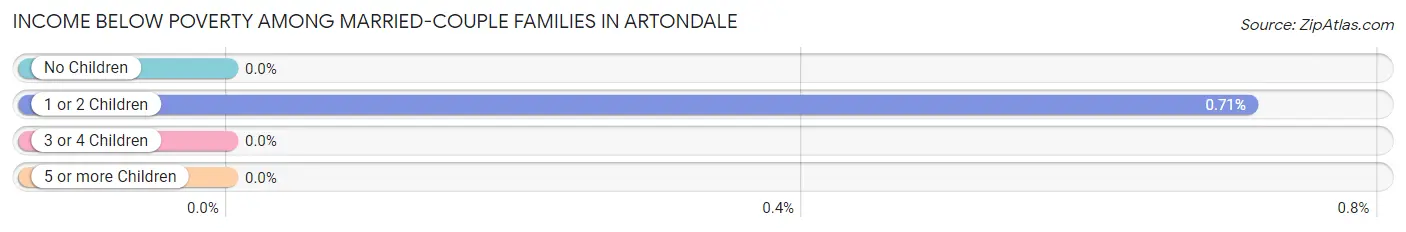
| Children | Above Poverty | Below Poverty |
| No Children | 2,136 (100.0%) | 0 (0.0%) |
| 1 or 2 Children | 1,255 (99.3%) | 9 (0.7%) |
| 3 or 4 Children | 269 (100.0%) | 0 (0.0%) |
| 5 or more Children | 111 (100.0%) | 0 (0.0%) |
| Total | 3,771 (99.8%) | 9 (0.2%) |
Income Below Poverty Among Single-Parent Households in Artondale
According to the poverty data in Artondale, 12.3% or 14 single-father households and 3.0% or 10 single-mother households are living below the poverty line. Among single-father households, those with 1 or 2 children have the highest poverty rate, with 14 households (21.5%) experiencing poverty. Likewise, among single-mother households, those with 1 or 2 children have the highest poverty rate, with 10 households (15.9%) falling below the poverty line.
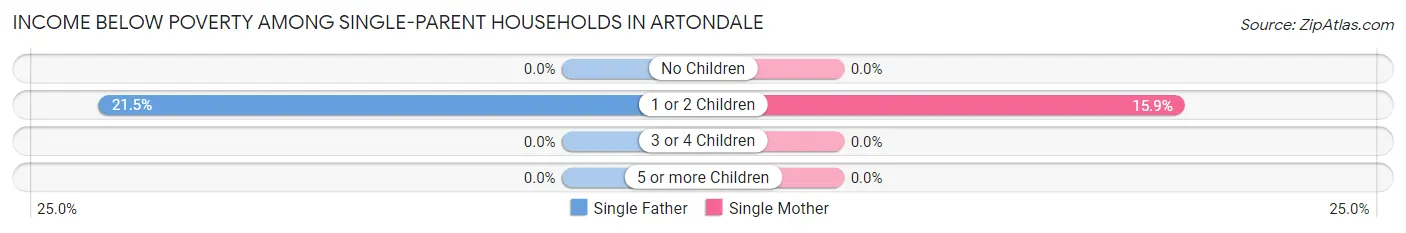
| Children | Single Father | Single Mother |
| No Children | 0 (0.0%) | 0 (0.0%) |
| 1 or 2 Children | 14 (21.5%) | 10 (15.9%) |
| 3 or 4 Children | 0 (0.0%) | 0 (0.0%) |
| 5 or more Children | 0 (0.0%) | 0 (0.0%) |
| Total | 14 (12.3%) | 10 (3.0%) |
Income Below Poverty Among Married-Couple vs Single-Parent Households in Artondale
The poverty data for Artondale shows that 9 of the married-couple family households (0.2%) and 24 of the single-parent households (5.4%) are living below the poverty level. Within the married-couple family households, those with 1 or 2 children have the highest poverty rate, with 9 households (0.7%) falling below the poverty line. Among the single-parent households, those with 1 or 2 children have the highest poverty rate, with 24 household (18.8%) living below poverty.
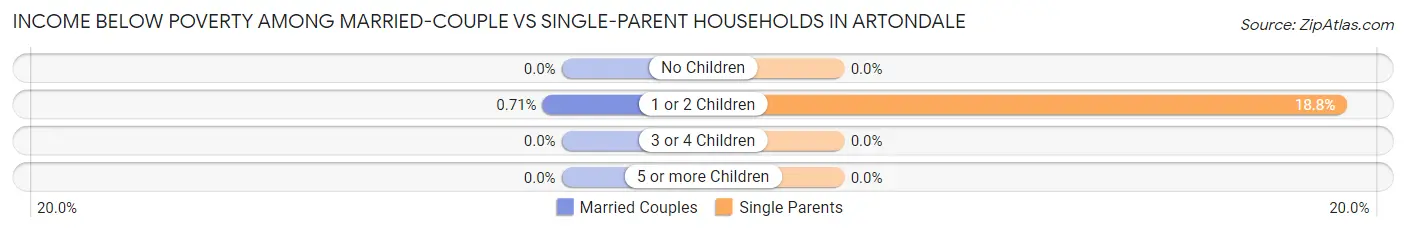
| Children | Married-Couple Families | Single-Parent Households |
| No Children | 0 (0.0%) | 0 (0.0%) |
| 1 or 2 Children | 9 (0.7%) | 24 (18.8%) |
| 3 or 4 Children | 0 (0.0%) | 0 (0.0%) |
| 5 or more Children | 0 (0.0%) | 0 (0.0%) |
| Total | 9 (0.2%) | 24 (5.4%) |
Race in Artondale
The most populous races in Artondale are White / Caucasian (11,475 | 82.8%), Two or more Races (1,628 | 11.7%), and Hispanic or Latino (1,195 | 8.6%).
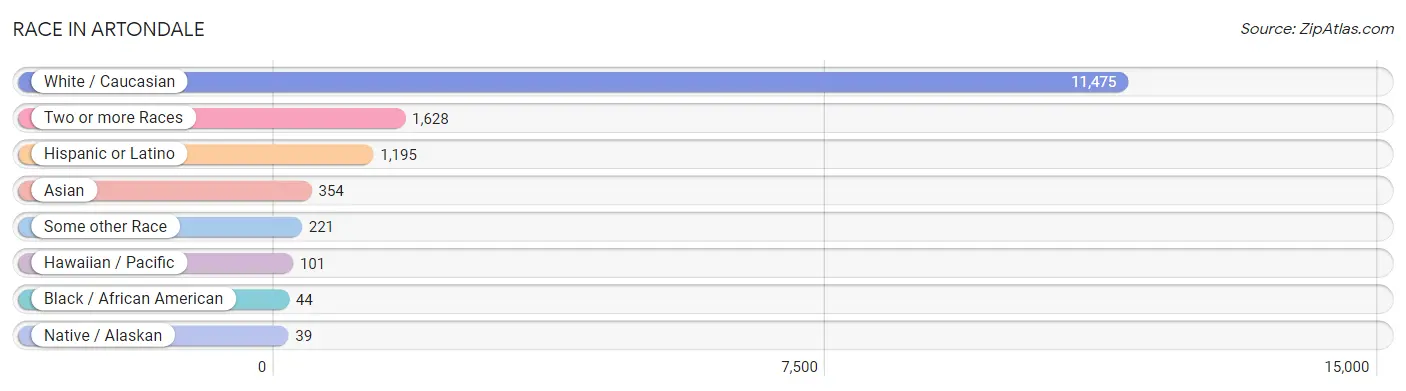
| Race | # Population | % Population |
| Asian | 354 | 2.5% |
| Black / African American | 44 | 0.3% |
| Hawaiian / Pacific | 101 | 0.7% |
| Hispanic or Latino | 1,195 | 8.6% |
| Native / Alaskan | 39 | 0.3% |
| White / Caucasian | 11,475 | 82.8% |
| Two or more Races | 1,628 | 11.7% |
| Some other Race | 221 | 1.6% |
| Total | 13,862 | 100.0% |
Ancestry in Artondale
The most populous ancestries reported in Artondale are German (2,290 | 16.5%), English (1,992 | 14.4%), European (1,613 | 11.6%), Irish (1,357 | 9.8%), and Norwegian (883 | 6.4%), together accounting for 58.7% of all Artondale residents.
| Ancestry | # Population | % Population |
| African | 76 | 0.5% |
| Alaska Native | 1 | 0.0% |
| American | 431 | 3.1% |
| Apache | 9 | 0.1% |
| Arab | 67 | 0.5% |
| Argentinean | 17 | 0.1% |
| Belgian | 6 | 0.0% |
| Bhutanese | 76 | 0.5% |
| Blackfeet | 20 | 0.1% |
| Bolivian | 11 | 0.1% |
| Brazilian | 31 | 0.2% |
| British | 137 | 1.0% |
| Burmese | 257 | 1.8% |
| Canadian | 52 | 0.4% |
| Central American | 64 | 0.5% |
| Cherokee | 36 | 0.3% |
| Chickasaw | 18 | 0.1% |
| Chippewa | 9 | 0.1% |
| Choctaw | 24 | 0.2% |
| Costa Rican | 41 | 0.3% |
| Croatian | 121 | 0.9% |
| Cuban | 144 | 1.0% |
| Czech | 34 | 0.3% |
| Czechoslovakian | 18 | 0.1% |
| Danish | 119 | 0.9% |
| Dutch | 243 | 1.8% |
| Eastern European | 39 | 0.3% |
| English | 1,992 | 14.4% |
| European | 1,613 | 11.6% |
| Finnish | 119 | 0.9% |
| French | 500 | 3.6% |
| French Canadian | 114 | 0.8% |
| German | 2,290 | 16.5% |
| Greek | 165 | 1.2% |
| Guamanian / Chamorro | 84 | 0.6% |
| Guatemalan | 3 | 0.0% |
| Hungarian | 24 | 0.2% |
| Indian (Asian) | 164 | 1.2% |
| Inupiat | 6 | 0.0% |
| Iranian | 53 | 0.4% |
| Irish | 1,357 | 9.8% |
| Italian | 421 | 3.0% |
| Jamaican | 5 | 0.0% |
| Korean | 92 | 0.7% |
| Lebanese | 67 | 0.5% |
| Malaysian | 69 | 0.5% |
| Mexican | 658 | 4.8% |
| Mexican American Indian | 28 | 0.2% |
| Native Hawaiian | 33 | 0.2% |
| Navajo | 21 | 0.2% |
| Northern European | 31 | 0.2% |
| Norwegian | 883 | 6.4% |
| Pakistani | 58 | 0.4% |
| Panamanian | 20 | 0.1% |
| Peruvian | 31 | 0.2% |
| Polish | 252 | 1.8% |
| Portuguese | 236 | 1.7% |
| Pueblo | 6 | 0.0% |
| Puerto Rican | 119 | 0.9% |
| Romanian | 84 | 0.6% |
| Russian | 84 | 0.6% |
| Samoan | 24 | 0.2% |
| Scandinavian | 149 | 1.1% |
| Scotch-Irish | 219 | 1.6% |
| Scottish | 482 | 3.5% |
| Slavic | 20 | 0.1% |
| Slovak | 18 | 0.1% |
| South American | 64 | 0.5% |
| Spaniard | 84 | 0.6% |
| Spanish | 37 | 0.3% |
| Sri Lankan | 127 | 0.9% |
| Subsaharan African | 76 | 0.5% |
| Swedish | 517 | 3.7% |
| Swiss | 113 | 0.8% |
| Thai | 47 | 0.3% |
| Tlingit-Haida | 4 | 0.0% |
| Ukrainian | 46 | 0.3% |
| Uruguayan | 5 | 0.0% |
| Welsh | 137 | 1.0% | View All 79 Rows |
Immigrants in Artondale
The most numerous immigrant groups reported in Artondale came from Asia (221 | 1.6%), Europe (213 | 1.5%), Latin America (201 | 1.5%), Central America (167 | 1.2%), and Mexico (150 | 1.1%), together accounting for 6.9% of all Artondale residents.
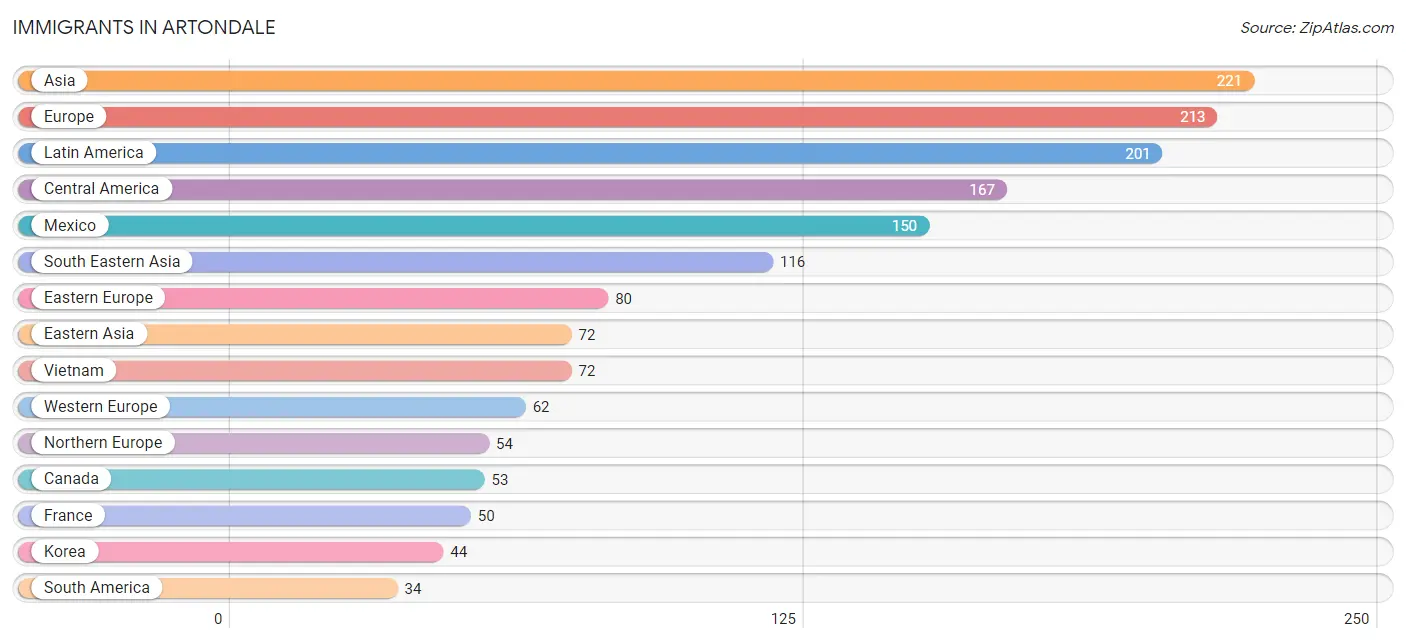
| Immigration Origin | # Population | % Population |
| Argentina | 17 | 0.1% |
| Asia | 221 | 1.6% |
| Australia | 21 | 0.2% |
| Belgium | 6 | 0.0% |
| Bolivia | 11 | 0.1% |
| Brazil | 6 | 0.0% |
| Canada | 53 | 0.4% |
| Central America | 167 | 1.2% |
| China | 27 | 0.2% |
| Costa Rica | 9 | 0.1% |
| Czechoslovakia | 12 | 0.1% |
| Eastern Asia | 72 | 0.5% |
| Eastern Europe | 80 | 0.6% |
| England | 24 | 0.2% |
| Europe | 213 | 1.5% |
| France | 50 | 0.4% |
| Germany | 6 | 0.0% |
| Guatemala | 3 | 0.0% |
| India | 16 | 0.1% |
| Iran | 17 | 0.1% |
| Italy | 17 | 0.1% |
| Japan | 1 | 0.0% |
| Korea | 44 | 0.3% |
| Laos | 13 | 0.1% |
| Latin America | 201 | 1.5% |
| Mexico | 150 | 1.1% |
| Northern Europe | 54 | 0.4% |
| Oceania | 21 | 0.2% |
| Panama | 5 | 0.0% |
| Philippines | 31 | 0.2% |
| Romania | 28 | 0.2% |
| Russia | 10 | 0.1% |
| South America | 34 | 0.3% |
| South Central Asia | 33 | 0.2% |
| South Eastern Asia | 116 | 0.8% |
| Southern Europe | 17 | 0.1% |
| Ukraine | 30 | 0.2% |
| Vietnam | 72 | 0.5% |
| Western Europe | 62 | 0.4% | View All 39 Rows |
Sex and Age in Artondale
Sex and Age in Artondale
The most populous age groups in Artondale are 50 to 54 Years (578 | 8.3%) for men and 5 to 9 Years (676 | 9.8%) for women.
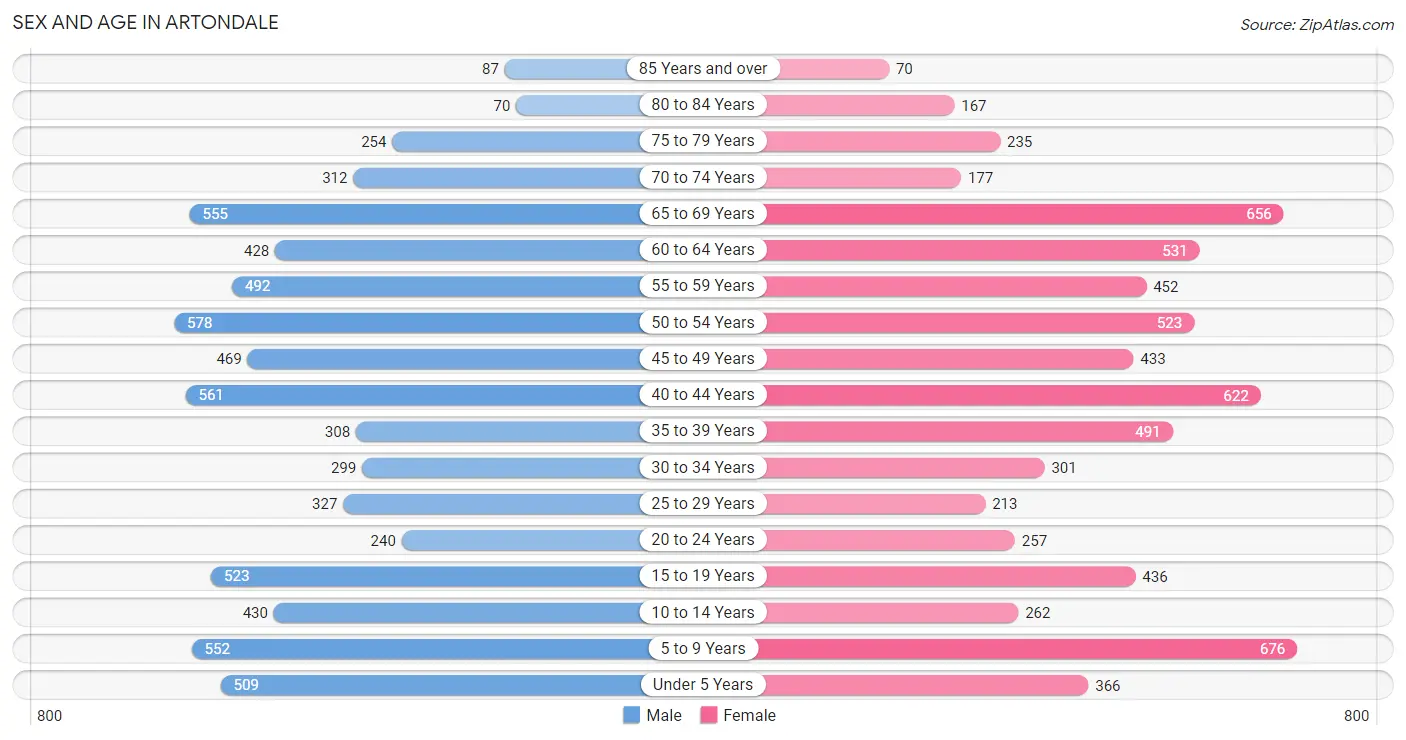
| Age Bracket | Male | Female |
| Under 5 Years | 509 (7.3%) | 366 (5.3%) |
| 5 to 9 Years | 552 (7.9%) | 676 (9.8%) |
| 10 to 14 Years | 430 (6.1%) | 262 (3.8%) |
| 15 to 19 Years | 523 (7.5%) | 436 (6.4%) |
| 20 to 24 Years | 240 (3.4%) | 257 (3.7%) |
| 25 to 29 Years | 327 (4.7%) | 213 (3.1%) |
| 30 to 34 Years | 299 (4.3%) | 301 (4.4%) |
| 35 to 39 Years | 308 (4.4%) | 491 (7.1%) |
| 40 to 44 Years | 561 (8.0%) | 622 (9.1%) |
| 45 to 49 Years | 469 (6.7%) | 433 (6.3%) |
| 50 to 54 Years | 578 (8.3%) | 523 (7.6%) |
| 55 to 59 Years | 492 (7.0%) | 452 (6.6%) |
| 60 to 64 Years | 428 (6.1%) | 531 (7.7%) |
| 65 to 69 Years | 555 (7.9%) | 656 (9.6%) |
| 70 to 74 Years | 312 (4.5%) | 177 (2.6%) |
| 75 to 79 Years | 254 (3.6%) | 235 (3.4%) |
| 80 to 84 Years | 70 (1.0%) | 167 (2.4%) |
| 85 Years and over | 87 (1.2%) | 70 (1.0%) |
| Total | 6,994 (100.0%) | 6,868 (100.0%) |
Families and Households in Artondale
Median Family Size in Artondale
The median family size in Artondale is 2.99 persons per family, with married-couple families (3,780 | 89.5%) accounting for the largest median family size of 3.04 persons per family. On the other hand, single female/mother families (330 | 7.8%) represent the smallest median family size with 2.37 persons per family.
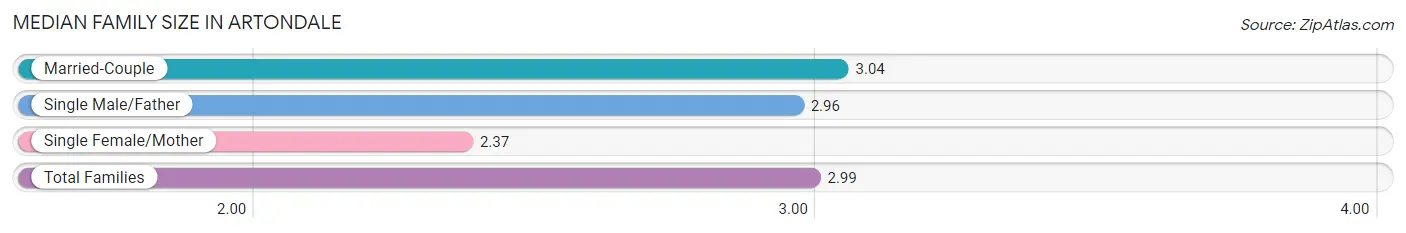
| Family Type | # Families | Family Size |
| Married-Couple | 3,780 (89.5%) | 3.04 |
| Single Male/Father | 114 (2.7%) | 2.96 |
| Single Female/Mother | 330 (7.8%) | 2.37 |
| Total Families | 4,224 (100.0%) | 2.99 |
Median Household Size in Artondale
The median household size in Artondale is 2.71 persons per household, with married-couple households (3,780 | 74.2%) accounting for the largest median household size of 3.06 persons per household. non-family households (874 | 17.1%) represent the smallest median household size with 1.25 persons per household.
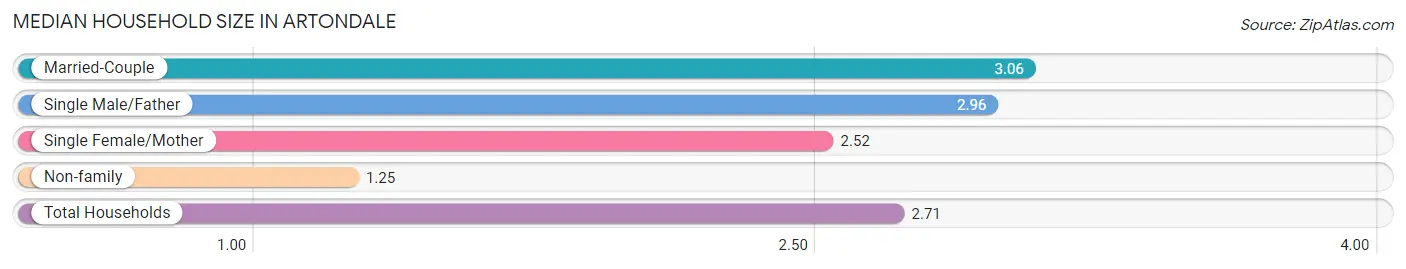
| Household Type | # Households | Household Size |
| Married-Couple | 3,780 (74.2%) | 3.06 |
| Single Male/Father | 114 (2.2%) | 2.96 |
| Single Female/Mother | 330 (6.5%) | 2.52 |
| Non-family | 874 (17.1%) | 1.25 |
| Total Households | 5,098 (100.0%) | 2.71 |
Household Size by Marriage Status in Artondale
Out of a total of 5,098 households in Artondale, 4,224 (82.9%) are family households, while 874 (17.1%) are nonfamily households. The most numerous type of family households are 2-person households, comprising 1,929, and the most common type of nonfamily households are 1-person households, comprising 687.
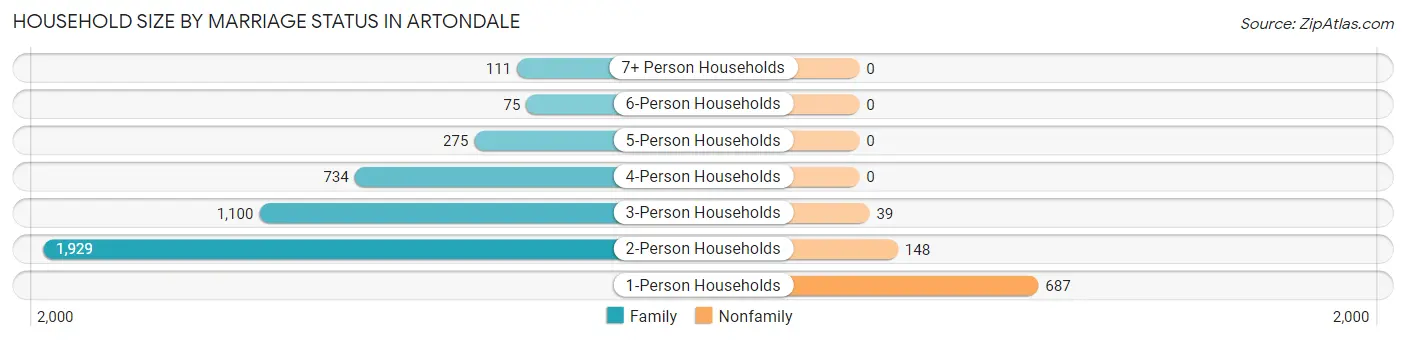
| Household Size | Family Households | Nonfamily Households |
| 1-Person Households | - | 687 (13.5%) |
| 2-Person Households | 1,929 (37.8%) | 148 (2.9%) |
| 3-Person Households | 1,100 (21.6%) | 39 (0.8%) |
| 4-Person Households | 734 (14.4%) | 0 (0.0%) |
| 5-Person Households | 275 (5.4%) | 0 (0.0%) |
| 6-Person Households | 75 (1.5%) | 0 (0.0%) |
| 7+ Person Households | 111 (2.2%) | 0 (0.0%) |
| Total | 4,224 (82.9%) | 874 (17.1%) |
Female Fertility in Artondale
Fertility by Age in Artondale
Average fertility rate in Artondale is 36.0 births per 1,000 women. Women in the age bracket of 20 to 34 years have the highest fertility rate with 110.0 births per 1,000 women. Women in the age bracket of 20 to 34 years acount for 82.5% of all women with births.
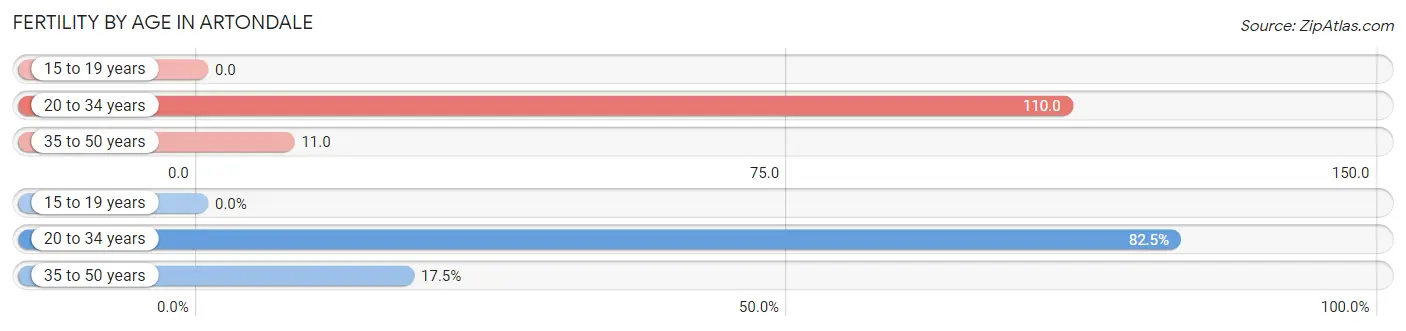
| Age Bracket | Women with Births | Births / 1,000 Women |
| 15 to 19 years | 0 (0.0%) | 0.0 |
| 20 to 34 years | 85 (82.5%) | 110.0 |
| 35 to 50 years | 18 (17.5%) | 11.0 |
| Total | 103 (100.0%) | 36.0 |
Fertility by Age by Marriage Status in Artondale
96.1% of women with births (103) in Artondale are married. The highest percentage of unmarried women with births falls into 20 to 34 years age bracket with 4.7% of them unmarried at the time of birth, while the lowest percentage of unmarried women with births belong to 35 to 50 years age bracket with 0.0% of them unmarried.
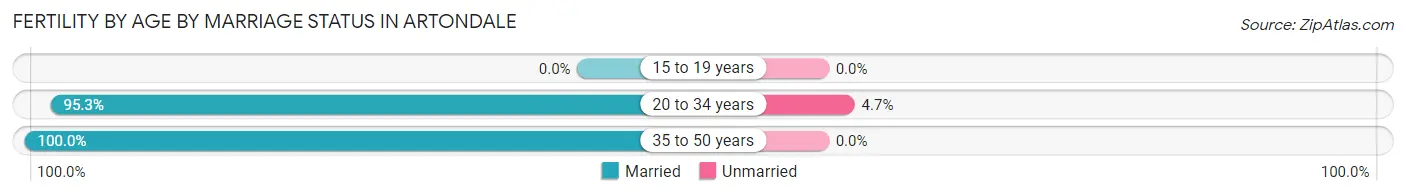
| Age Bracket | Married | Unmarried |
| 15 to 19 years | 0 (0.0%) | 0 (0.0%) |
| 20 to 34 years | 81 (95.3%) | 4 (4.7%) |
| 35 to 50 years | 18 (100.0%) | 0 (0.0%) |
| Total | 99 (96.1%) | 4 (3.9%) |
Fertility by Education in Artondale
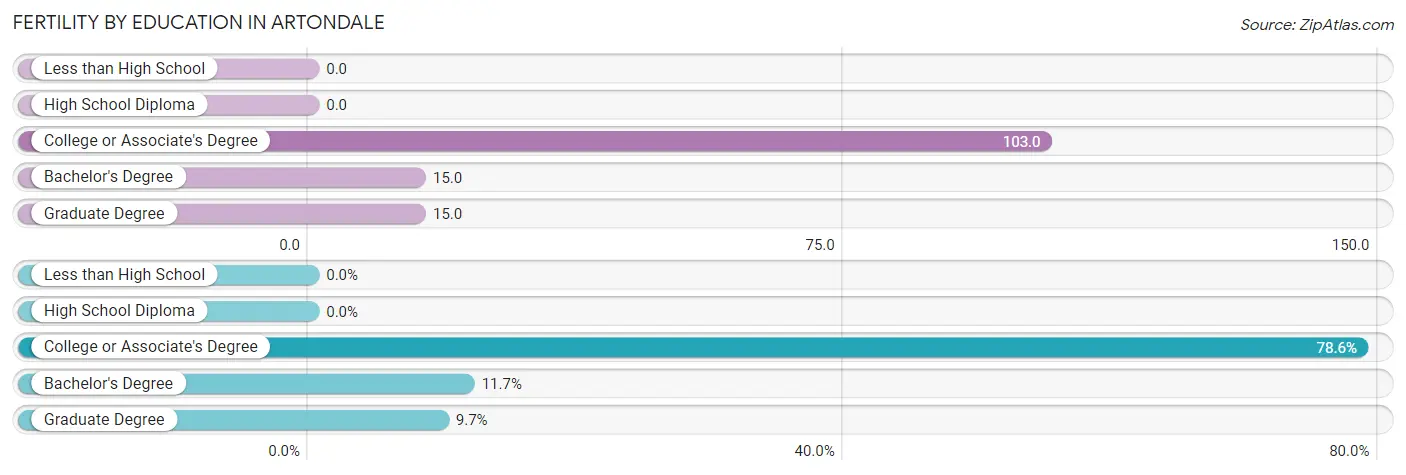
| Educational Attainment | Women with Births | Births / 1,000 Women |
| Less than High School | 0 (0.0%) | 0.0 |
| High School Diploma | 0 (0.0%) | 0.0 |
| College or Associate's Degree | 81 (78.6%) | 103.0 |
| Bachelor's Degree | 12 (11.7%) | 15.0 |
| Graduate Degree | 10 (9.7%) | 15.0 |
| Total | 103 (100.0%) | 36.0 |
Fertility by Education by Marriage Status in Artondale
3.9% of women with births in Artondale are unmarried. Women with the educational attainment of college or associate's degree are most likely to be married with 100.0% of them married at childbirth, while women with the educational attainment of bachelor's degree are least likely to be married with 33.3% of them unmarried at childbirth.
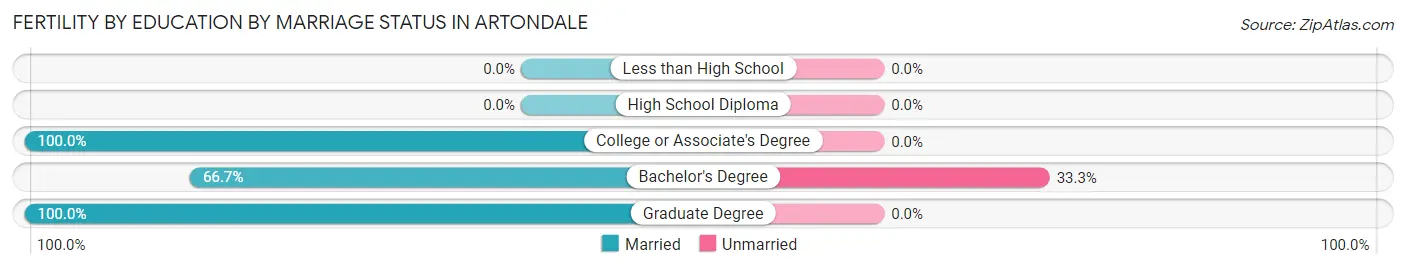
| Educational Attainment | Married | Unmarried |
| Less than High School | 0 (0.0%) | 0 (0.0%) |
| High School Diploma | 0 (0.0%) | 0 (0.0%) |
| College or Associate's Degree | 81 (100.0%) | 0 (0.0%) |
| Bachelor's Degree | 8 (66.7%) | 4 (33.3%) |
| Graduate Degree | 10 (100.0%) | 0 (0.0%) |
| Total | 99 (96.1%) | 4 (3.9%) |
Employment Characteristics in Artondale
Employment by Class of Employer in Artondale
Among the 6,378 employed individuals in Artondale, private company employees (3,379 | 53.0%), not-for-profit organizations (1,000 | 15.7%), and local government employees (560 | 8.8%) make up the most common classes of employment.
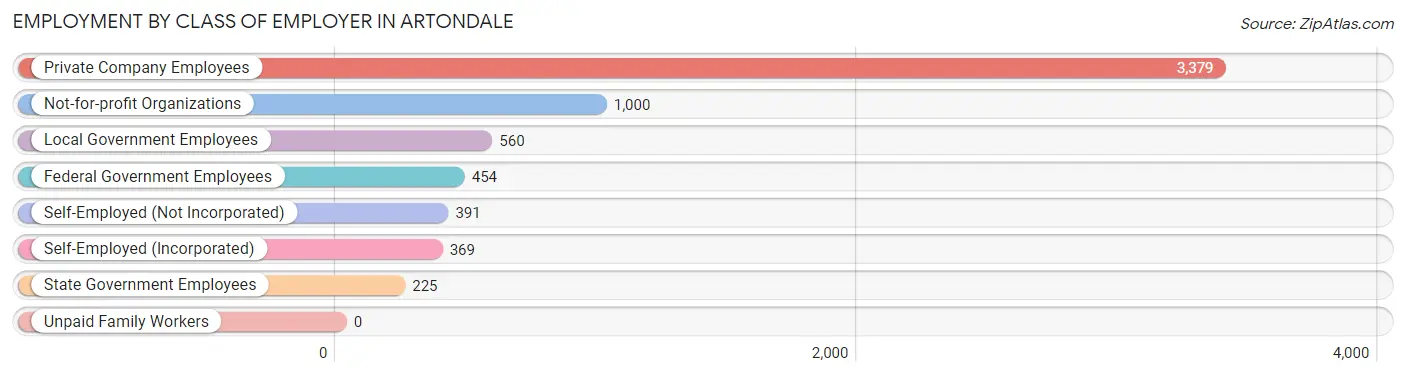
| Employer Class | # Employees | % Employees |
| Private Company Employees | 3,379 | 53.0% |
| Self-Employed (Incorporated) | 369 | 5.8% |
| Self-Employed (Not Incorporated) | 391 | 6.1% |
| Not-for-profit Organizations | 1,000 | 15.7% |
| Local Government Employees | 560 | 8.8% |
| State Government Employees | 225 | 3.5% |
| Federal Government Employees | 454 | 7.1% |
| Unpaid Family Workers | 0 | 0.0% |
| Total | 6,378 | 100.0% |
Employment Status by Age in Artondale
According to the labor force statistics for Artondale, out of the total population over 16 years of age (10,807), 61.4% or 6,635 individuals are in the labor force, with 2.4% or 159 of them unemployed. The age group with the highest labor force participation rate is 30 to 34 years, with 92.3% or 554 individuals in the labor force. Within the labor force, the 30 to 34 years age range has the highest percentage of unemployed individuals, with 9.7% or 54 of them being unemployed.
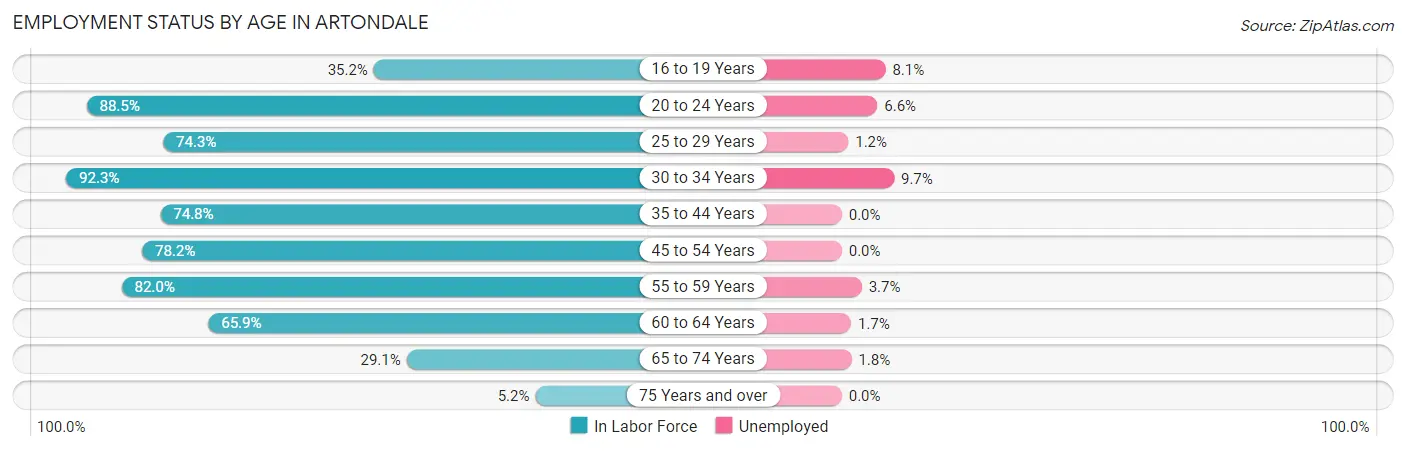
| Age Bracket | In Labor Force | Unemployed |
| 16 to 19 Years | 246 (35.2%) | 20 (8.1%) |
| 20 to 24 Years | 440 (88.5%) | 29 (6.6%) |
| 25 to 29 Years | 401 (74.3%) | 5 (1.2%) |
| 30 to 34 Years | 554 (92.3%) | 54 (9.7%) |
| 35 to 44 Years | 1,483 (74.8%) | 0 (0.0%) |
| 45 to 54 Years | 1,566 (78.2%) | 0 (0.0%) |
| 55 to 59 Years | 774 (82.0%) | 29 (3.7%) |
| 60 to 64 Years | 632 (65.9%) | 11 (1.7%) |
| 65 to 74 Years | 495 (29.1%) | 9 (1.8%) |
| 75 Years and over | 46 (5.2%) | 0 (0.0%) |
| Total | 6,635 (61.4%) | 159 (2.4%) |
Employment Status by Educational Attainment in Artondale
According to labor force statistics for Artondale, 77.0% of individuals (5,412) out of the total population between 25 and 64 years of age (7,028) are in the labor force, with 1.9% or 103 of them being unemployed. The group with the highest labor force participation rate are those with the educational attainment of bachelor's degree or higher, with 78.7% or 2,996 individuals in the labor force. Within the labor force, individuals with college / associate degree education have the highest percentage of unemployment, with 4.3% or 70 of them being unemployed.
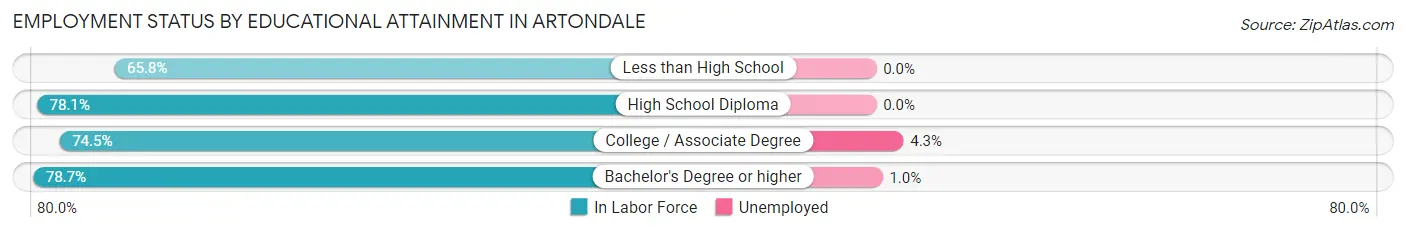
| Educational Attainment | In Labor Force | Unemployed |
| Less than High School | 133 (65.8%) | 0 (0.0%) |
| High School Diploma | 649 (78.1%) | 0 (0.0%) |
| College / Associate Degree | 1,630 (74.5%) | 94 (4.3%) |
| Bachelor's Degree or higher | 2,996 (78.7%) | 38 (1.0%) |
| Total | 5,412 (77.0%) | 134 (1.9%) |
Employment Occupations by Sex in Artondale
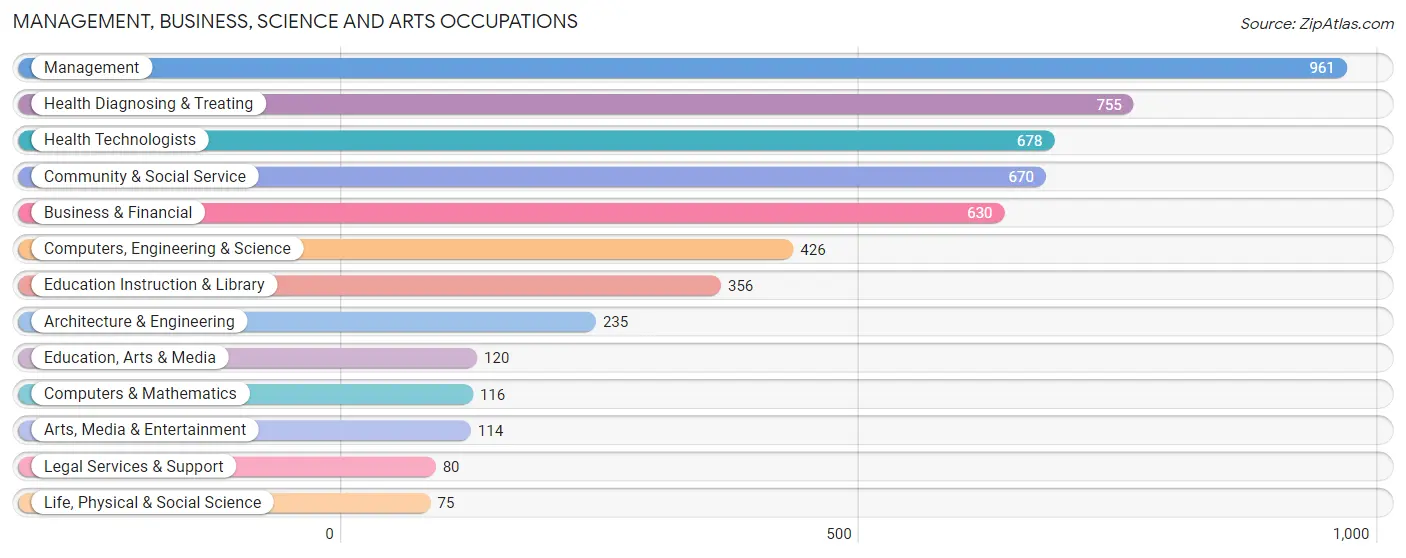
Management, Business, Science and Arts Occupations
The most common Management, Business, Science and Arts occupations in Artondale are Management (961 | 15.1%), Health Diagnosing & Treating (755 | 11.8%), Health Technologists (678 | 10.6%), Community & Social Service (670 | 10.5%), and Business & Financial (630 | 9.9%).
Management, Business, Science and Arts Occupations by Sex
Within the Management, Business, Science and Arts occupations in Artondale, the most male-oriented occupations are Architecture & Engineering (90.6%), Computers & Mathematics (88.8%), and Computers, Engineering & Science (87.3%), while the most female-oriented occupations are Education, Arts & Media (100.0%), Education Instruction & Library (84.0%), and Community & Social Service (82.1%).
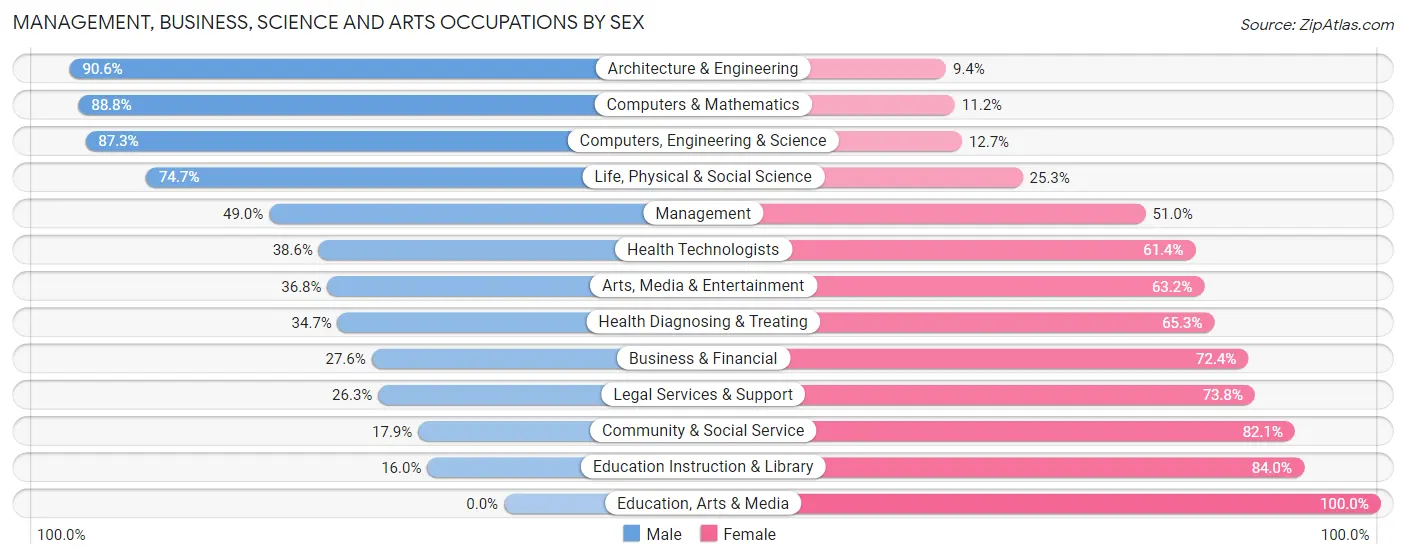
| Occupation | Male | Female |
| Management | 471 (49.0%) | 490 (51.0%) |
| Business & Financial | 174 (27.6%) | 456 (72.4%) |
| Computers, Engineering & Science | 372 (87.3%) | 54 (12.7%) |
| Computers & Mathematics | 103 (88.8%) | 13 (11.2%) |
| Architecture & Engineering | 213 (90.6%) | 22 (9.4%) |
| Life, Physical & Social Science | 56 (74.7%) | 19 (25.3%) |
| Community & Social Service | 120 (17.9%) | 550 (82.1%) |
| Education, Arts & Media | 0 (0.0%) | 120 (100.0%) |
| Legal Services & Support | 21 (26.3%) | 59 (73.8%) |
| Education Instruction & Library | 57 (16.0%) | 299 (84.0%) |
| Arts, Media & Entertainment | 42 (36.8%) | 72 (63.2%) |
| Health Diagnosing & Treating | 262 (34.7%) | 493 (65.3%) |
| Health Technologists | 262 (38.6%) | 416 (61.4%) |
| Total (Category) | 1,399 (40.6%) | 2,043 (59.4%) |
| Total (Overall) | 3,329 (52.2%) | 3,053 (47.8%) |
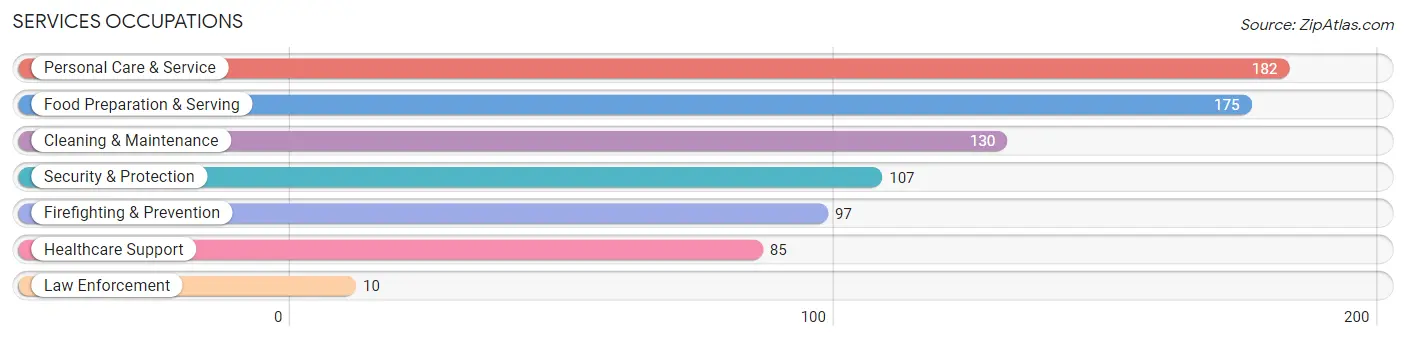
Services Occupations
The most common Services occupations in Artondale are Personal Care & Service (182 | 2.9%), Food Preparation & Serving (175 | 2.7%), Cleaning & Maintenance (130 | 2.0%), Security & Protection (107 | 1.7%), and Firefighting & Prevention (97 | 1.5%).
Services Occupations by Sex
Within the Services occupations in Artondale, the most male-oriented occupations are Firefighting & Prevention (87.6%), Security & Protection (83.2%), and Cleaning & Maintenance (79.2%), while the most female-oriented occupations are Healthcare Support (100.0%), Law Enforcement (60.0%), and Personal Care & Service (56.6%).
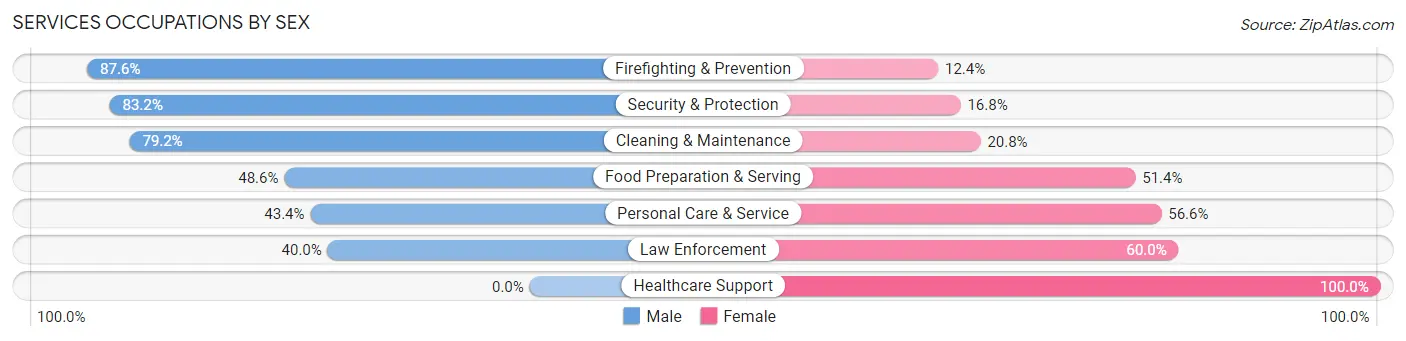
| Occupation | Male | Female |
| Healthcare Support | 0 (0.0%) | 85 (100.0%) |
| Security & Protection | 89 (83.2%) | 18 (16.8%) |
| Firefighting & Prevention | 85 (87.6%) | 12 (12.4%) |
| Law Enforcement | 4 (40.0%) | 6 (60.0%) |
| Food Preparation & Serving | 85 (48.6%) | 90 (51.4%) |
| Cleaning & Maintenance | 103 (79.2%) | 27 (20.8%) |
| Personal Care & Service | 79 (43.4%) | 103 (56.6%) |
| Total (Category) | 356 (52.4%) | 323 (47.6%) |
| Total (Overall) | 3,329 (52.2%) | 3,053 (47.8%) |
Sales and Office Occupations
The most common Sales and Office occupations in Artondale are Sales & Related (691 | 10.8%), and Office & Administration (556 | 8.7%).

Sales and Office Occupations by Sex
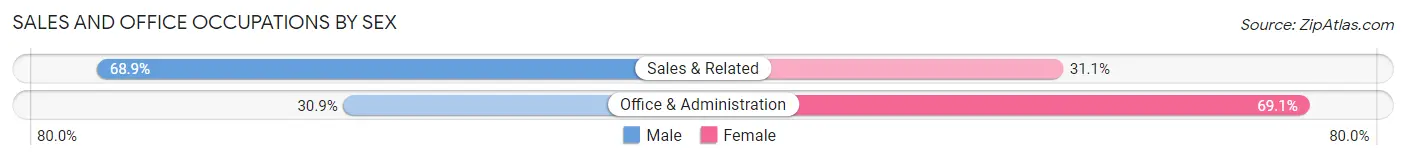
| Occupation | Male | Female |
| Sales & Related | 476 (68.9%) | 215 (31.1%) |
| Office & Administration | 172 (30.9%) | 384 (69.1%) |
| Total (Category) | 648 (52.0%) | 599 (48.0%) |
| Total (Overall) | 3,329 (52.2%) | 3,053 (47.8%) |
Natural Resources, Construction and Maintenance Occupations
The most common Natural Resources, Construction and Maintenance occupations in Artondale are Construction & Extraction (240 | 3.8%), Installation, Maintenance & Repair (145 | 2.3%), and Farming, Fishing & Forestry (3 | 0.1%).
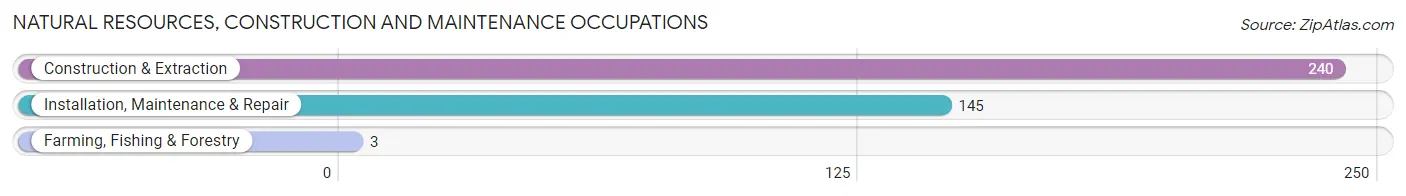
Natural Resources, Construction and Maintenance Occupations by Sex
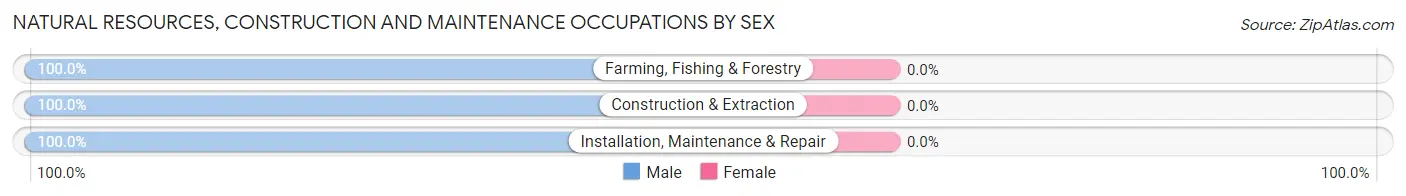
| Occupation | Male | Female |
| Farming, Fishing & Forestry | 3 (100.0%) | 0 (0.0%) |
| Construction & Extraction | 240 (100.0%) | 0 (0.0%) |
| Installation, Maintenance & Repair | 145 (100.0%) | 0 (0.0%) |
| Total (Category) | 388 (100.0%) | 0 (0.0%) |
| Total (Overall) | 3,329 (52.2%) | 3,053 (47.8%) |
Production, Transportation and Moving Occupations
The most common Production, Transportation and Moving occupations in Artondale are Transportation (239 | 3.7%), Material Moving (200 | 3.1%), and Production (187 | 2.9%).
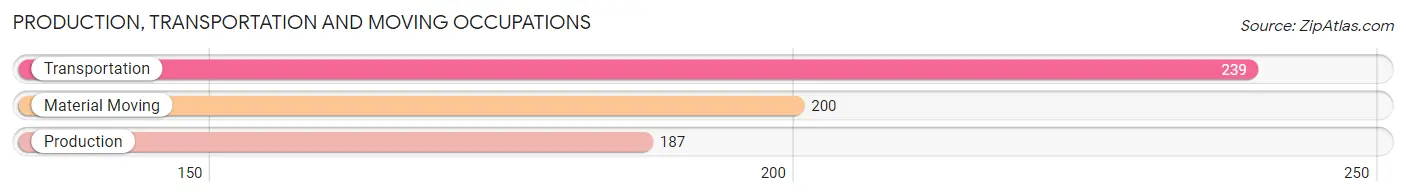
Production, Transportation and Moving Occupations by Sex
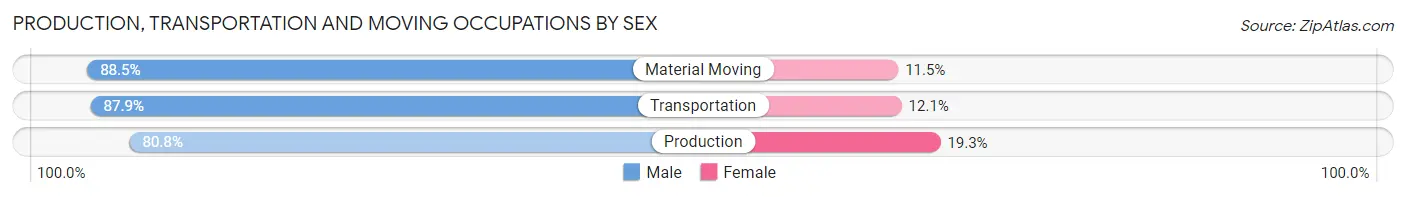
| Occupation | Male | Female |
| Production | 151 (80.7%) | 36 (19.3%) |
| Transportation | 210 (87.9%) | 29 (12.1%) |
| Material Moving | 177 (88.5%) | 23 (11.5%) |
| Total (Category) | 538 (85.9%) | 88 (14.1%) |
| Total (Overall) | 3,329 (52.2%) | 3,053 (47.8%) |
Employment Industries by Sex in Artondale
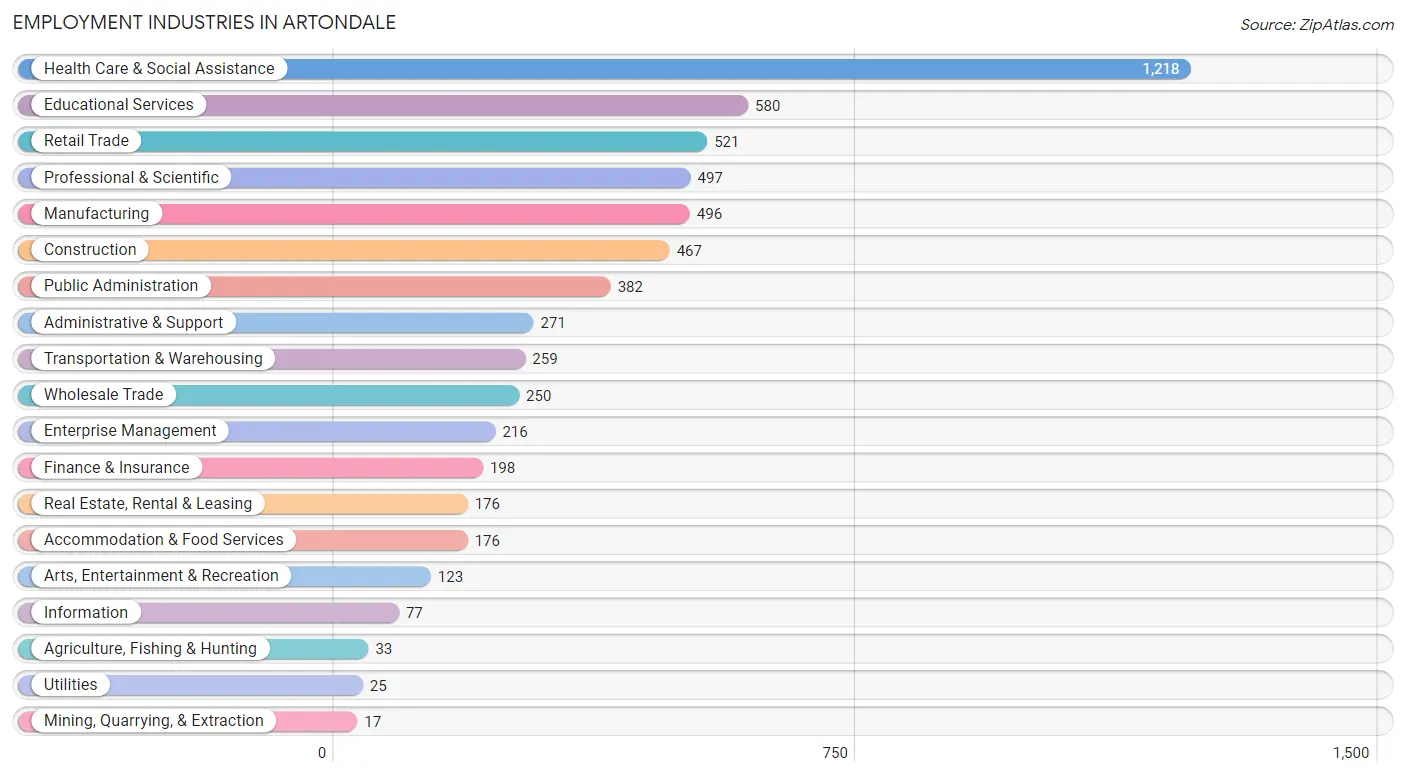
Employment Industries in Artondale
The major employment industries in Artondale include Health Care & Social Assistance (1,218 | 19.1%), Educational Services (580 | 9.1%), Retail Trade (521 | 8.2%), Professional & Scientific (497 | 7.8%), and Manufacturing (496 | 7.8%).
Employment Industries by Sex in Artondale
The Artondale industries that see more men than women are Mining, Quarrying, & Extraction (100.0%), Manufacturing (93.5%), and Utilities (92.0%), whereas the industries that tend to have a higher number of women are Enterprise Management (91.7%), Agriculture, Fishing & Hunting (90.9%), and Educational Services (84.1%).
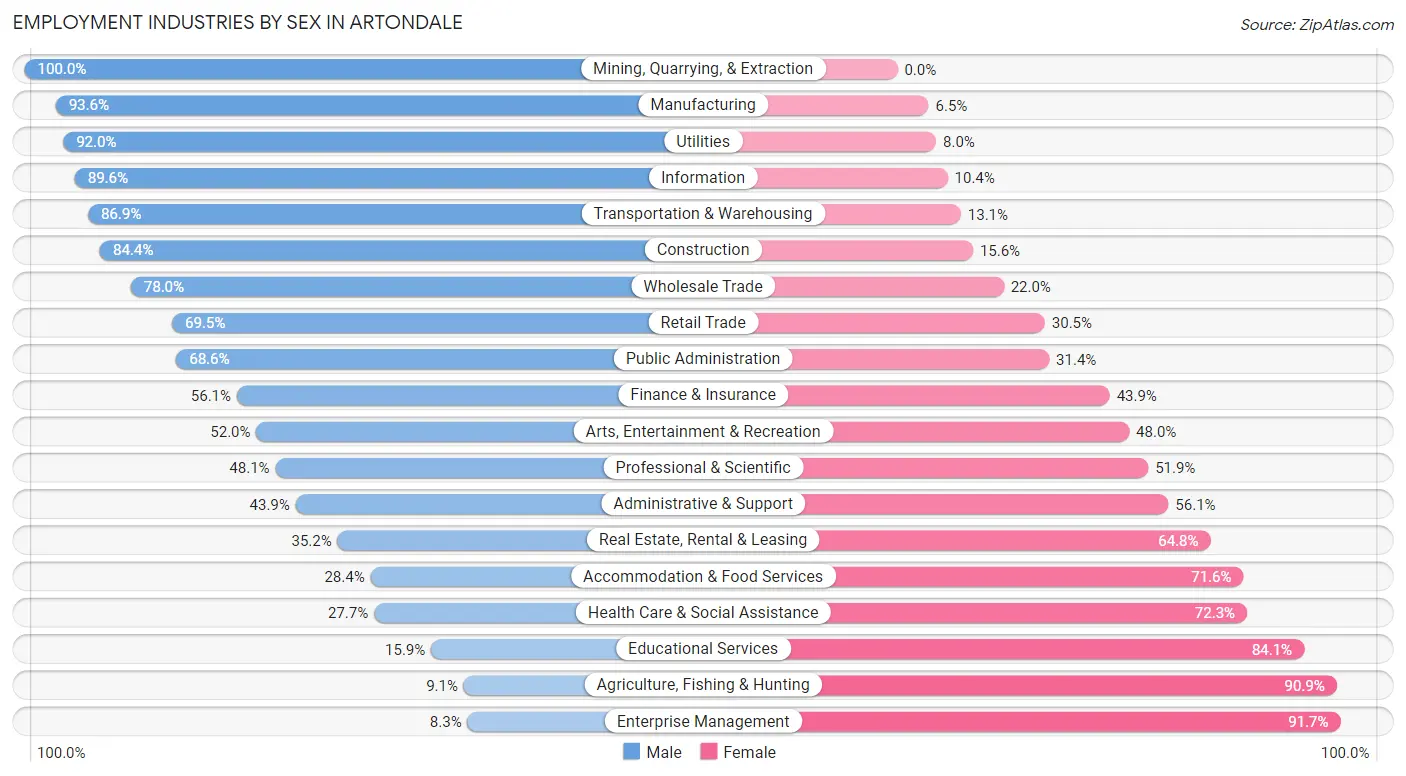
| Industry | Male | Female |
| Agriculture, Fishing & Hunting | 3 (9.1%) | 30 (90.9%) |
| Mining, Quarrying, & Extraction | 17 (100.0%) | 0 (0.0%) |
| Construction | 394 (84.4%) | 73 (15.6%) |
| Manufacturing | 464 (93.5%) | 32 (6.5%) |
| Wholesale Trade | 195 (78.0%) | 55 (22.0%) |
| Retail Trade | 362 (69.5%) | 159 (30.5%) |
| Transportation & Warehousing | 225 (86.9%) | 34 (13.1%) |
| Utilities | 23 (92.0%) | 2 (8.0%) |
| Information | 69 (89.6%) | 8 (10.4%) |
| Finance & Insurance | 111 (56.1%) | 87 (43.9%) |
| Real Estate, Rental & Leasing | 62 (35.2%) | 114 (64.8%) |
| Professional & Scientific | 239 (48.1%) | 258 (51.9%) |
| Enterprise Management | 18 (8.3%) | 198 (91.7%) |
| Administrative & Support | 119 (43.9%) | 152 (56.1%) |
| Educational Services | 92 (15.9%) | 488 (84.1%) |
| Health Care & Social Assistance | 337 (27.7%) | 881 (72.3%) |
| Arts, Entertainment & Recreation | 64 (52.0%) | 59 (48.0%) |
| Accommodation & Food Services | 50 (28.4%) | 126 (71.6%) |
| Public Administration | 262 (68.6%) | 120 (31.4%) |
| Total | 3,329 (52.2%) | 3,053 (47.8%) |
Education in Artondale
School Enrollment in Artondale
The most common levels of schooling among the 3,364 students in Artondale are elementary school (996 | 29.6%), high school (810 | 24.1%), and middle school (462 | 13.7%).
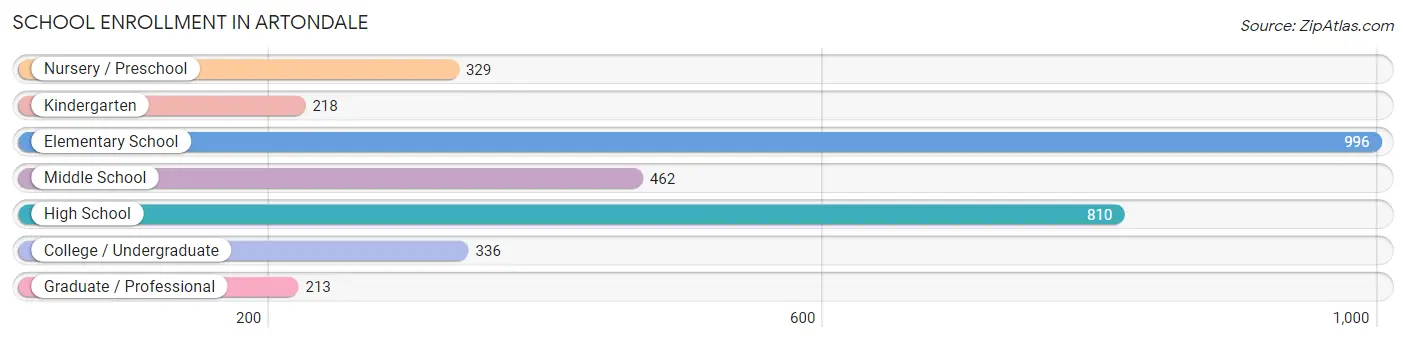
| School Level | # Students | % Students |
| Nursery / Preschool | 329 | 9.8% |
| Kindergarten | 218 | 6.5% |
| Elementary School | 996 | 29.6% |
| Middle School | 462 | 13.7% |
| High School | 810 | 24.1% |
| College / Undergraduate | 336 | 10.0% |
| Graduate / Professional | 213 | 6.3% |
| Total | 3,364 | 100.0% |
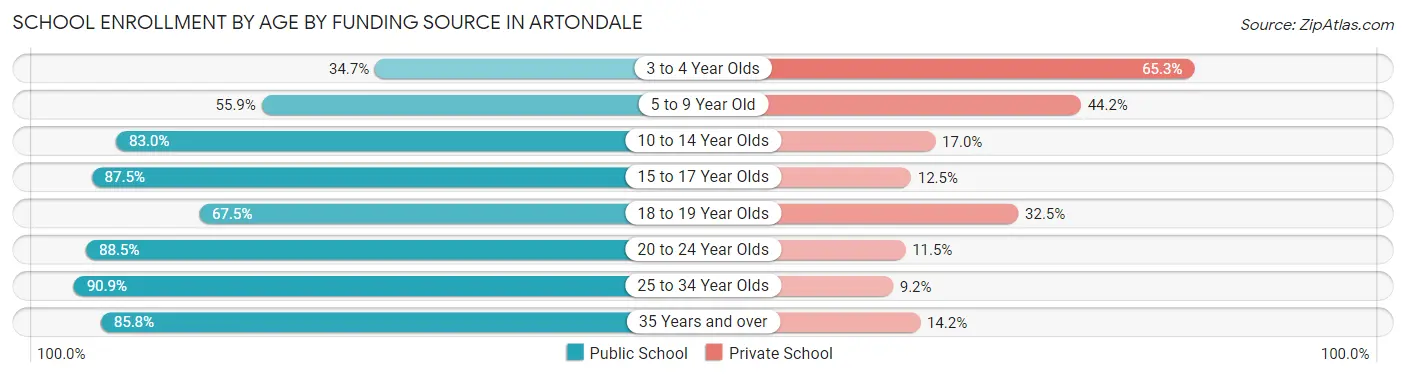
School Enrollment by Age by Funding Source in Artondale
Out of a total of 3,364 students who are enrolled in schools in Artondale, 979 (29.1%) attend a private institution, while the remaining 2,385 (70.9%) are enrolled in public schools. The age group of 3 to 4 year olds has the highest likelihood of being enrolled in private schools, with 141 (65.3% in the age bracket) enrolled. Conversely, the age group of 25 to 34 year olds has the lowest likelihood of being enrolled in a private school, with 139 (90.8% in the age bracket) attending a public institution.
| Age Bracket | Public School | Private School |
| 3 to 4 Year Olds | 75 (34.7%) | 141 (65.3%) |
| 5 to 9 Year Old | 654 (55.8%) | 517 (44.2%) |
| 10 to 14 Year Olds | 555 (83.0%) | 114 (17.0%) |
| 15 to 17 Year Olds | 553 (87.5%) | 79 (12.5%) |
| 18 to 19 Year Olds | 160 (67.5%) | 77 (32.5%) |
| 20 to 24 Year Olds | 85 (88.5%) | 11 (11.5%) |
| 25 to 34 Year Olds | 139 (90.8%) | 14 (9.1%) |
| 35 Years and over | 163 (85.8%) | 27 (14.2%) |
| Total | 2,385 (70.9%) | 979 (29.1%) |
Educational Attainment by Field of Study in Artondale
Business (893 | 15.8%), social sciences (730 | 13.0%), bio, nature & agricultural (727 | 12.9%), science & technology (620 | 11.0%), and engineering (526 | 9.3%) are the most common fields of study among 5,638 individuals in Artondale who have obtained a bachelor's degree or higher.
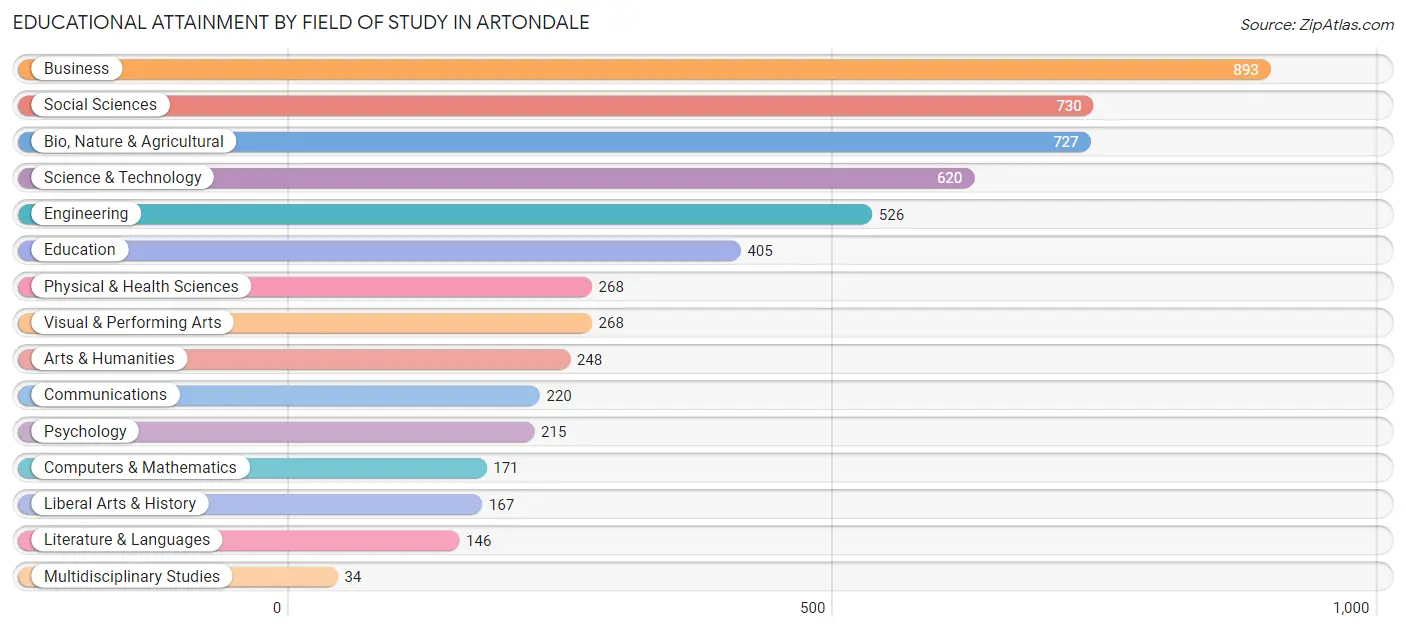
| Field of Study | # Graduates | % Graduates |
| Computers & Mathematics | 171 | 3.0% |
| Bio, Nature & Agricultural | 727 | 12.9% |
| Physical & Health Sciences | 268 | 4.8% |
| Psychology | 215 | 3.8% |
| Social Sciences | 730 | 13.0% |
| Engineering | 526 | 9.3% |
| Multidisciplinary Studies | 34 | 0.6% |
| Science & Technology | 620 | 11.0% |
| Business | 893 | 15.8% |
| Education | 405 | 7.2% |
| Literature & Languages | 146 | 2.6% |
| Liberal Arts & History | 167 | 3.0% |
| Visual & Performing Arts | 268 | 4.8% |
| Communications | 220 | 3.9% |
| Arts & Humanities | 248 | 4.4% |
| Total | 5,638 | 100.0% |
Transportation & Commute in Artondale
Vehicle Availability by Sex in Artondale
The most prevalent vehicle ownership categories in Artondale are males with 2 vehicles (1,407, accounting for 41.5%) and females with 2 vehicles (1,193, making up 47.2%).
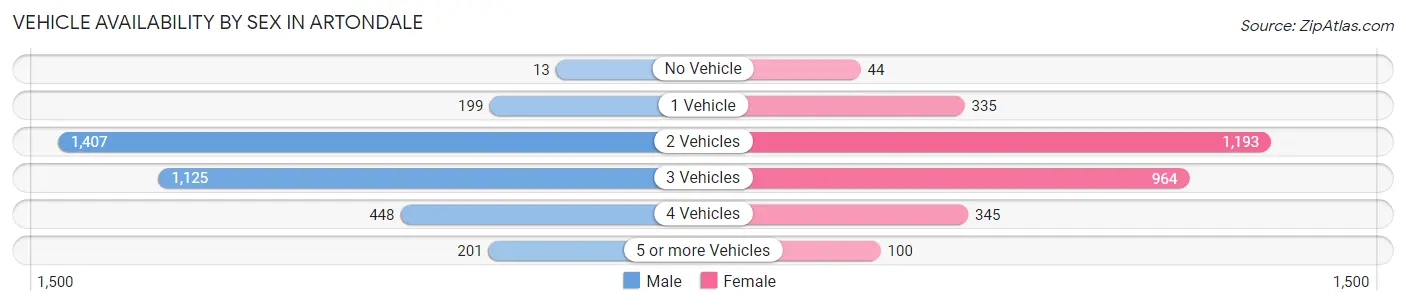
| Vehicles Available | Male | Female |
| No Vehicle | 13 (0.4%) | 44 (1.5%) |
| 1 Vehicle | 199 (5.9%) | 335 (11.2%) |
| 2 Vehicles | 1,407 (41.5%) | 1,193 (40.0%) |
| 3 Vehicles | 1,125 (33.2%) | 964 (32.3%) |
| 4 Vehicles | 448 (13.2%) | 345 (11.6%) |
| 5 or more Vehicles | 201 (5.9%) | 100 (3.4%) |
| Total | 3,393 (100.0%) | 2,981 (100.0%) |
Commute Time in Artondale
The most frequently occuring commute durations in Artondale are 45 to 59 minutes (800 commuters, 15.0%), 10 to 14 minutes (697 commuters, 13.1%), and 30 to 34 minutes (585 commuters, 11.0%).
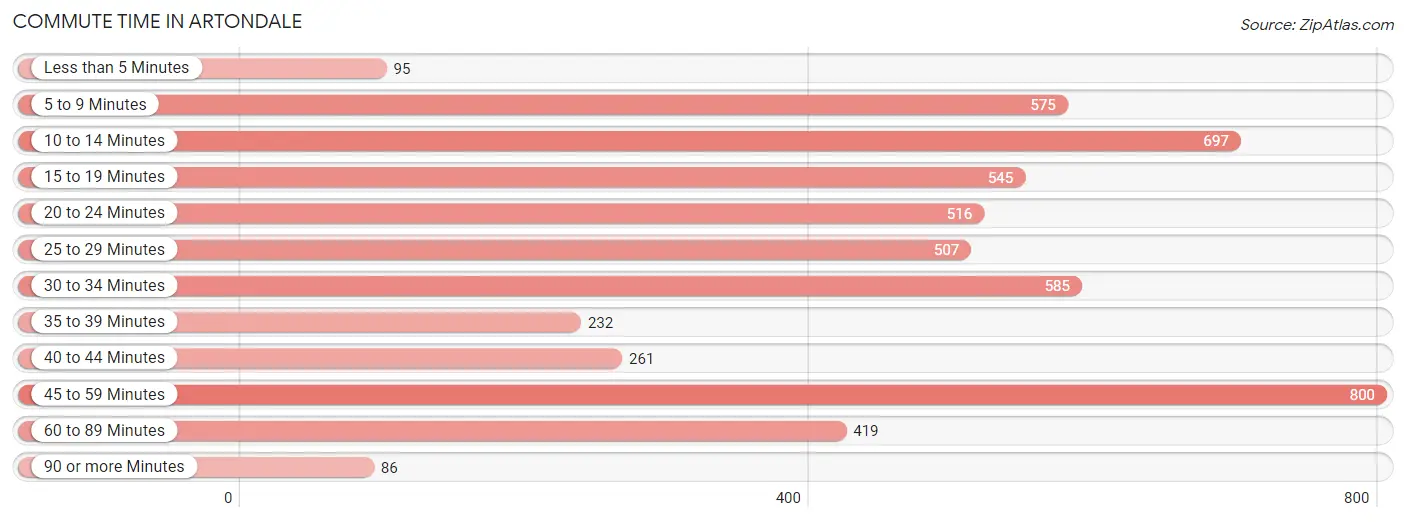
| Commute Time | # Commuters | % Commuters |
| Less than 5 Minutes | 95 | 1.8% |
| 5 to 9 Minutes | 575 | 10.8% |
| 10 to 14 Minutes | 697 | 13.1% |
| 15 to 19 Minutes | 545 | 10.2% |
| 20 to 24 Minutes | 516 | 9.7% |
| 25 to 29 Minutes | 507 | 9.5% |
| 30 to 34 Minutes | 585 | 11.0% |
| 35 to 39 Minutes | 232 | 4.4% |
| 40 to 44 Minutes | 261 | 4.9% |
| 45 to 59 Minutes | 800 | 15.0% |
| 60 to 89 Minutes | 419 | 7.9% |
| 90 or more Minutes | 86 | 1.6% |
Commute Time by Sex in Artondale
The most common commute times in Artondale are 45 to 59 minutes (543 commuters, 18.5%) for males and 5 to 9 minutes (382 commuters, 16.0%) for females.
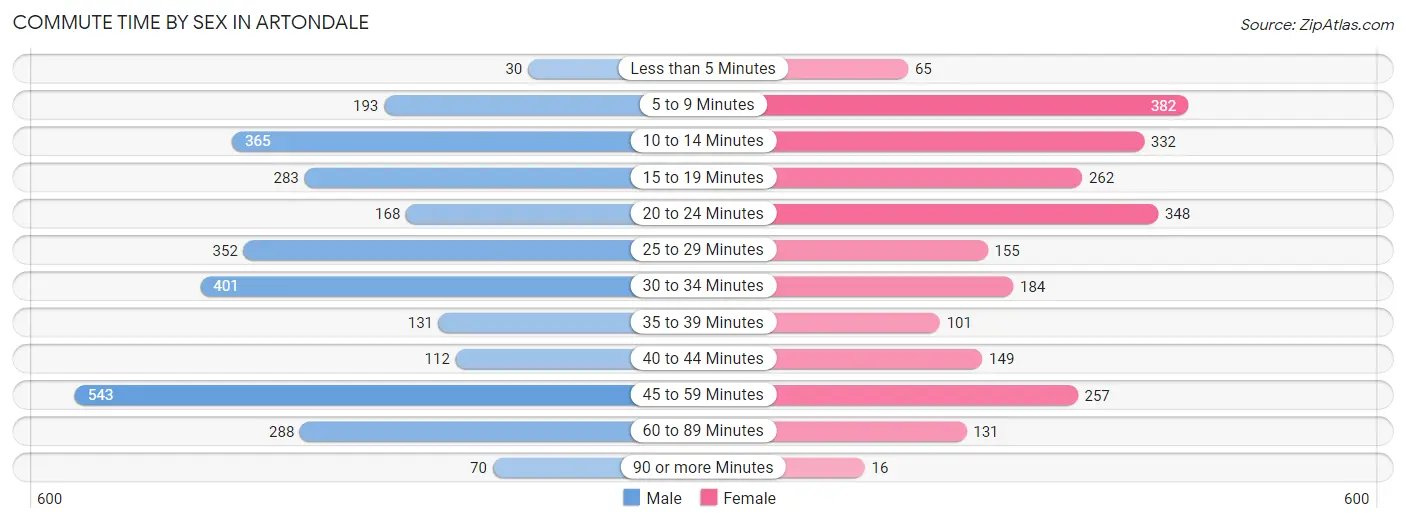
| Commute Time | Male | Female |
| Less than 5 Minutes | 30 (1.0%) | 65 (2.7%) |
| 5 to 9 Minutes | 193 (6.6%) | 382 (16.0%) |
| 10 to 14 Minutes | 365 (12.4%) | 332 (13.9%) |
| 15 to 19 Minutes | 283 (9.6%) | 262 (11.0%) |
| 20 to 24 Minutes | 168 (5.7%) | 348 (14.6%) |
| 25 to 29 Minutes | 352 (12.0%) | 155 (6.5%) |
| 30 to 34 Minutes | 401 (13.7%) | 184 (7.7%) |
| 35 to 39 Minutes | 131 (4.5%) | 101 (4.2%) |
| 40 to 44 Minutes | 112 (3.8%) | 149 (6.3%) |
| 45 to 59 Minutes | 543 (18.5%) | 257 (10.8%) |
| 60 to 89 Minutes | 288 (9.8%) | 131 (5.5%) |
| 90 or more Minutes | 70 (2.4%) | 16 (0.7%) |
Time of Departure to Work by Sex in Artondale
The most frequent times of departure to work in Artondale are 7:00 AM to 7:29 AM (419, 14.3%) for males and 7:30 AM to 7:59 AM (607, 25.5%) for females.
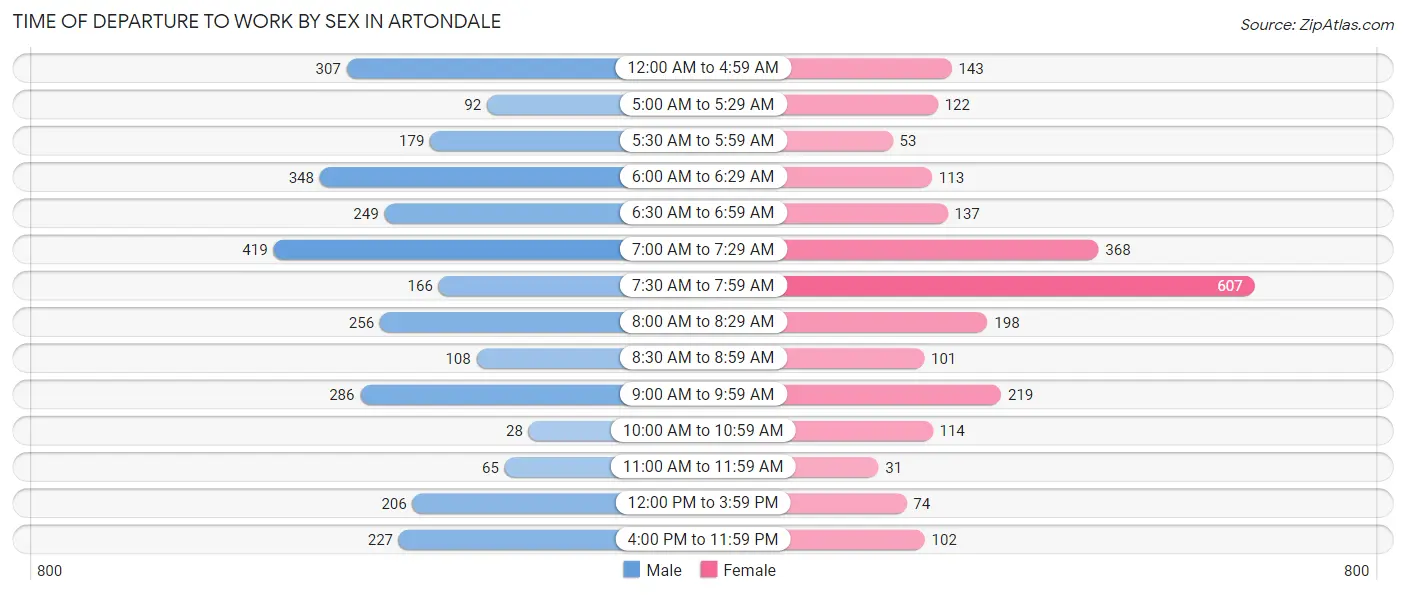
| Time of Departure | Male | Female |
| 12:00 AM to 4:59 AM | 307 (10.5%) | 143 (6.0%) |
| 5:00 AM to 5:29 AM | 92 (3.1%) | 122 (5.1%) |
| 5:30 AM to 5:59 AM | 179 (6.1%) | 53 (2.2%) |
| 6:00 AM to 6:29 AM | 348 (11.8%) | 113 (4.7%) |
| 6:30 AM to 6:59 AM | 249 (8.5%) | 137 (5.8%) |
| 7:00 AM to 7:29 AM | 419 (14.3%) | 368 (15.4%) |
| 7:30 AM to 7:59 AM | 166 (5.7%) | 607 (25.5%) |
| 8:00 AM to 8:29 AM | 256 (8.7%) | 198 (8.3%) |
| 8:30 AM to 8:59 AM | 108 (3.7%) | 101 (4.2%) |
| 9:00 AM to 9:59 AM | 286 (9.7%) | 219 (9.2%) |
| 10:00 AM to 10:59 AM | 28 (0.9%) | 114 (4.8%) |
| 11:00 AM to 11:59 AM | 65 (2.2%) | 31 (1.3%) |
| 12:00 PM to 3:59 PM | 206 (7.0%) | 74 (3.1%) |
| 4:00 PM to 11:59 PM | 227 (7.7%) | 102 (4.3%) |
| Total | 2,936 (100.0%) | 2,382 (100.0%) |
Housing Occupancy in Artondale
Occupancy by Ownership in Artondale
Of the total 5,098 dwellings in Artondale, owner-occupied units account for 4,564 (89.5%), while renter-occupied units make up 534 (10.5%).
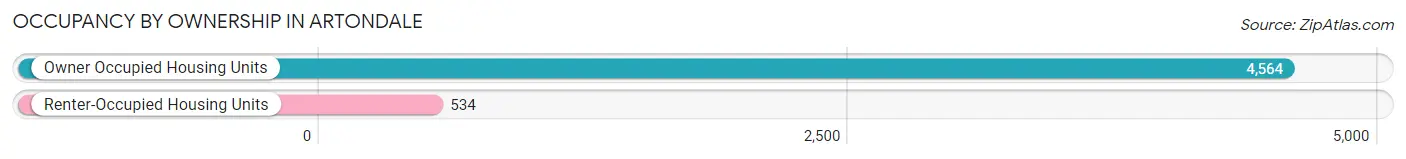
| Occupancy | # Housing Units | % Housing Units |
| Owner Occupied Housing Units | 4,564 | 89.5% |
| Renter-Occupied Housing Units | 534 | 10.5% |
| Total Occupied Housing Units | 5,098 | 100.0% |
Occupancy by Household Size in Artondale
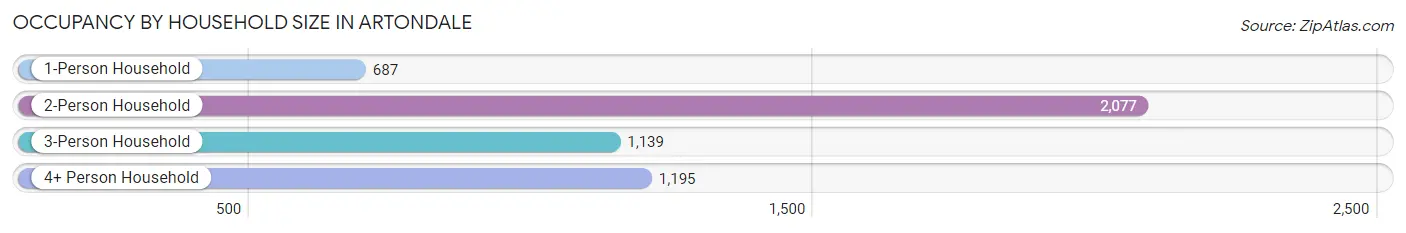
| Household Size | # Housing Units | % Housing Units |
| 1-Person Household | 687 | 13.5% |
| 2-Person Household | 2,077 | 40.7% |
| 3-Person Household | 1,139 | 22.3% |
| 4+ Person Household | 1,195 | 23.4% |
| Total Housing Units | 5,098 | 100.0% |
Occupancy by Ownership by Household Size in Artondale
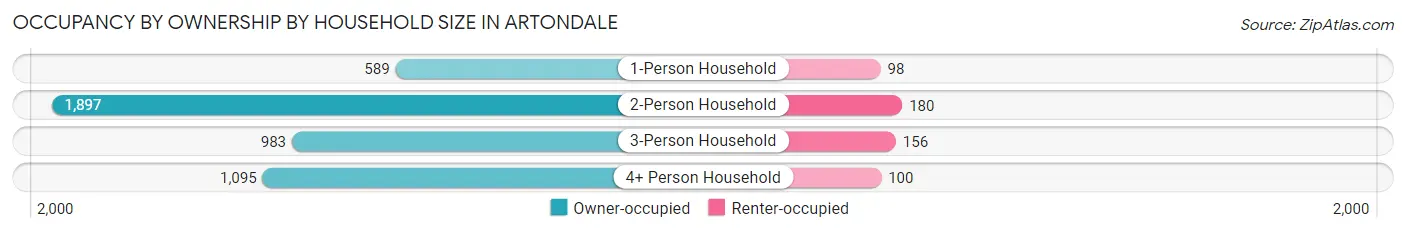
| Household Size | Owner-occupied | Renter-occupied |
| 1-Person Household | 589 (85.7%) | 98 (14.3%) |
| 2-Person Household | 1,897 (91.3%) | 180 (8.7%) |
| 3-Person Household | 983 (86.3%) | 156 (13.7%) |
| 4+ Person Household | 1,095 (91.6%) | 100 (8.4%) |
| Total Housing Units | 4,564 (89.5%) | 534 (10.5%) |
Occupancy by Educational Attainment in Artondale
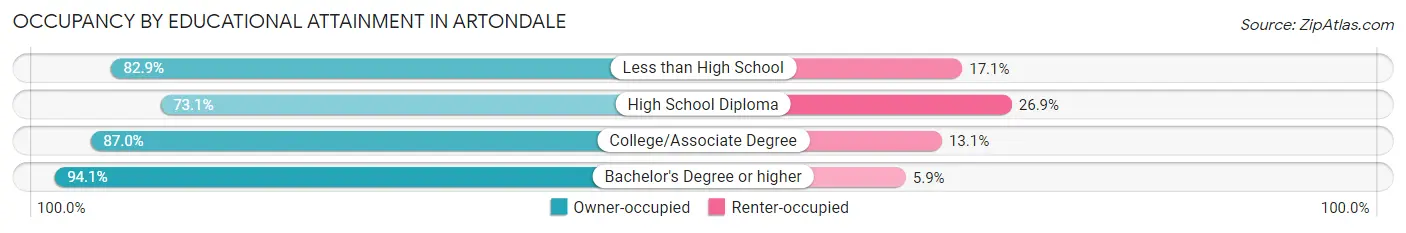
| Household Size | Owner-occupied | Renter-occupied |
| Less than High School | 34 (82.9%) | 7 (17.1%) |
| High School Diploma | 405 (73.1%) | 149 (26.9%) |
| College/Associate Degree | 1,373 (87.0%) | 206 (13.1%) |
| Bachelor's Degree or higher | 2,752 (94.1%) | 172 (5.9%) |
Occupancy by Age of Householder in Artondale
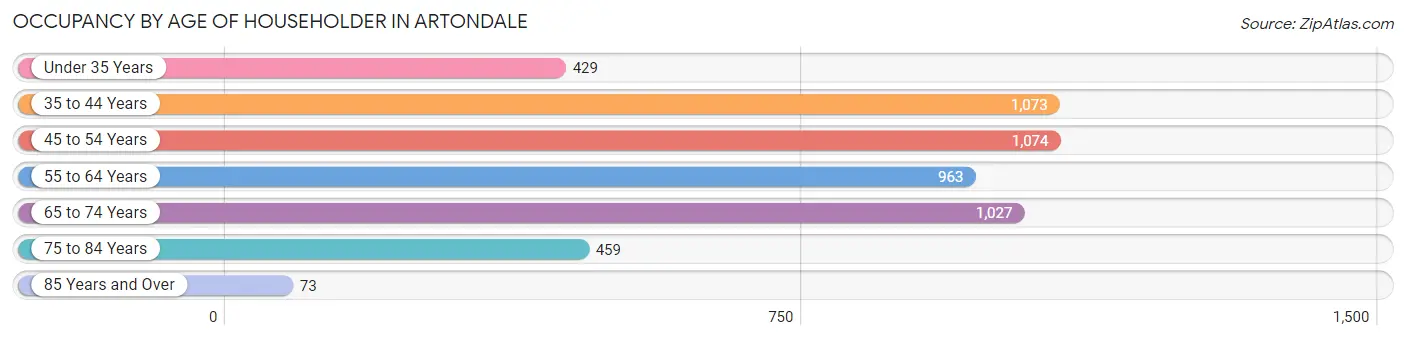
| Age Bracket | # Households | % Households |
| Under 35 Years | 429 | 8.4% |
| 35 to 44 Years | 1,073 | 21.0% |
| 45 to 54 Years | 1,074 | 21.1% |
| 55 to 64 Years | 963 | 18.9% |
| 65 to 74 Years | 1,027 | 20.2% |
| 75 to 84 Years | 459 | 9.0% |
| 85 Years and Over | 73 | 1.4% |
| Total | 5,098 | 100.0% |
Housing Finances in Artondale
Median Income by Occupancy in Artondale
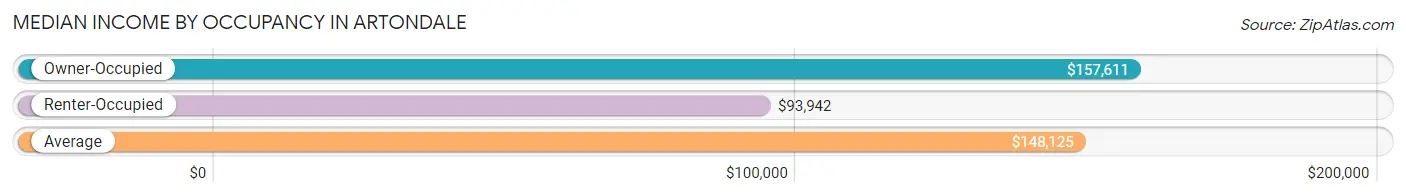
| Occupancy Type | # Households | Median Income |
| Owner-Occupied | 4,564 (89.5%) | $157,611 |
| Renter-Occupied | 534 (10.5%) | $93,942 |
| Average | 5,098 (100.0%) | $148,125 |
Occupancy by Householder Income Bracket in Artondale
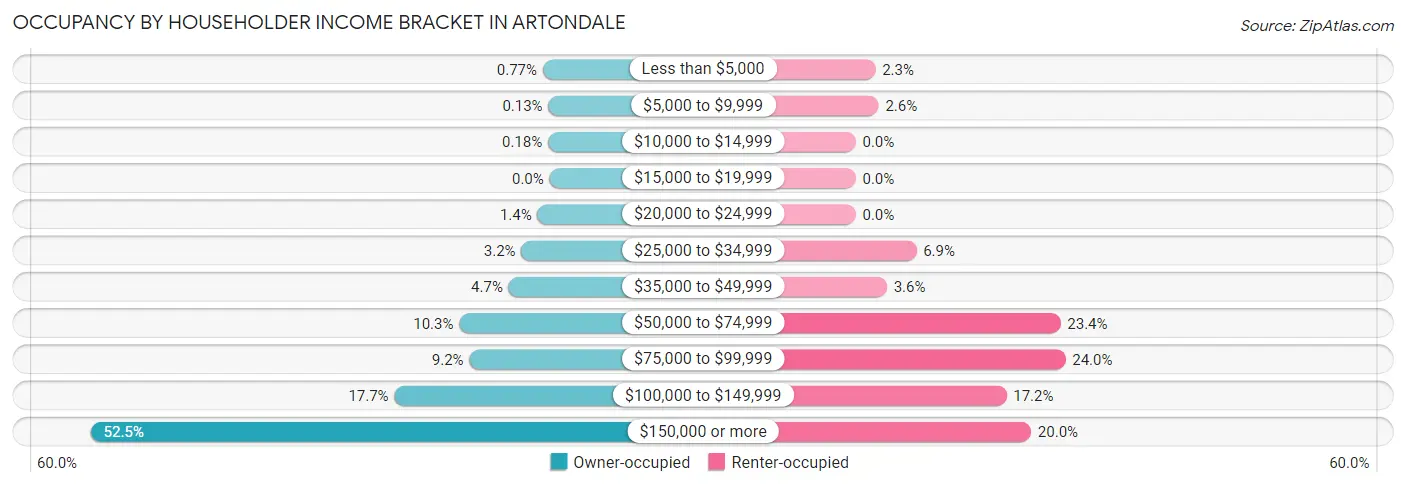
| Income Bracket | Owner-occupied | Renter-occupied |
| Less than $5,000 | 35 (0.8%) | 12 (2.2%) |
| $5,000 to $9,999 | 6 (0.1%) | 14 (2.6%) |
| $10,000 to $14,999 | 8 (0.2%) | 0 (0.0%) |
| $15,000 to $19,999 | 0 (0.0%) | 0 (0.0%) |
| $20,000 to $24,999 | 63 (1.4%) | 0 (0.0%) |
| $25,000 to $34,999 | 147 (3.2%) | 37 (6.9%) |
| $35,000 to $49,999 | 213 (4.7%) | 19 (3.6%) |
| $50,000 to $74,999 | 471 (10.3%) | 125 (23.4%) |
| $75,000 to $99,999 | 418 (9.2%) | 128 (24.0%) |
| $100,000 to $149,999 | 809 (17.7%) | 92 (17.2%) |
| $150,000 or more | 2,394 (52.4%) | 107 (20.0%) |
| Total | 4,564 (100.0%) | 534 (100.0%) |
Monthly Housing Cost Tiers in Artondale
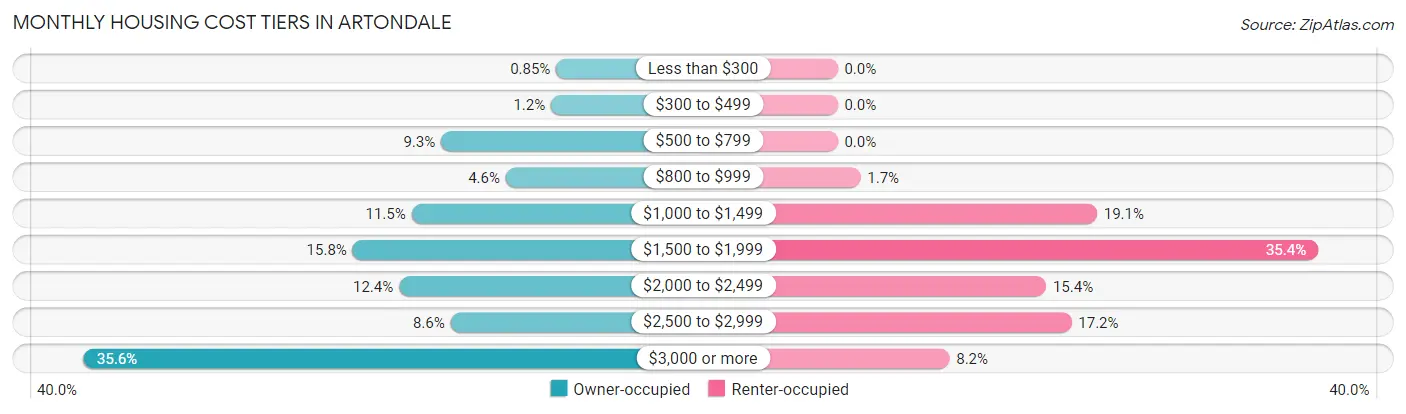
| Monthly Cost | Owner-occupied | Renter-occupied |
| Less than $300 | 39 (0.9%) | 0 (0.0%) |
| $300 to $499 | 56 (1.2%) | 0 (0.0%) |
| $500 to $799 | 426 (9.3%) | 0 (0.0%) |
| $800 to $999 | 208 (4.6%) | 9 (1.7%) |
| $1,000 to $1,499 | 525 (11.5%) | 102 (19.1%) |
| $1,500 to $1,999 | 723 (15.8%) | 189 (35.4%) |
| $2,000 to $2,499 | 567 (12.4%) | 82 (15.4%) |
| $2,500 to $2,999 | 394 (8.6%) | 92 (17.2%) |
| $3,000 or more | 1,626 (35.6%) | 44 (8.2%) |
| Total | 4,564 (100.0%) | 534 (100.0%) |
Physical Housing Characteristics in Artondale
Housing Structures in Artondale
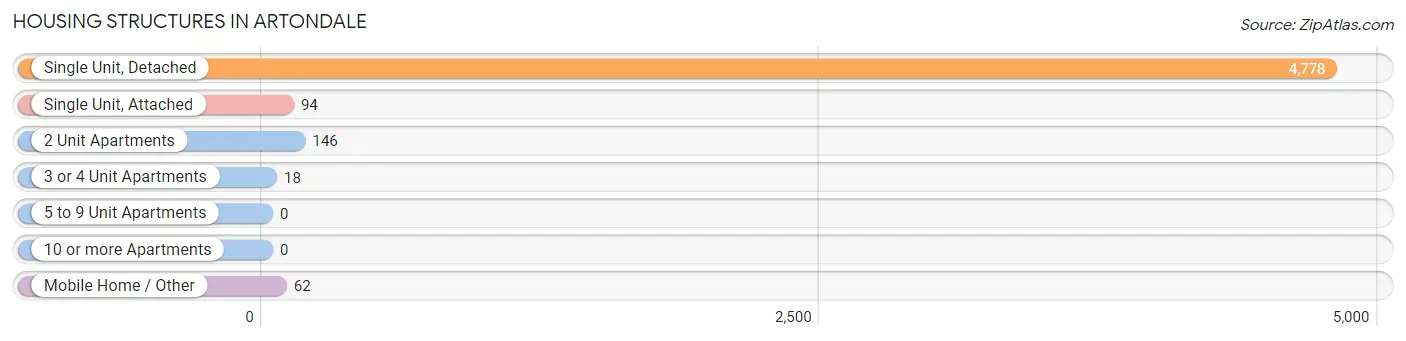
| Structure Type | # Housing Units | % Housing Units |
| Single Unit, Detached | 4,778 | 93.7% |
| Single Unit, Attached | 94 | 1.8% |
| 2 Unit Apartments | 146 | 2.9% |
| 3 or 4 Unit Apartments | 18 | 0.4% |
| 5 to 9 Unit Apartments | 0 | 0.0% |
| 10 or more Apartments | 0 | 0.0% |
| Mobile Home / Other | 62 | 1.2% |
| Total | 5,098 | 100.0% |
Housing Structures by Occupancy in Artondale
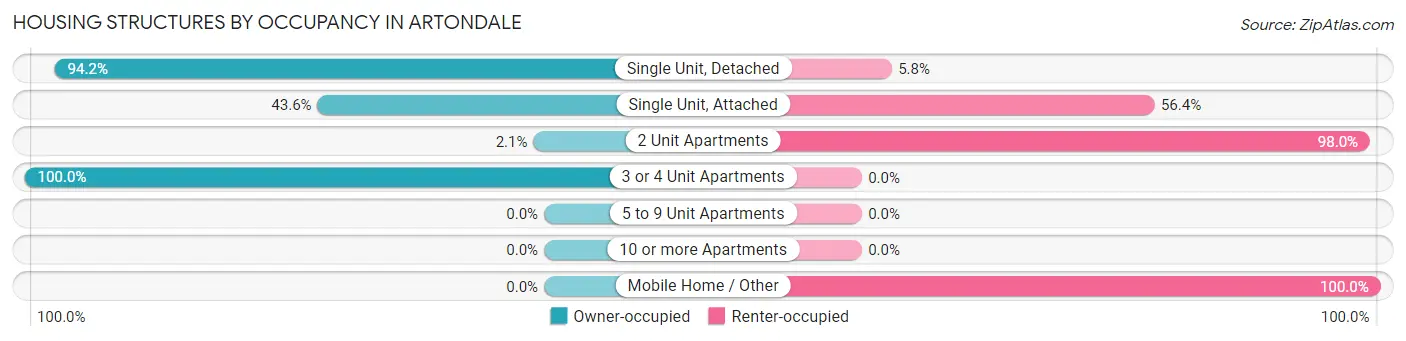
| Structure Type | Owner-occupied | Renter-occupied |
| Single Unit, Detached | 4,502 (94.2%) | 276 (5.8%) |
| Single Unit, Attached | 41 (43.6%) | 53 (56.4%) |
| 2 Unit Apartments | 3 (2.1%) | 143 (98.0%) |
| 3 or 4 Unit Apartments | 18 (100.0%) | 0 (0.0%) |
| 5 to 9 Unit Apartments | 0 (0.0%) | 0 (0.0%) |
| 10 or more Apartments | 0 (0.0%) | 0 (0.0%) |
| Mobile Home / Other | 0 (0.0%) | 62 (100.0%) |
| Total | 4,564 (89.5%) | 534 (10.5%) |
Housing Structures by Number of Rooms in Artondale
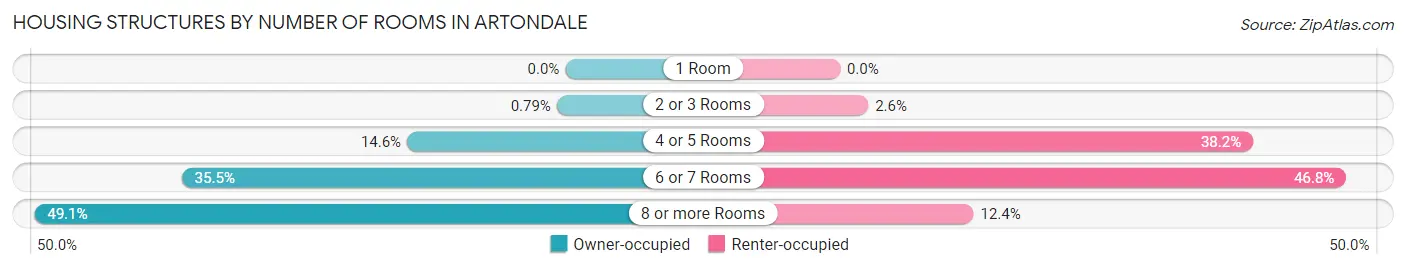
| Number of Rooms | Owner-occupied | Renter-occupied |
| 1 Room | 0 (0.0%) | 0 (0.0%) |
| 2 or 3 Rooms | 36 (0.8%) | 14 (2.6%) |
| 4 or 5 Rooms | 668 (14.6%) | 204 (38.2%) |
| 6 or 7 Rooms | 1,619 (35.5%) | 250 (46.8%) |
| 8 or more Rooms | 2,241 (49.1%) | 66 (12.4%) |
| Total | 4,564 (100.0%) | 534 (100.0%) |
Housing Structure by Heating Type in Artondale
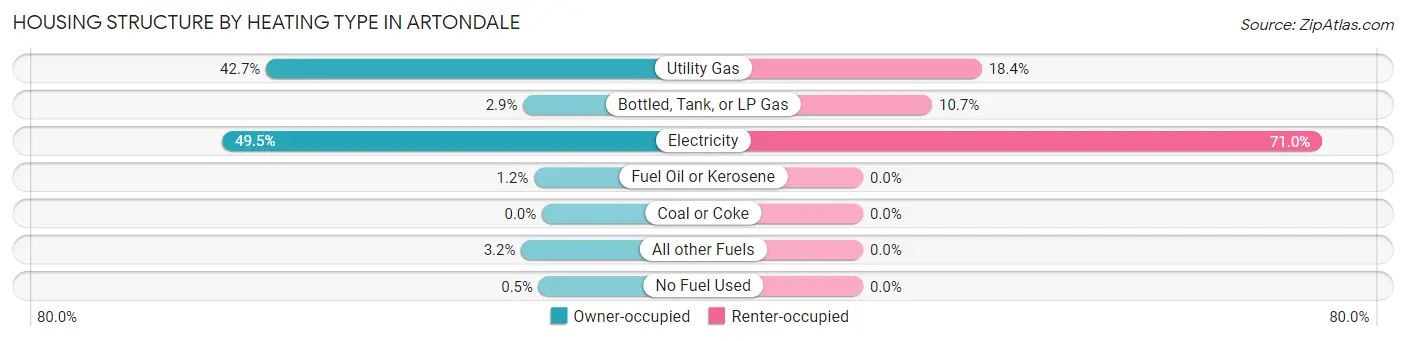
| Heating Type | Owner-occupied | Renter-occupied |
| Utility Gas | 1,947 (42.7%) | 98 (18.3%) |
| Bottled, Tank, or LP Gas | 133 (2.9%) | 57 (10.7%) |
| Electricity | 2,258 (49.5%) | 379 (71.0%) |
| Fuel Oil or Kerosene | 56 (1.2%) | 0 (0.0%) |
| Coal or Coke | 0 (0.0%) | 0 (0.0%) |
| All other Fuels | 147 (3.2%) | 0 (0.0%) |
| No Fuel Used | 23 (0.5%) | 0 (0.0%) |
| Total | 4,564 (100.0%) | 534 (100.0%) |
Household Vehicle Usage in Artondale
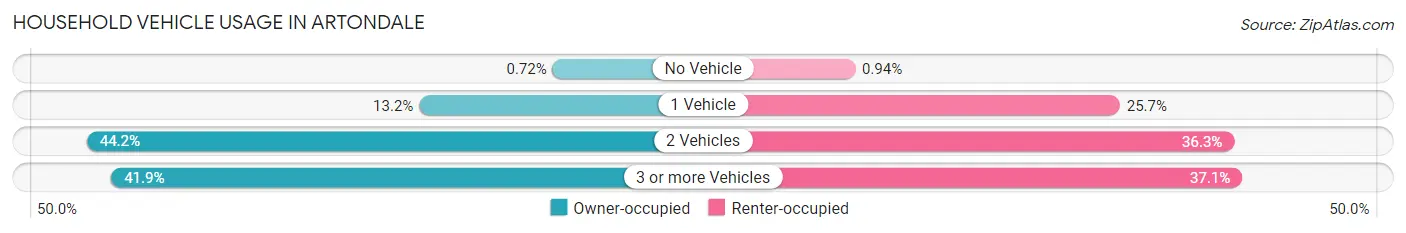
| Vehicles per Household | Owner-occupied | Renter-occupied |
| No Vehicle | 33 (0.7%) | 5 (0.9%) |
| 1 Vehicle | 601 (13.2%) | 137 (25.7%) |
| 2 Vehicles | 2,017 (44.2%) | 194 (36.3%) |
| 3 or more Vehicles | 1,913 (41.9%) | 198 (37.1%) |
| Total | 4,564 (100.0%) | 534 (100.0%) |
Real Estate & Mortgages in Artondale
Real Estate and Mortgage Overview in Artondale
| Characteristic | Without Mortgage | With Mortgage |
| Housing Units | 1,151 | 3,413 |
| Median Property Value | $726,000 | $694,400 |
| Median Household Income | $92,708 | $2,046 |
| Monthly Housing Costs | $880 | $1,586 |
| Real Estate Taxes | $6,250 | $16 |
Property Value by Mortgage Status in Artondale
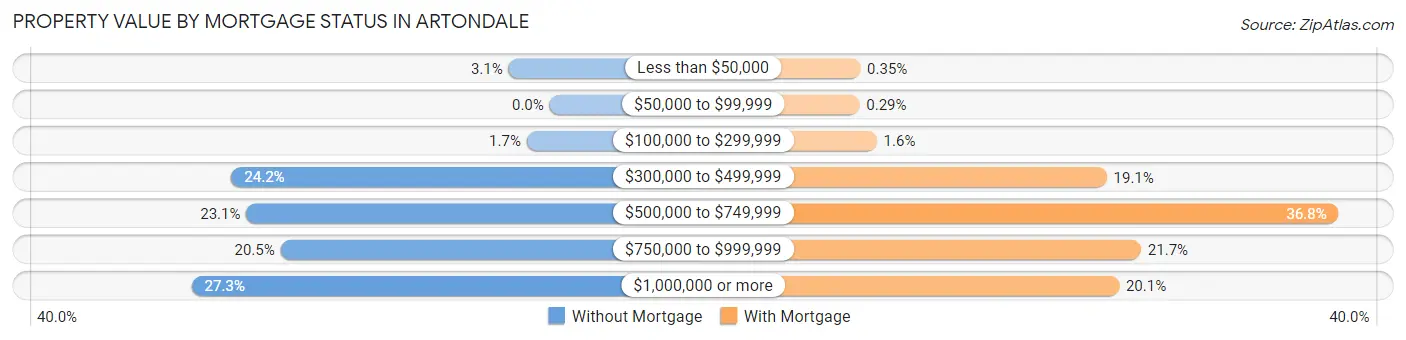
| Property Value | Without Mortgage | With Mortgage |
| Less than $50,000 | 36 (3.1%) | 12 (0.4%) |
| $50,000 to $99,999 | 0 (0.0%) | 10 (0.3%) |
| $100,000 to $299,999 | 20 (1.7%) | 55 (1.6%) |
| $300,000 to $499,999 | 279 (24.2%) | 653 (19.1%) |
| $500,000 to $749,999 | 266 (23.1%) | 1,256 (36.8%) |
| $750,000 to $999,999 | 236 (20.5%) | 742 (21.7%) |
| $1,000,000 or more | 314 (27.3%) | 685 (20.1%) |
| Total | 1,151 (100.0%) | 3,413 (100.0%) |
Household Income by Mortgage Status in Artondale
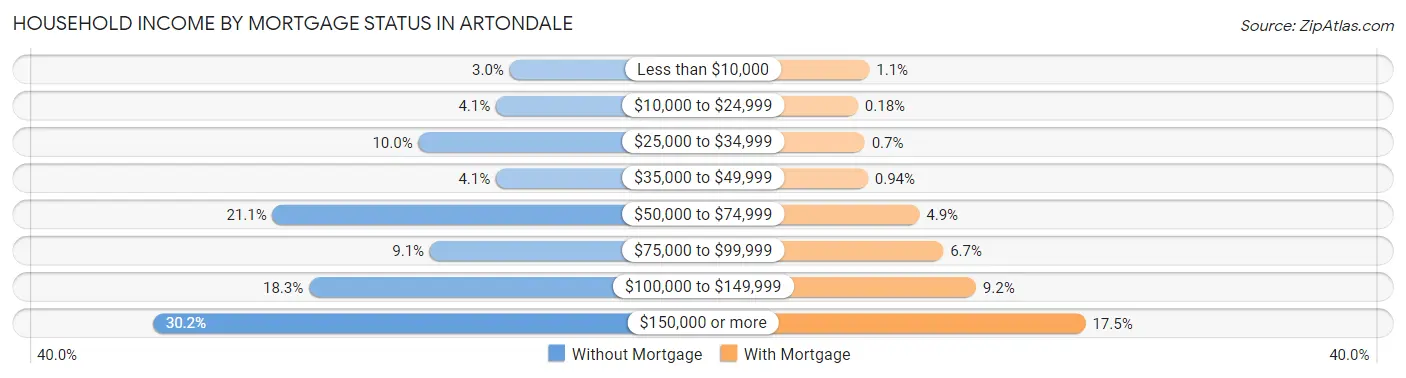
| Household Income | Without Mortgage | With Mortgage |
| Less than $10,000 | 35 (3.0%) | 36 (1.1%) |
| $10,000 to $24,999 | 47 (4.1%) | 6 (0.2%) |
| $25,000 to $34,999 | 115 (10.0%) | 24 (0.7%) |
| $35,000 to $49,999 | 47 (4.1%) | 32 (0.9%) |
| $50,000 to $74,999 | 243 (21.1%) | 166 (4.9%) |
| $75,000 to $99,999 | 105 (9.1%) | 228 (6.7%) |
| $100,000 to $149,999 | 211 (18.3%) | 313 (9.2%) |
| $150,000 or more | 348 (30.2%) | 598 (17.5%) |
| Total | 1,151 (100.0%) | 3,413 (100.0%) |
Property Value to Household Income Ratio in Artondale
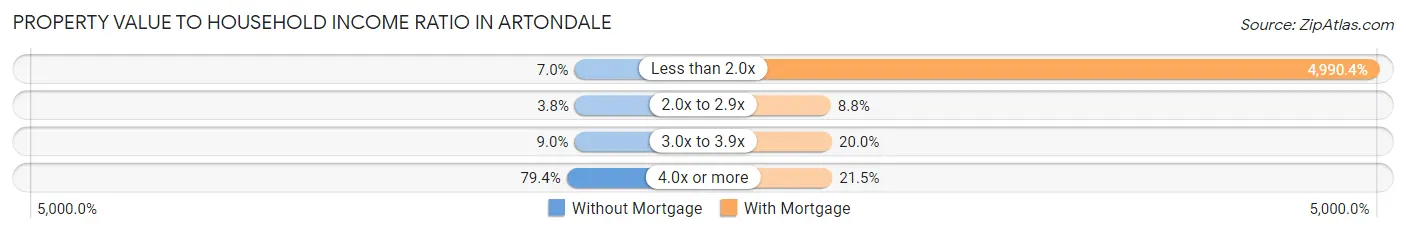
| Value-to-Income Ratio | Without Mortgage | With Mortgage |
| Less than 2.0x | 81 (7.0%) | 170,322 (4,990.4%) |
| 2.0x to 2.9x | 44 (3.8%) | 299 (8.8%) |
| 3.0x to 3.9x | 103 (8.9%) | 683 (20.0%) |
| 4.0x or more | 914 (79.4%) | 735 (21.5%) |
| Total | 1,151 (100.0%) | 3,413 (100.0%) |
Real Estate Taxes by Mortgage Status in Artondale
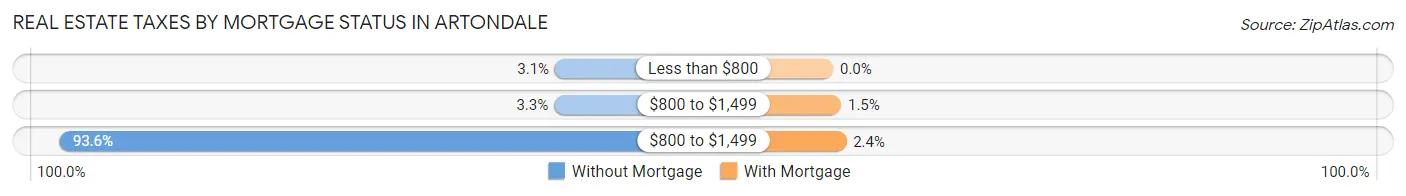
| Property Taxes | Without Mortgage | With Mortgage |
| Less than $800 | 36 (3.1%) | 0 (0.0%) |
| $800 to $1,499 | 38 (3.3%) | 50 (1.5%) |
| $800 to $1,499 | 1,077 (93.6%) | 82 (2.4%) |
| Total | 1,151 (100.0%) | 3,413 (100.0%) |
Health & Disability in Artondale
Health Insurance Coverage by Age in Artondale
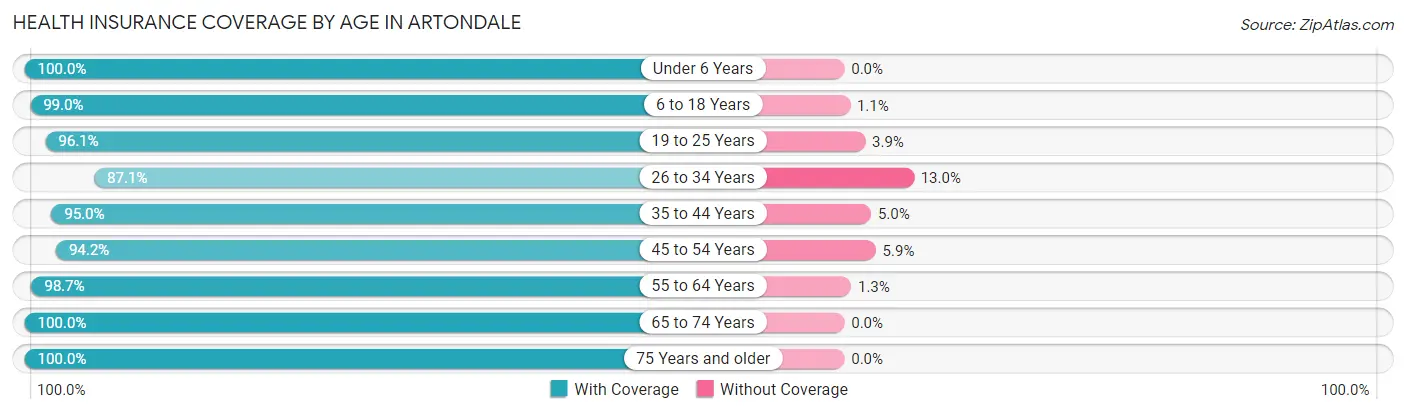
| Age Bracket | With Coverage | Without Coverage |
| Under 6 Years | 1,139 (100.0%) | 0 (0.0%) |
| 6 to 18 Years | 2,456 (99.0%) | 26 (1.1%) |
| 19 to 25 Years | 718 (96.1%) | 29 (3.9%) |
| 26 to 34 Years | 887 (87.1%) | 132 (13.0%) |
| 35 to 44 Years | 1,811 (95.0%) | 95 (5.0%) |
| 45 to 54 Years | 1,867 (94.2%) | 116 (5.9%) |
| 55 to 64 Years | 1,879 (98.7%) | 24 (1.3%) |
| 65 to 74 Years | 1,700 (100.0%) | 0 (0.0%) |
| 75 Years and older | 883 (100.0%) | 0 (0.0%) |
| Total | 13,340 (96.9%) | 422 (3.1%) |
Health Insurance Coverage by Citizenship Status in Artondale

| Citizenship Status | With Coverage | Without Coverage |
| Native Born | 1,139 (100.0%) | 0 (0.0%) |
| Foreign Born, Citizen | 2,456 (99.0%) | 26 (1.1%) |
| Foreign Born, not a Citizen | 718 (96.1%) | 29 (3.9%) |
Health Insurance Coverage by Household Income in Artondale
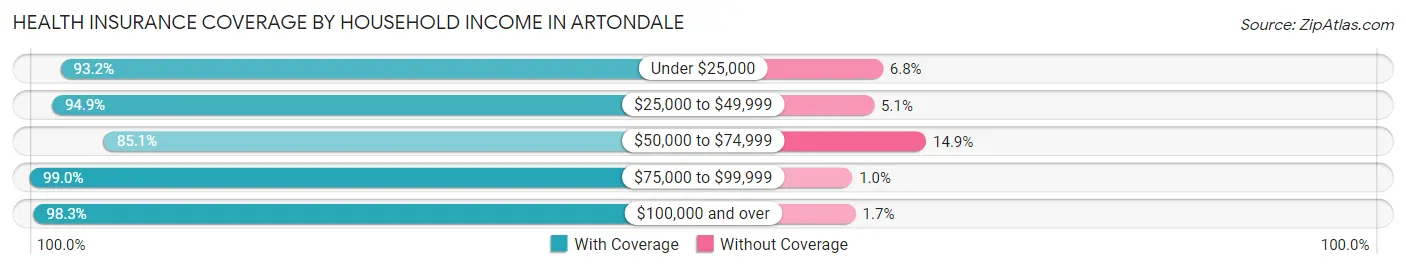
| Household Income | With Coverage | Without Coverage |
| Under $25,000 | 207 (93.2%) | 15 (6.8%) |
| $25,000 to $49,999 | 721 (94.9%) | 39 (5.1%) |
| $50,000 to $74,999 | 1,043 (85.1%) | 182 (14.9%) |
| $75,000 to $99,999 | 1,349 (99.0%) | 14 (1.0%) |
| $100,000 and over | 9,992 (98.3%) | 169 (1.7%) |
Public vs Private Health Insurance Coverage by Age in Artondale
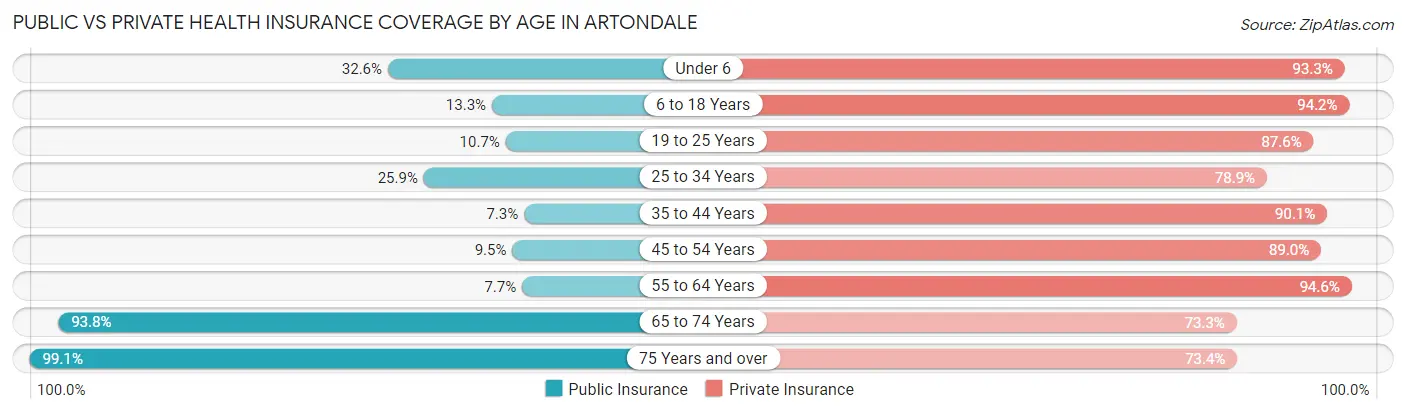
| Age Bracket | Public Insurance | Private Insurance |
| Under 6 | 371 (32.6%) | 1,063 (93.3%) |
| 6 to 18 Years | 329 (13.3%) | 2,338 (94.2%) |
| 19 to 25 Years | 80 (10.7%) | 654 (87.5%) |
| 25 to 34 Years | 264 (25.9%) | 804 (78.9%) |
| 35 to 44 Years | 139 (7.3%) | 1,717 (90.1%) |
| 45 to 54 Years | 188 (9.5%) | 1,764 (89.0%) |
| 55 to 64 Years | 146 (7.7%) | 1,801 (94.6%) |
| 65 to 74 Years | 1,594 (93.8%) | 1,246 (73.3%) |
| 75 Years and over | 875 (99.1%) | 648 (73.4%) |
| Total | 3,986 (29.0%) | 12,035 (87.5%) |
Disability Status by Sex by Age in Artondale
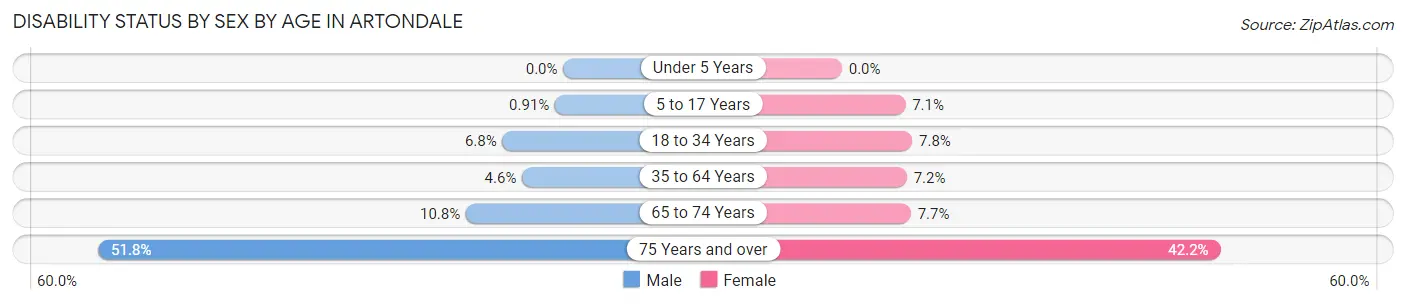
| Age Bracket | Male | Female |
| Under 5 Years | 0 (0.0%) | 0 (0.0%) |
| 5 to 17 Years | 12 (0.9%) | 89 (7.1%) |
| 18 to 34 Years | 71 (6.8%) | 69 (7.8%) |
| 35 to 64 Years | 126 (4.6%) | 220 (7.2%) |
| 65 to 74 Years | 94 (10.8%) | 64 (7.7%) |
| 75 Years and over | 213 (51.8%) | 199 (42.2%) |
Disability Class by Sex by Age in Artondale
Disability Class: Hearing Difficulty
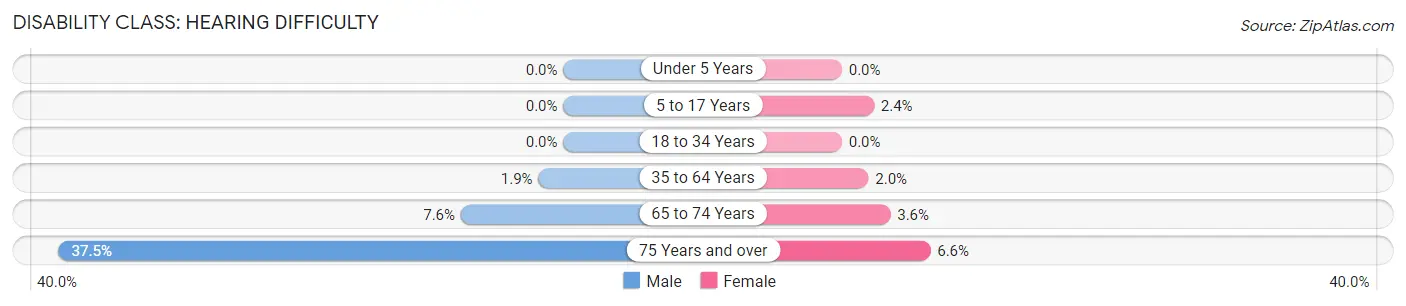
| Age Bracket | Male | Female |
| Under 5 Years | 0 (0.0%) | 0 (0.0%) |
| 5 to 17 Years | 0 (0.0%) | 30 (2.4%) |
| 18 to 34 Years | 0 (0.0%) | 0 (0.0%) |
| 35 to 64 Years | 51 (1.8%) | 60 (2.0%) |
| 65 to 74 Years | 66 (7.6%) | 30 (3.6%) |
| 75 Years and over | 154 (37.5%) | 31 (6.6%) |
Disability Class: Vision Difficulty
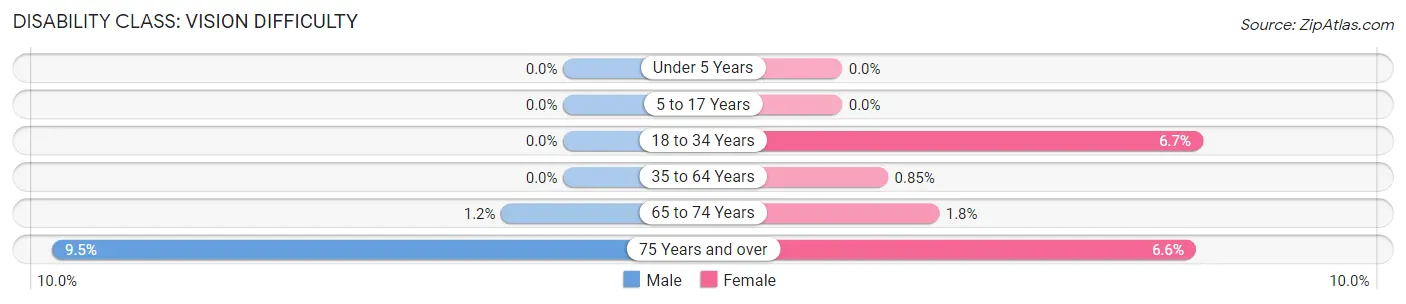
| Age Bracket | Male | Female |
| Under 5 Years | 0 (0.0%) | 0 (0.0%) |
| 5 to 17 Years | 0 (0.0%) | 0 (0.0%) |
| 18 to 34 Years | 0 (0.0%) | 59 (6.7%) |
| 35 to 64 Years | 0 (0.0%) | 26 (0.9%) |
| 65 to 74 Years | 10 (1.1%) | 15 (1.8%) |
| 75 Years and over | 39 (9.5%) | 31 (6.6%) |
Disability Class: Cognitive Difficulty
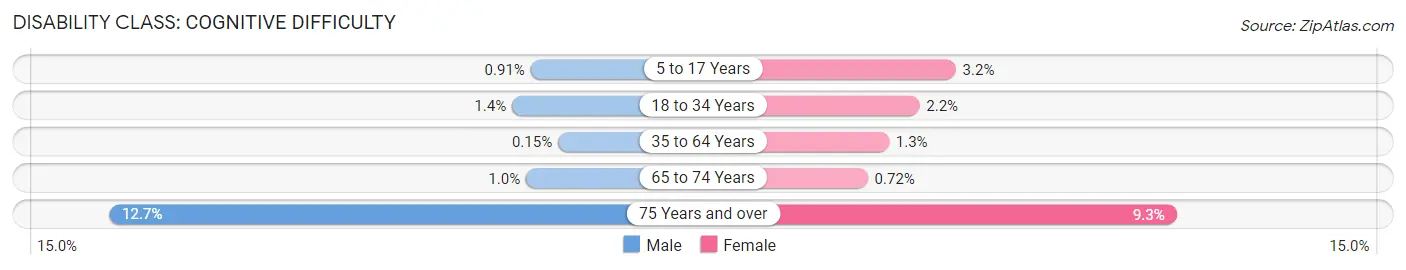
| Age Bracket | Male | Female |
| 5 to 17 Years | 12 (0.9%) | 40 (3.2%) |
| 18 to 34 Years | 15 (1.4%) | 19 (2.2%) |
| 35 to 64 Years | 4 (0.2%) | 40 (1.3%) |
| 65 to 74 Years | 9 (1.0%) | 6 (0.7%) |
| 75 Years and over | 52 (12.7%) | 44 (9.3%) |
Disability Class: Ambulatory Difficulty
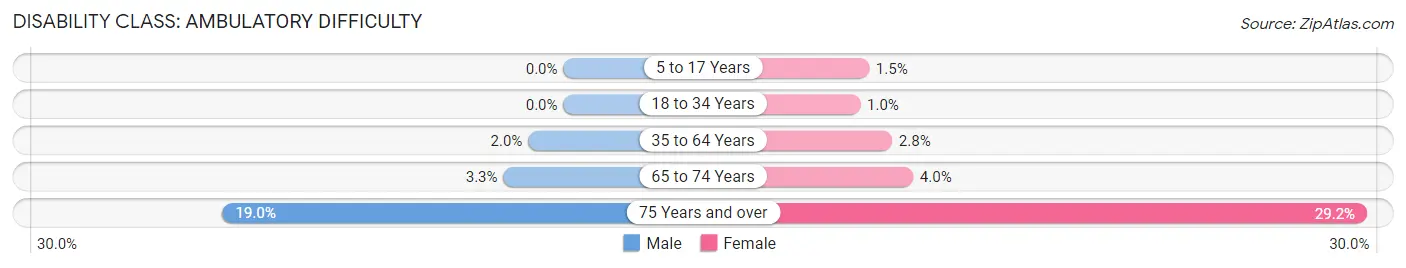
| Age Bracket | Male | Female |
| 5 to 17 Years | 0 (0.0%) | 19 (1.5%) |
| 18 to 34 Years | 0 (0.0%) | 9 (1.0%) |
| 35 to 64 Years | 54 (2.0%) | 85 (2.8%) |
| 65 to 74 Years | 29 (3.3%) | 33 (4.0%) |
| 75 Years and over | 78 (19.0%) | 138 (29.2%) |
Disability Class: Self-Care Difficulty
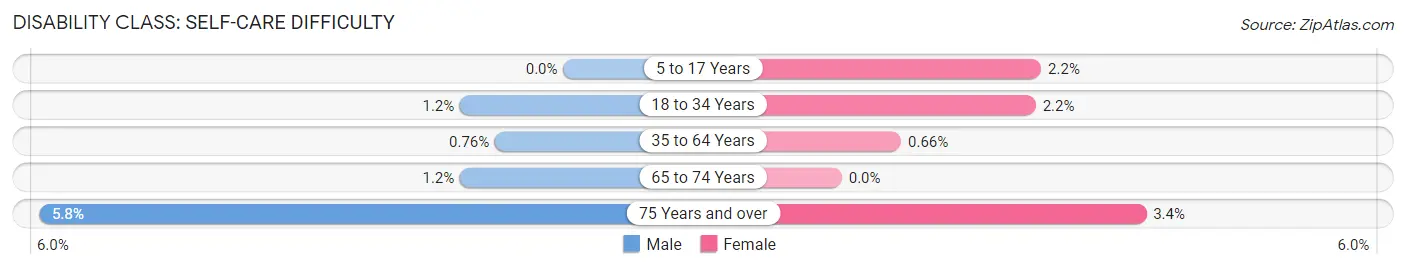
| Age Bracket | Male | Female |
| 5 to 17 Years | 0 (0.0%) | 28 (2.2%) |
| 18 to 34 Years | 12 (1.1%) | 19 (2.2%) |
| 35 to 64 Years | 21 (0.8%) | 20 (0.7%) |
| 65 to 74 Years | 10 (1.1%) | 0 (0.0%) |
| 75 Years and over | 24 (5.8%) | 16 (3.4%) |
Technology Access in Artondale
Computing Device Access in Artondale
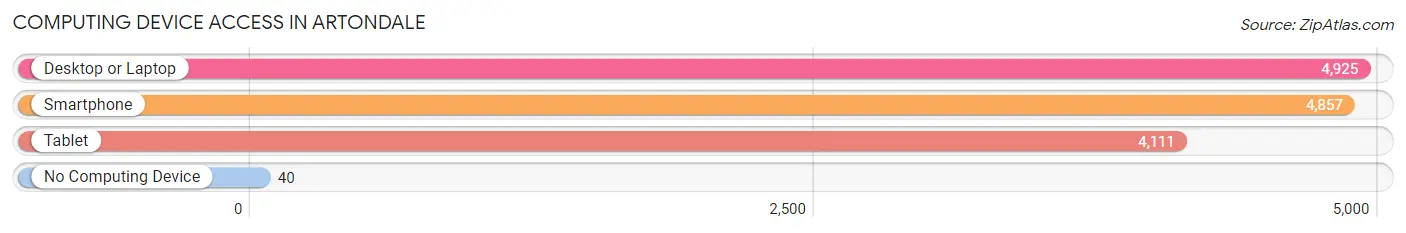
| Device Type | # Households | % Households |
| Desktop or Laptop | 4,925 | 96.6% |
| Smartphone | 4,857 | 95.3% |
| Tablet | 4,111 | 80.6% |
| No Computing Device | 40 | 0.8% |
| Total | 5,098 | 100.0% |
Internet Access in Artondale
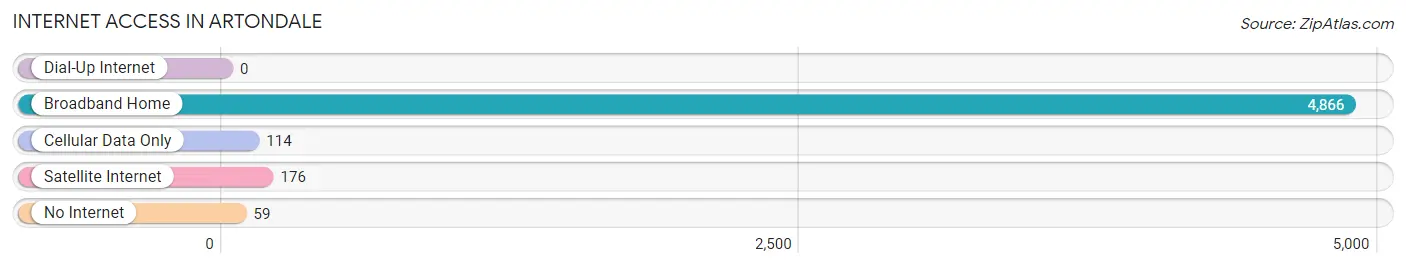
| Internet Type | # Households | % Households |
| Dial-Up Internet | 0 | 0.0% |
| Broadband Home | 4,866 | 95.5% |
| Cellular Data Only | 114 | 2.2% |
| Satellite Internet | 176 | 3.5% |
| No Internet | 59 | 1.2% |
| Total | 5,098 | 100.0% |
Artondale Summary
History
Artondale is a small unincorporated community located in Pierce County, Washington, United States. It is located on the Key Peninsula, a peninsula that separates Puget Sound from the Strait of Juan de Fuca. The area was first settled in the late 1800s by homesteaders, and the community was officially established in 1909. The name Artondale was derived from the first two letters of the names of the two original settlers, Arthur and Della.
The area was originally a logging and fishing community, and the local economy was largely based on these industries. In the early 1900s, the area was home to several sawmills, a cannery, and a fish hatchery. The logging industry declined in the mid-1900s, and the local economy shifted to focus on tourism and recreation.
Geography
Artondale is located on the Key Peninsula, a peninsula that separates Puget Sound from the Strait of Juan de Fuca. The area is characterized by rolling hills, forests, and wetlands. The climate is mild, with temperatures ranging from the mid-30s in the winter to the mid-70s in the summer.
The area is home to several parks and recreational areas, including the Key Peninsula Civic Center, which offers a variety of activities and events. The area is also home to several lakes, including Lake Artondale, which is popular for fishing and boating.
Economy
The local economy is largely based on tourism and recreation. The area is home to several parks and recreational areas, including the Key Peninsula Civic Center, which offers a variety of activities and events. The area is also home to several lakes, including Lake Artondale, which is popular for fishing and boating.
The area is also home to several businesses, including restaurants, retail stores, and a marina. The local economy is also supported by the nearby Joint Base Lewis-McChord, which is a major employer in the area.
Demographics
As of the 2010 census, the population of Artondale was 1,845. The population is largely white (93.3%), with a small percentage of African Americans (2.2%), Asians (1.7%), and Native Americans (0.7%). The median household income is $50,000, and the median age is 44.
Conclusion
Artondale is a small unincorporated community located in Pierce County, Washington. It was first settled in the late 1800s by homesteaders, and the community was officially established in 1909. The area is characterized by rolling hills, forests, and wetlands, and the local economy is largely based on tourism and recreation. As of the 2010 census, the population of Artondale was 1,845, and the median household income is $50,000.
Common Questions
What is Per Capita Income in Artondale?
Per Capita income in Artondale is $65,599.
What is the Median Family Income in Artondale?
Median Family Income in Artondale is $156,554.
What is the Median Household income in Artondale?
Median Household Income in Artondale is $148,125.
What is Income or Wage Gap in Artondale?
Income or Wage Gap in Artondale is 35.1%.
Women in Artondale earn 64.9 cents for every dollar earned by a man.
What is Inequality or Gini Index in Artondale?
Inequality or Gini Index in Artondale is 0.40.
What is the Total Population of Artondale?
Total Population of Artondale is 13,862.
What is the Total Male Population of Artondale?
Total Male Population of Artondale is 6,994.
What is the Total Female Population of Artondale?
Total Female Population of Artondale is 6,868.
What is the Ratio of Males per 100 Females in Artondale?
There are 101.83 Males per 100 Females in Artondale.
What is the Ratio of Females per 100 Males in Artondale?
There are 98.20 Females per 100 Males in Artondale.
What is the Median Population Age in Artondale?
Median Population Age in Artondale is 42.2 Years.
What is the Average Family Size in Artondale
Average Family Size in Artondale is 3.0 People.
What is the Average Household Size in Artondale
Average Household Size in Artondale is 2.7 People.
How Large is the Labor Force in Artondale?
There are 6,635 People in the Labor Forcein in Artondale.
What is the Percentage of People in the Labor Force in Artondale?
61.4% of People are in the Labor Force in Artondale.
What is the Unemployment Rate in Artondale?
Unemployment Rate in Artondale is 2.4%.